Supply and demand fundamentals support the grain markets. According to the US Census Bureau, the global population grows by approximately twenty million each quarter. At the turn of this century, there were around six billion people on our planet. As of the end of October 2020, over 7.694 billion people inhabited the earth, increasing over 28.2% in two decades. Each day there are more mouths to feed, and grains provide nutrition. The bottom line is that the demand side of the equation is always expanding.
When it comes to supplies, the weather each year is the primary factor for prices. The last time a severe drought impacted US crops was in 2012. The dry conditions pushed corn and soybean prices to all-time highs of $8.4375 and $17.9475 per bushel, respectively. CBOT hard red winter wheat rose to a high of $9.4725 per bushel in 2012. Weather conditions supported bumper crops over the past eight years, but the number of mouths to feed grew by around 640 million over that period. Therefore, any supply issues would likely push prices to the upside.
The August 10 derecho that swept across the fertile plains of the US grain belt was a reminder of the impact of the weather on supplies. Since then, grain prices have been in bullish mode and continued to make higher highs as the harvest season in the northern hemisphere ended. The buying seemed to end during the final week of October.
Corn moves to a new peak for 2020
The continuous CBOT corn futures contract traded to a low of $3.0025 per bushel in late April as risk-off conditions gripped markets across all asset classes. The price was the lowest in eleven years, since 2009.
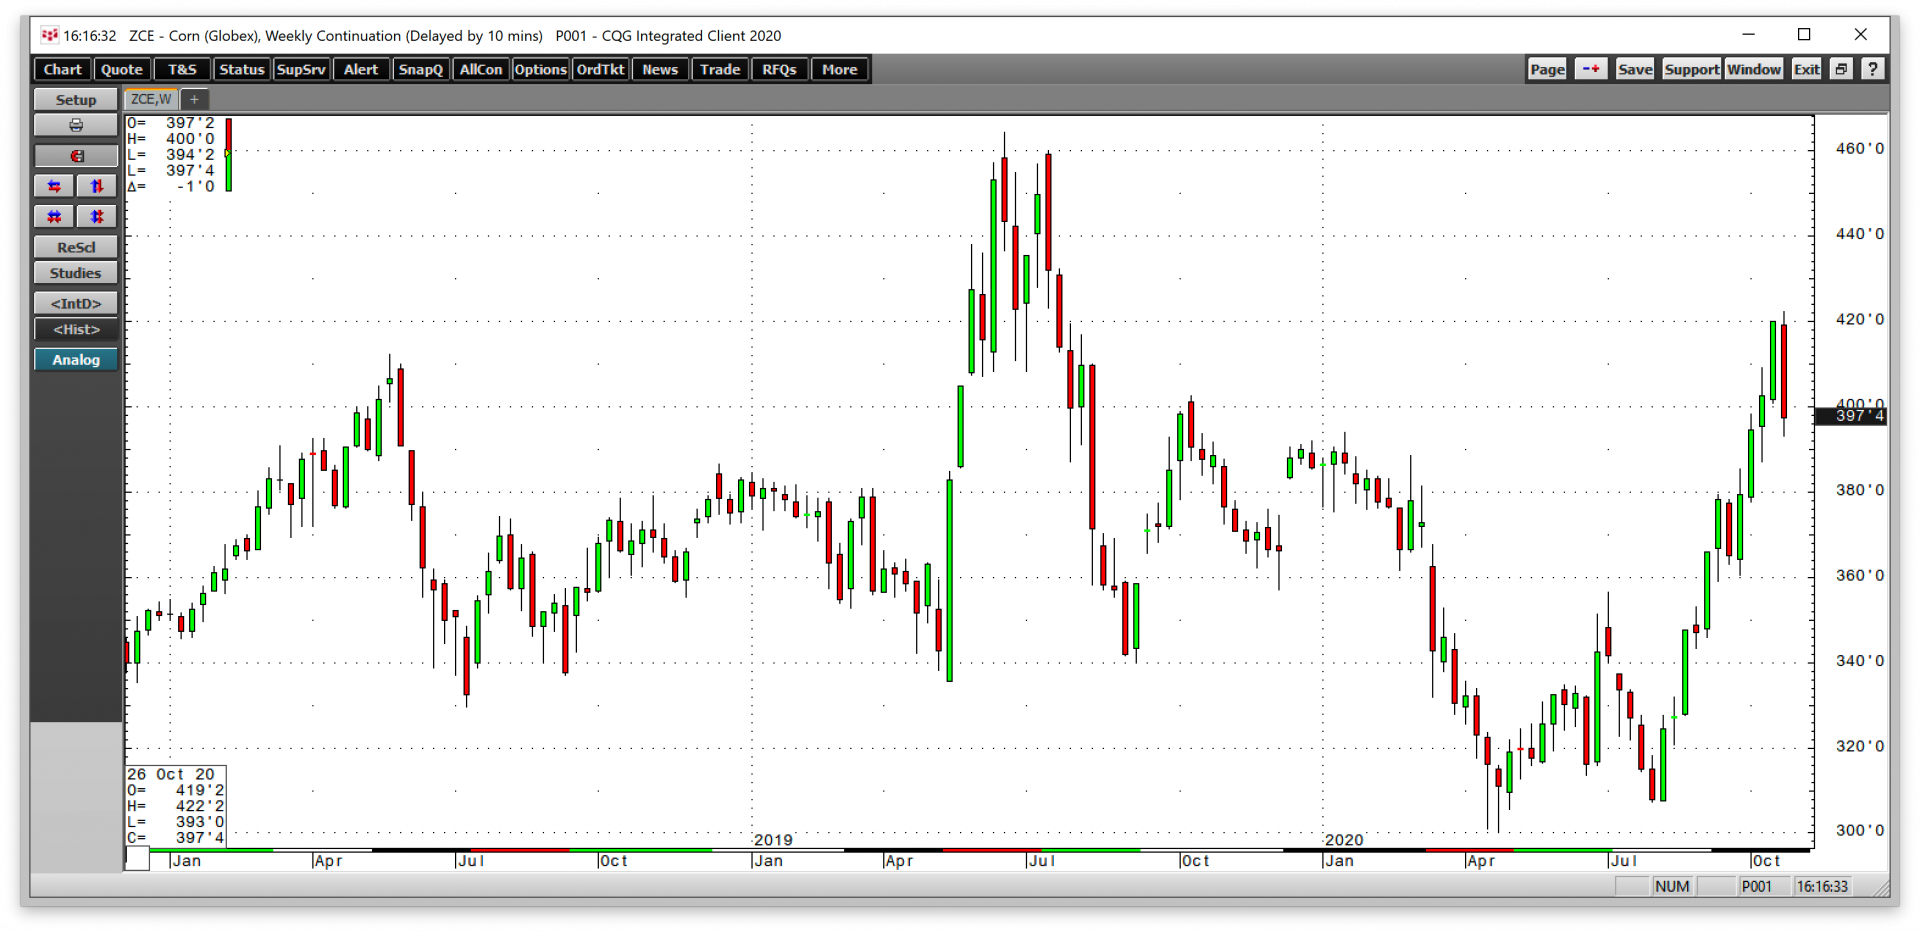
As the chart highlights, the $3 level was a significant bottom that launched a recovery rally to the $3.5650 level in early July. After a correction to a higher low of $3.0725 in early August, corn took off on the upside, reaching a peak of $4.2225 during the final week of October. However, the December contract made a higher high and closed below the previous week’s low on October 30, putting in a bearish reversal on the weekly chart to end the month. December CBOT corn futures settled at $3.9850 on the final day of October.
Soybeans rise to the highest price since 2016
CBOT soybean futures did not put in a bearish reversal to end the month, but the price corrected. The nearby bean futures hit bottom at $8.0825 in April, which was a higher low than in 2019 when the oilseed futures fell to $7.8050. The trade war with China weighed heavily on the soybean market as the Chinese had traditionally purchased one-quarter of the US annual oilseed crop.

The monthly chart shows that October was the fifth consecutive month of gains in the soybean futures market. The nearby price traded to a high of $10.94 per bushel, the highest level in over four years since July 2016. A decline in production and a rush of buying from China lifted the price of soybeans to the high in October. January soybean futures settled at $10.5625 on October 30.
Wheat reaches a six-year high
Perhaps the most dramatic rally came in the wheat market. Dry conditions in Europe, Russia, and the US, and Chinese demand pushed the price of CBOT hard red winter wheat futures higher after making a low of $4.6825 per bushel in June.
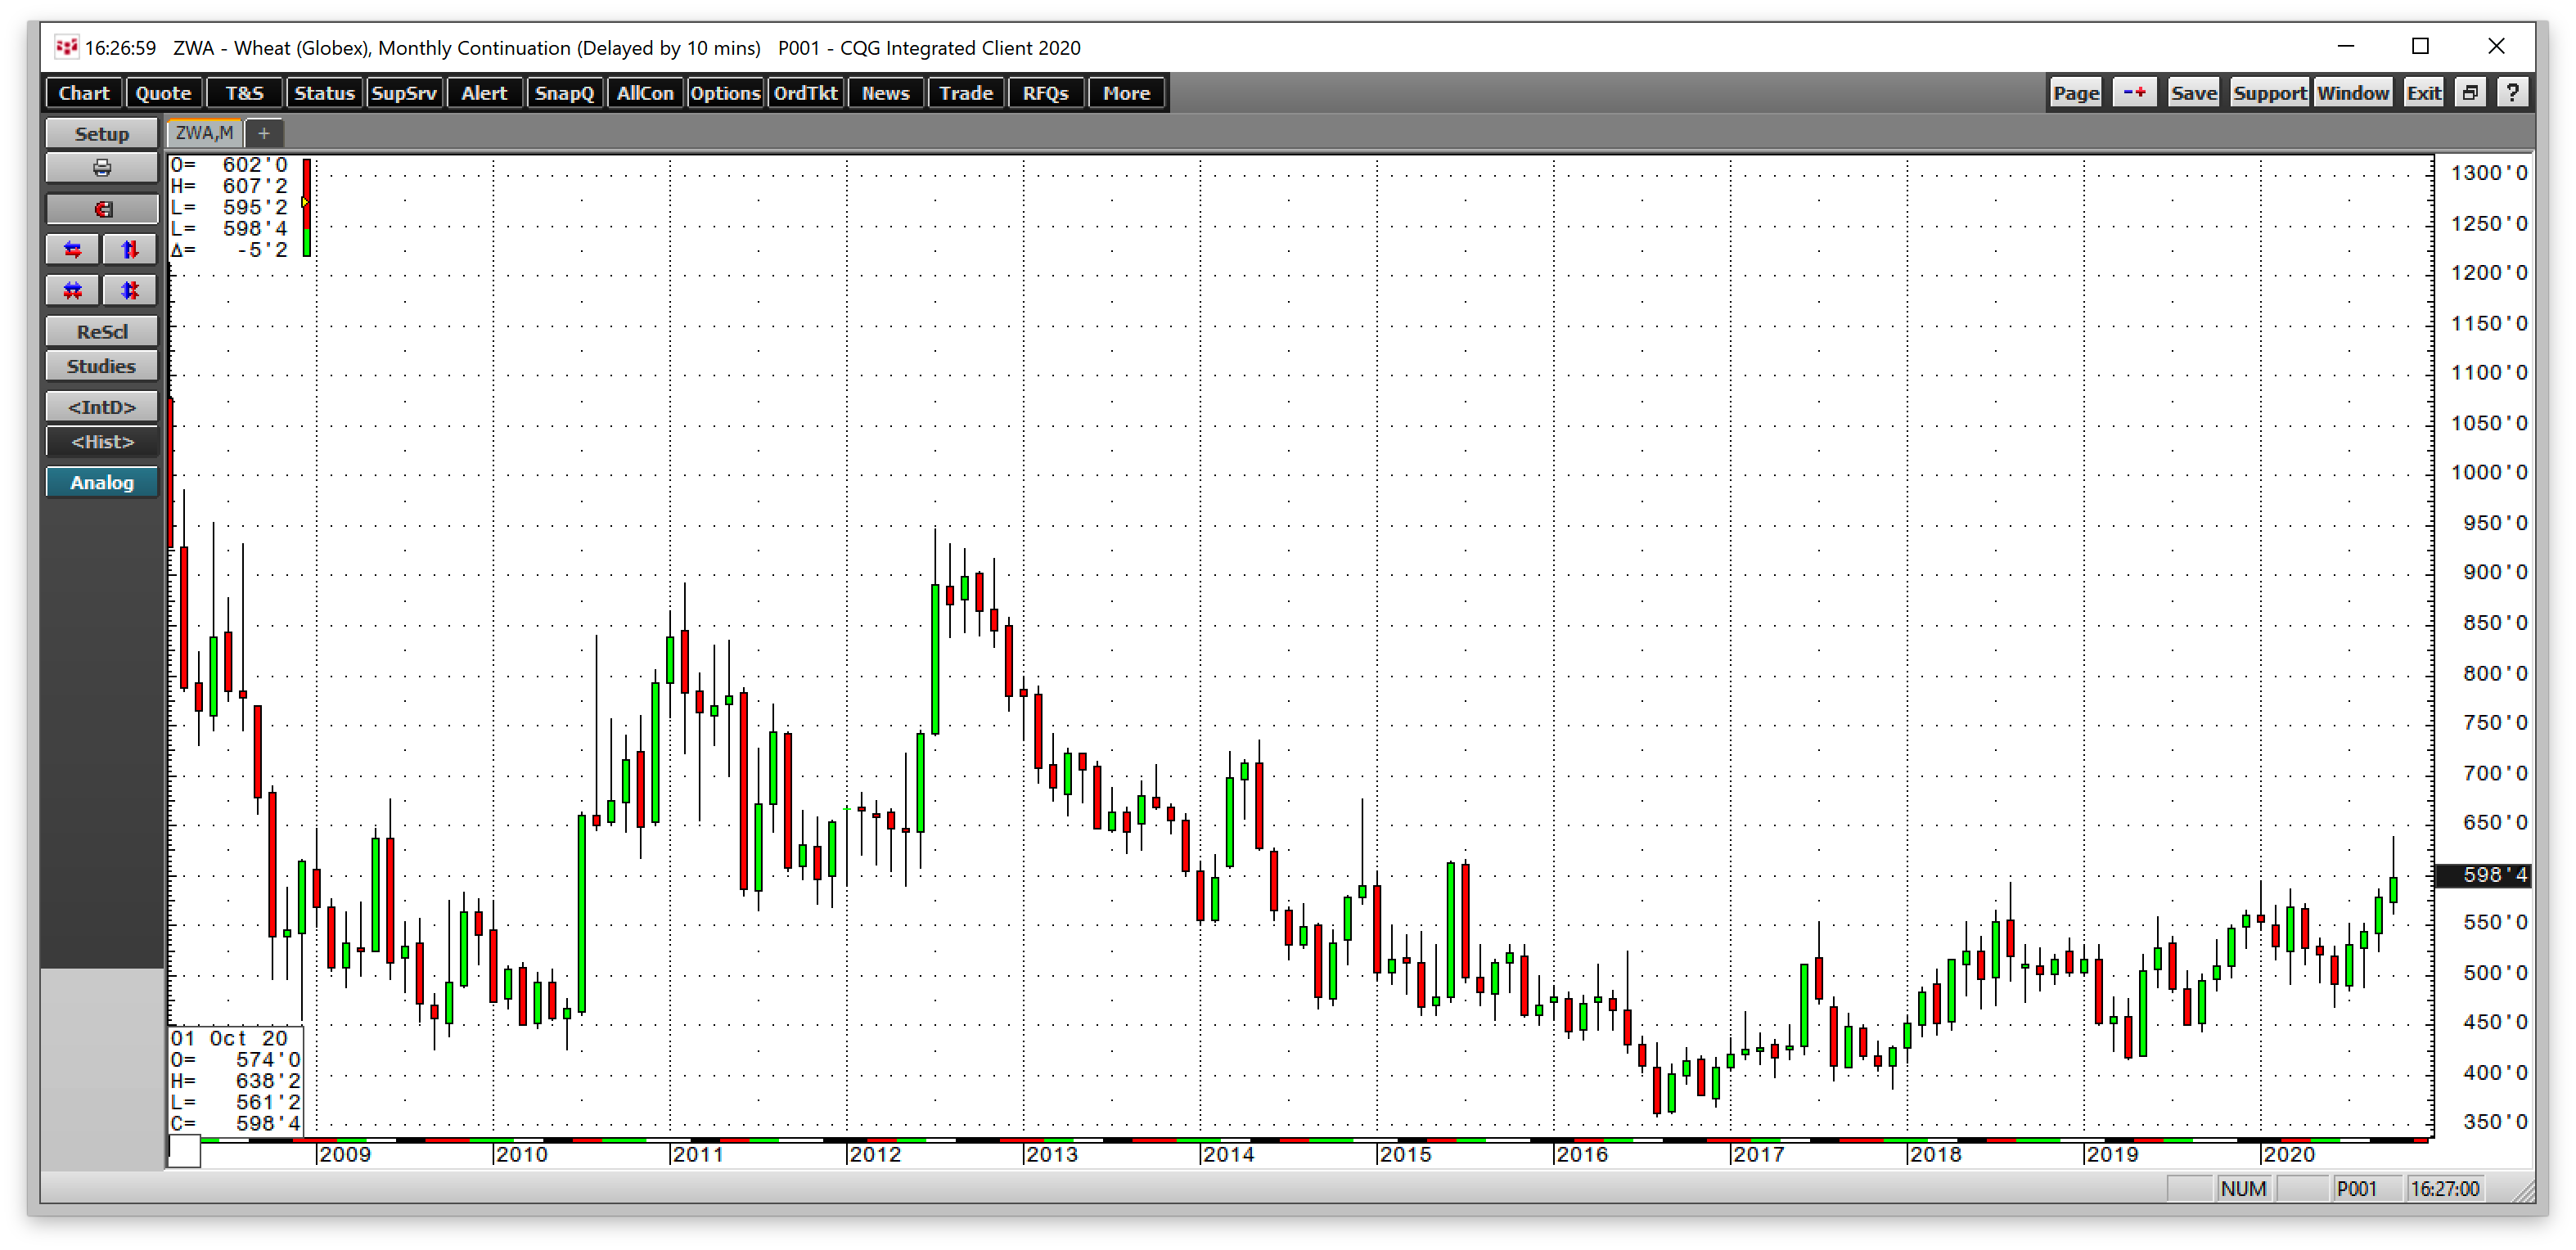
The chart shows that wheat futures had been making higher lows and higher highs since 2016 when the price reached a bottom of $3.5950 per bushel. In 2020, wheat took off on the upside. October was the fourth straight month of gains, and the price reached a peak of $6.3825, the highest level since December 2014. After making a six-year high in October, December futures settled just below the $6 level at $5.9850 on October 30.
Three reasons for the rallies
The rallies in the corn, bean, and wheat futures markets were ignited by the August 10 derecho, which caused crop damage in the US. A falling dollar provided additional support for the grains and oilseeds. However, the most potent factor for the rallies was that China became a massive buyer starting in August.
China is the world’s most populous nation. Feeding 1.4 billion people requires more crops than China can produce. Moreover, the Chinese lost a huge percentage of the hog population to an outbreak of African Swine Fever in 2019. Rebuilding the stock of pork requires substantial imports of soybeans as soybean meal is the primary ingredient in animal feed. Simultaneously, China’s commitments to purchase agricultural products from the US under the “phase one” trade deal signed in January 2020 prompted the wave of imports from the US.
Three reasons that could continue
Grains could be the most exciting sector of the commodities market in 2021 based on the price action during the 2020 harvest. The first reason why higher prices could be on the horizon is that the August 10 derecho was a reminder of the fickle nature of Mother Nature. Grain and oilseed prices have not experienced a significant weather event since 2012. It is only a matter of time before adverse conditions ignite a rally that takes prices appreciably higher because of the second reason: the power of demographics.
Each day, the demand side of the fundamental equation for food rises. Population growth at a rate of twenty million per quarter means that the world required more food in 2020 than in 2019, and it will need more in 2021 than in 2020. The bottom line is that more mouths to feed create an ever-expanding demand side of the fundamental equation for crops. We have not felt the power of the demand over the past eight years because of bumper crops that satisfied requirements. However, any issues that prevent production from keeping pace with the need for more food would likely have an explosive impact on corn, soybean, and wheat prices.
Finally, the US dollar is the world’s reserve currency and the benchmark pricing mechanism for most commodities. Grains and oilseeds are no exception as the US is the world’s leading producer and exporter of corn and soybeans and a leading producer and exporter of wheat. A rising dollar tends to weigh on prices, while weakness in the US currency supports higher prices.
The trend in the dollar index turned lower since March.
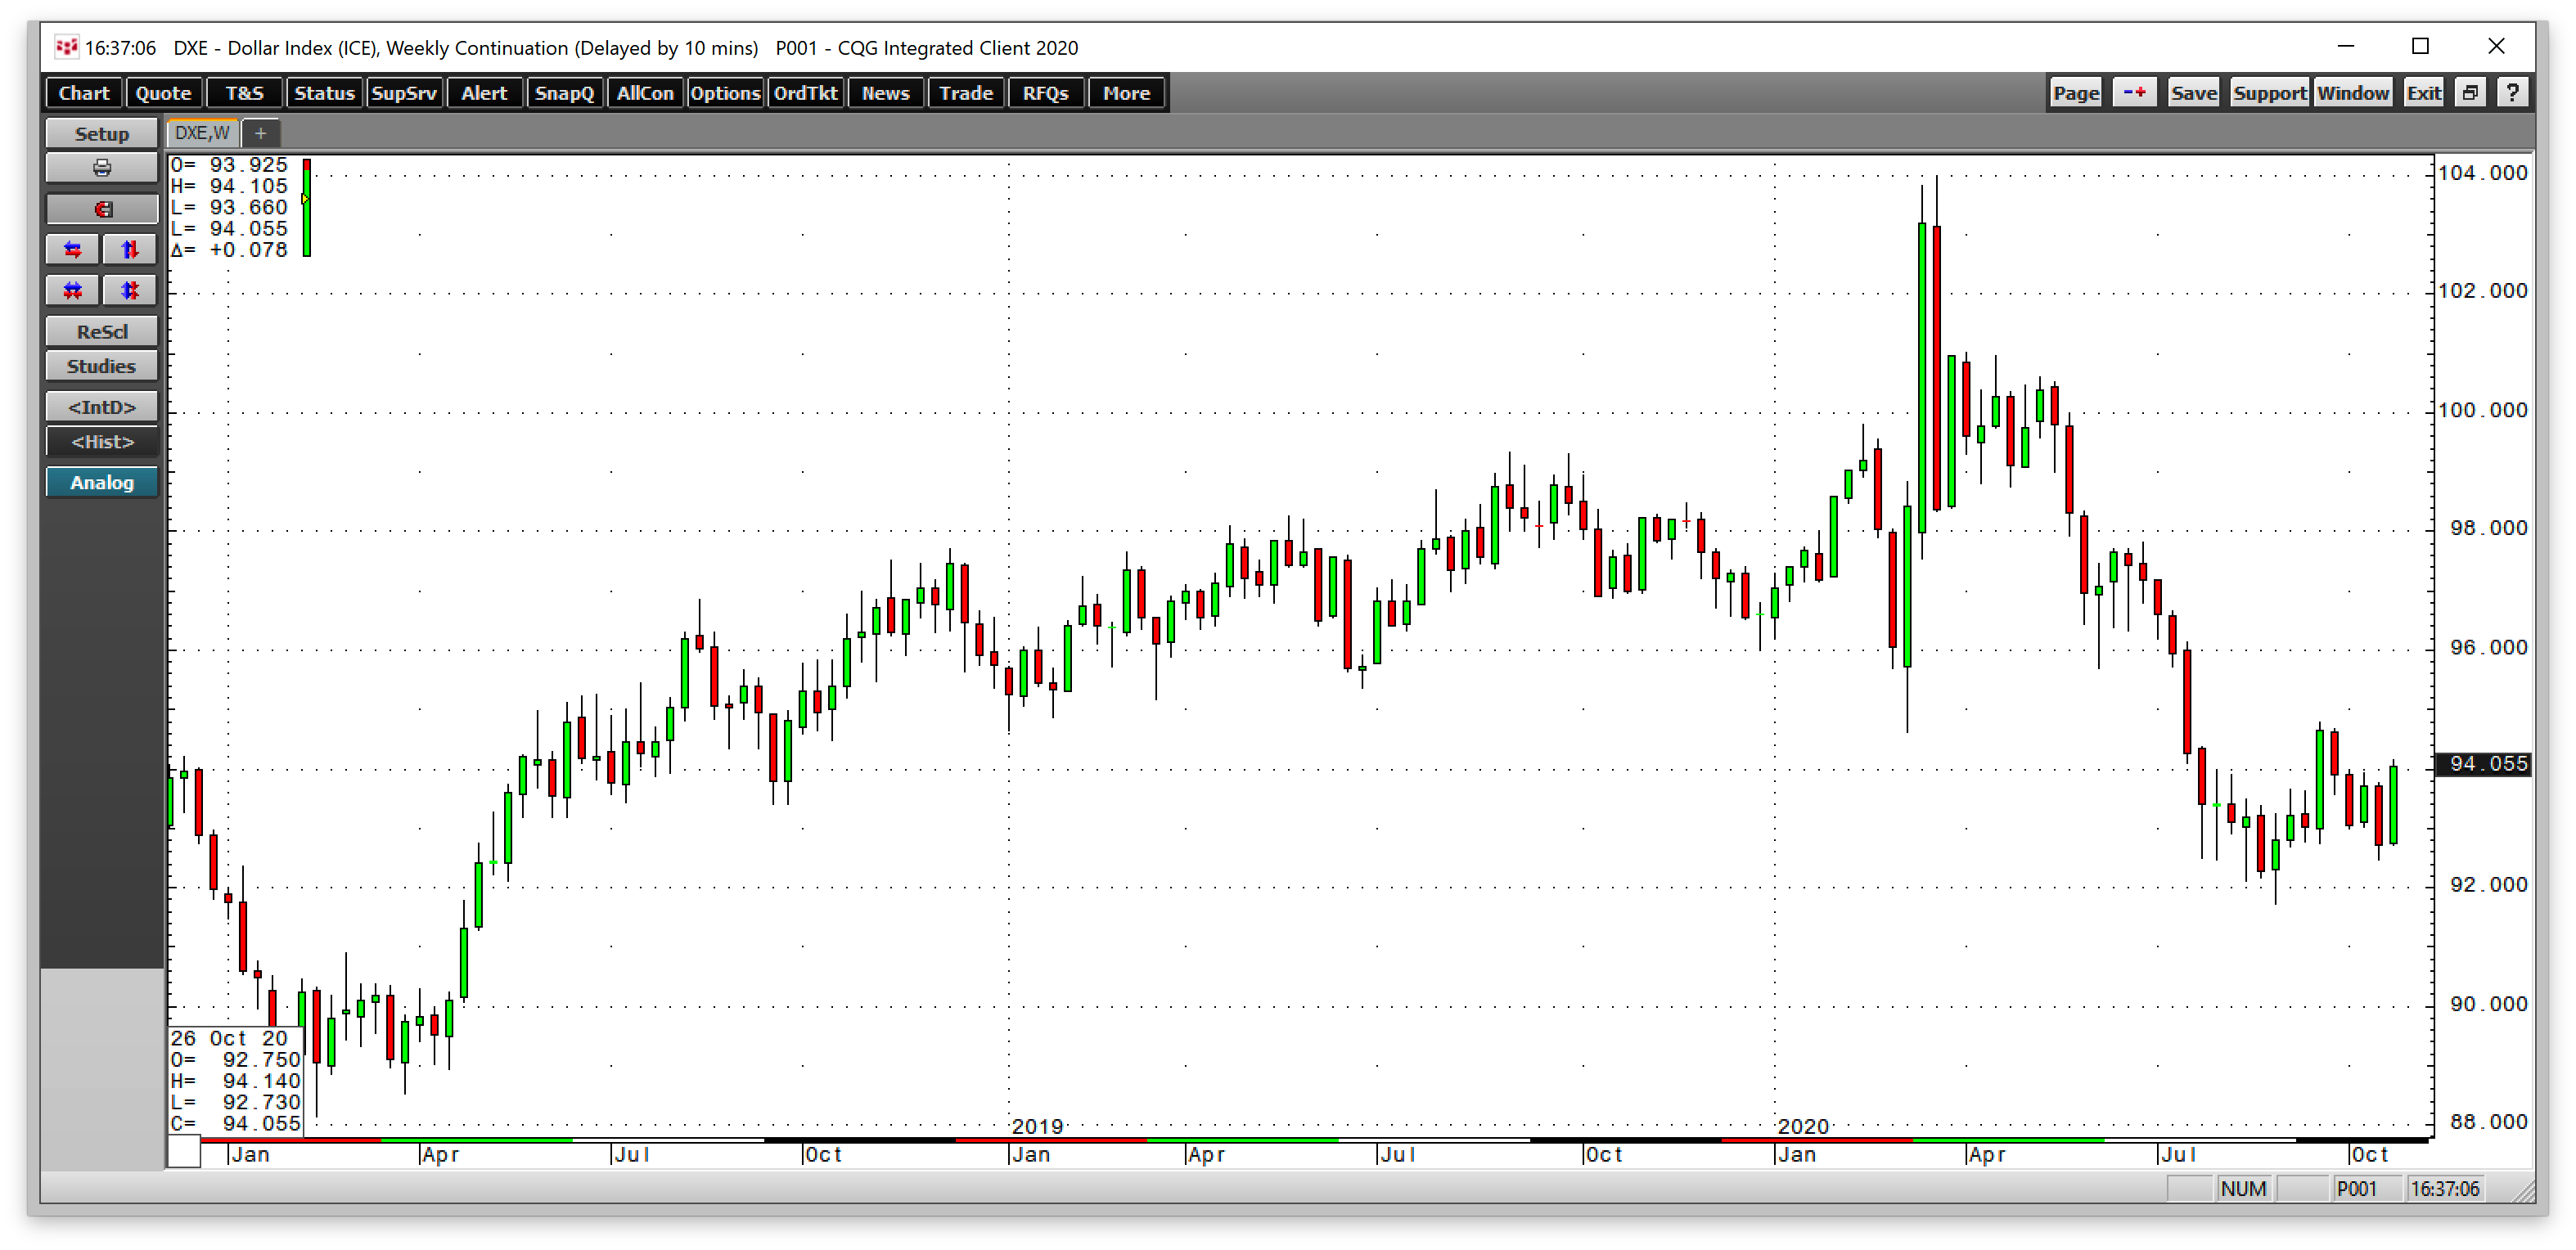
As the weekly chart of the dollar index displays, it fell from 103.96 in March, the highest level since 2002, to a low of 91.725 in early September. At just over the 94 level on October 30, the index was a lot closer to the low than the high. While the index is consolidating, it has not traded above the 95 level since July. The bearish price action in the dollar index remained intact at the end of October.
Along with the dollar’s weakness, central bank liquidity and government stimulus programs increase the money supply with inflationary ramifications. As deficits rise and money supply expands, the purchasing power of money declines, causing the price of all commodities to rise, and agricultural products are no exception. The US central bank has said it is prepared to tolerate and is even encouraging higher inflation over the coming months and years. Inflation is price fertilizer for all commodities.
I am bullish for grain and oilseed prices for 2021. However, there is no rush to buy. I would look to take advantage of any significant corrections over the coming weeks and months to begin accumulating corn, soybean, and wheat exposure. Demographics should limit the downside, the potential for a weather event could exacerbate the upside, and rising inflation could ignite an explosive period for the commodities that feed the world.