
Each Wednesday this article will be updated with the current seasonal study using CQG's Seasonal analysis applied to the Soybean, Wheat and Corn markets. You can download the CQG pac providing the… more
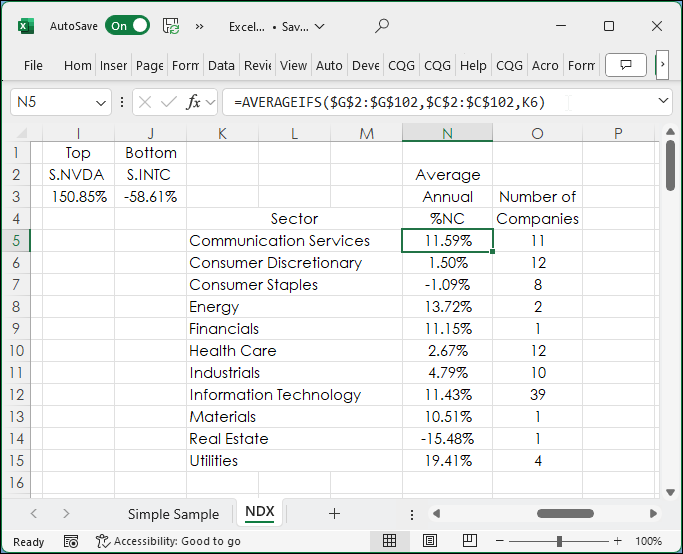
This posts details the use of two Excel functions: AVERAGEIFS and COUNTIFS. To start, a simple example of using the AVERAGEIFS function is presented.
In the image below column cells A2:A10… more
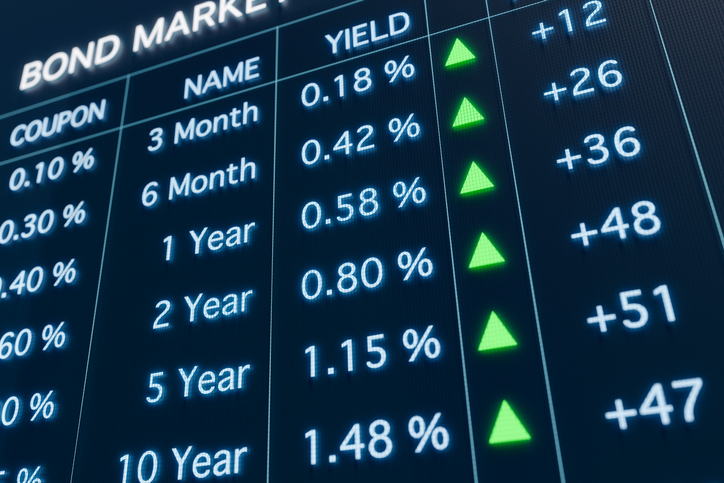
So far this week the Fixed Income futures markets are higher. The TSE 10 Year JGB, Sep 24 contract is up +0.90%. The best performer in the US market is the 30yr US Treasury Bonds (Globex),… more

This midweek snapshot shows a positive performance for the Equity Index futures markets. The best performer in the Japanese market is the TOPIX, Sep 24 contract with a +4.34% gain. The best… more

Each Wednesday this article will be updated with the current seasonal study using CQG's Seasonal analysis applied to the Soybean, Wheat and Corn markets. You can download the CQG pac providing the… more
Exchange Traded Spreads Descriptions now provide number of contracts and actuals contracts.
Here is an example using the Quote Spreadsheet V2:
Here is an example using the All… more
Various improvements and bug fixes.
ChartingAdded option to hide drawing toolsTrading/ReportingIntegration of user/order comments into Account notes Mobile + AndroidAdded Greeks to mobile… more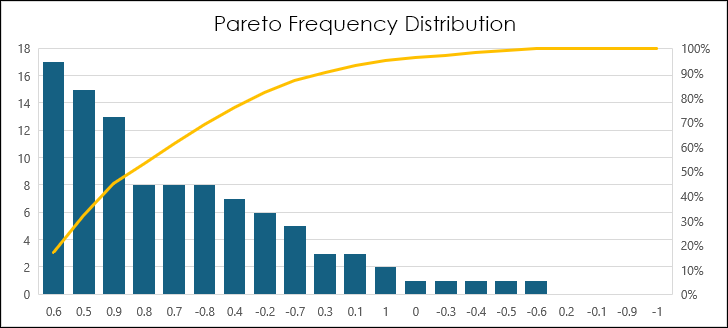
A Pareto chart is a histogram chart displaying columns sorted in a descending order and a line representing the cumulative total percentage. Pareto charts highlight the largest factors in a data… more
This midweek snapshot shows a mostly negative performance for the Equity Index futures markets. The best performer in the Japanese market is the TSE REIT Index, Sep 24 contract with a +0.78… more
So far this week the Fixed Income futures markets are mostly lower. However, the TSE 10 Year JGB, Sep 24 contract is up +0.73%. The best performer in the US market is the 2yr US Treasury… more