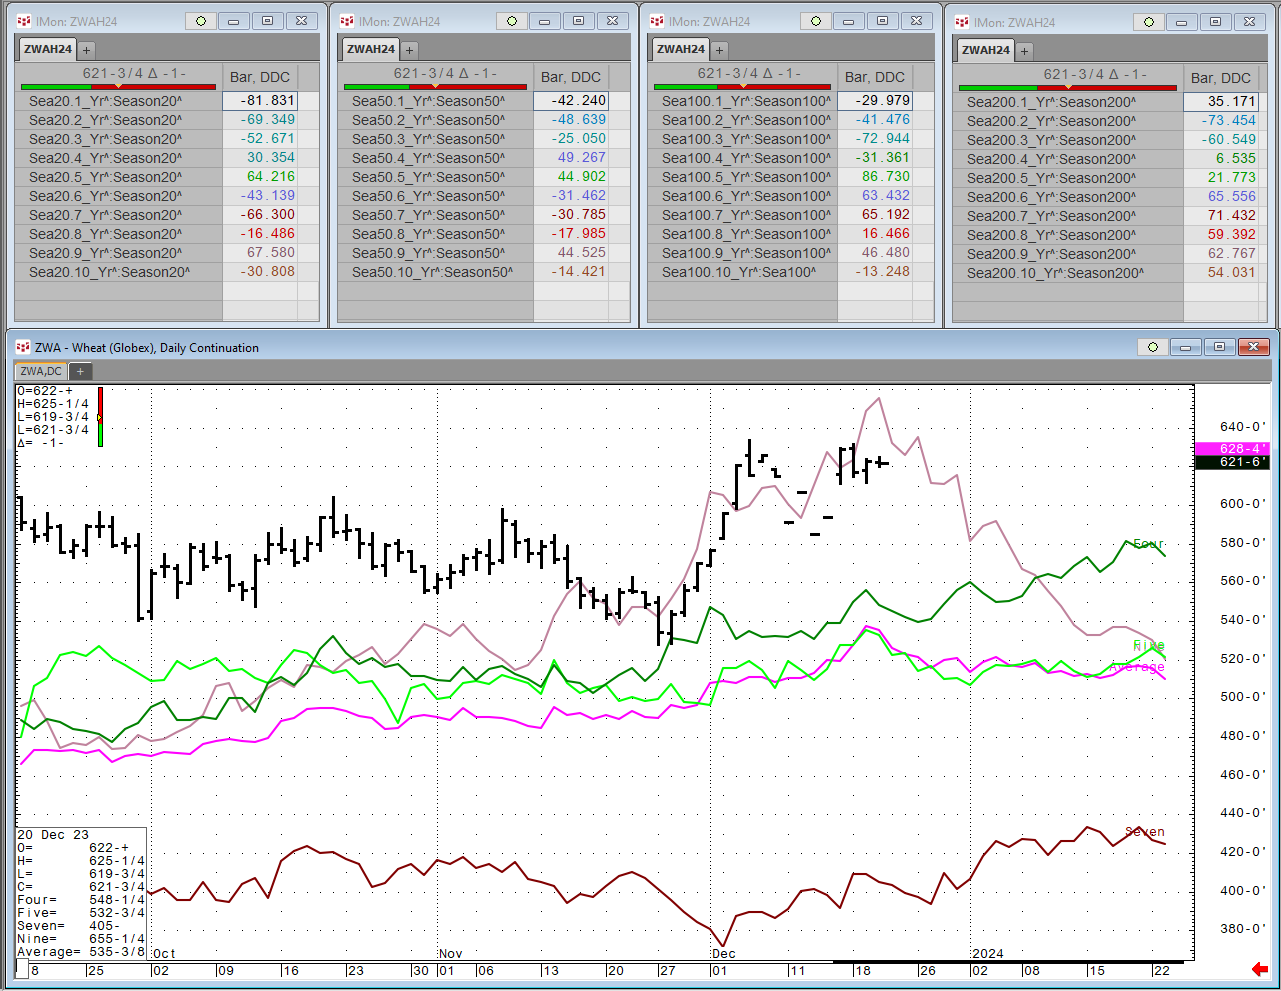
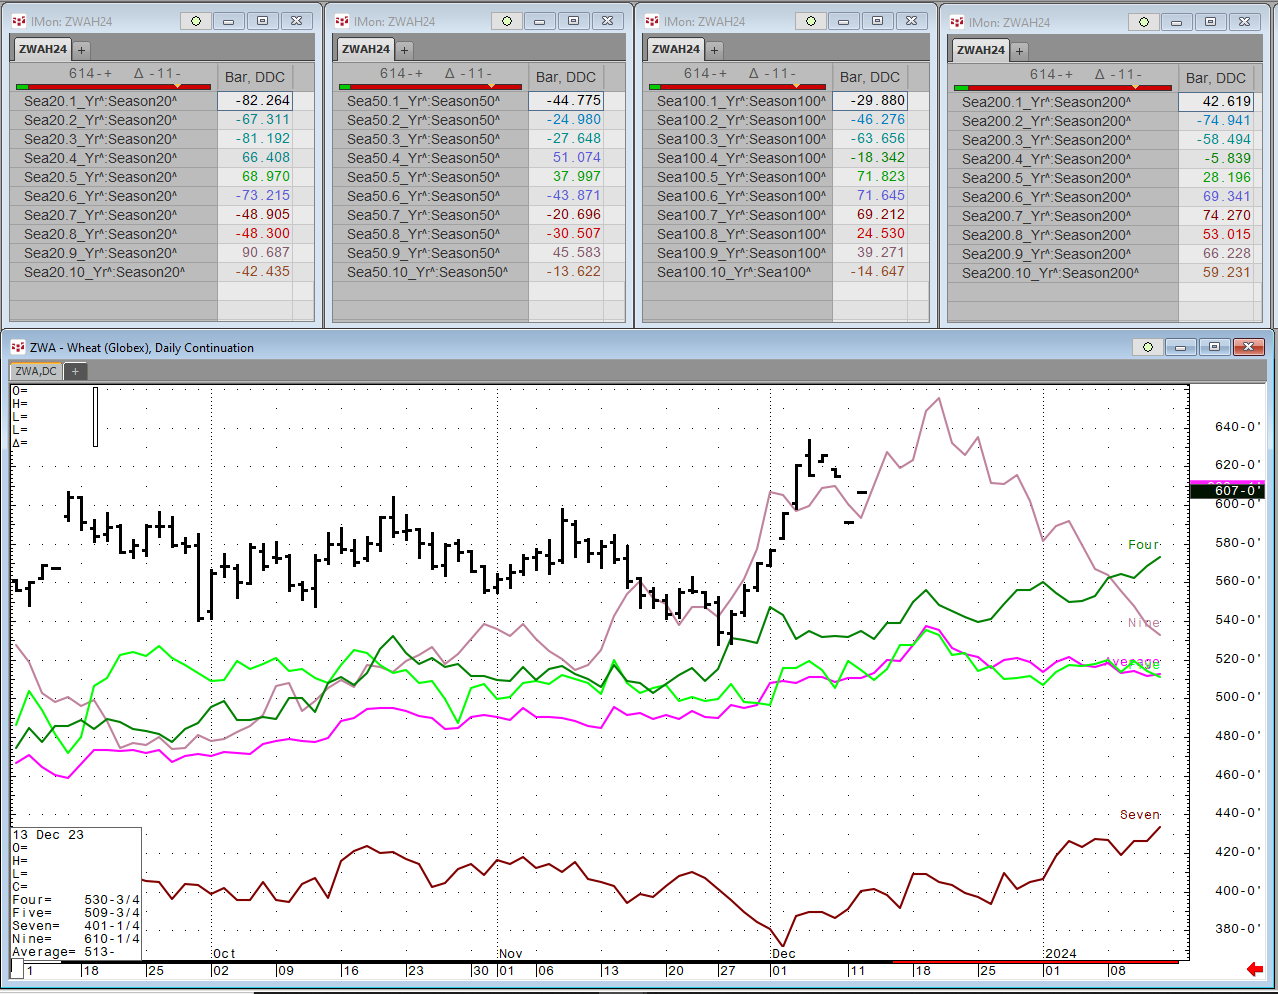
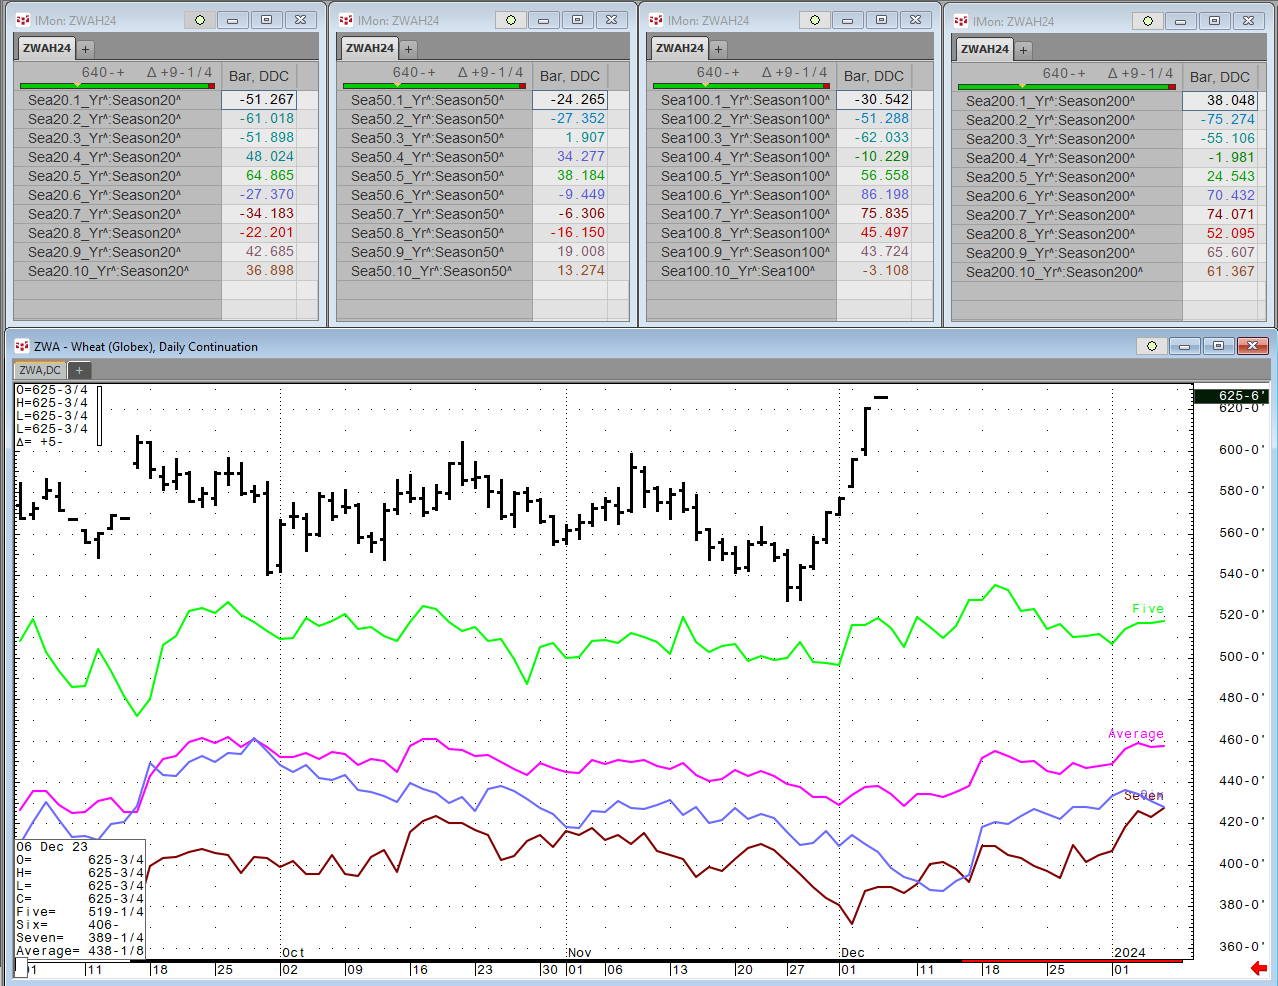
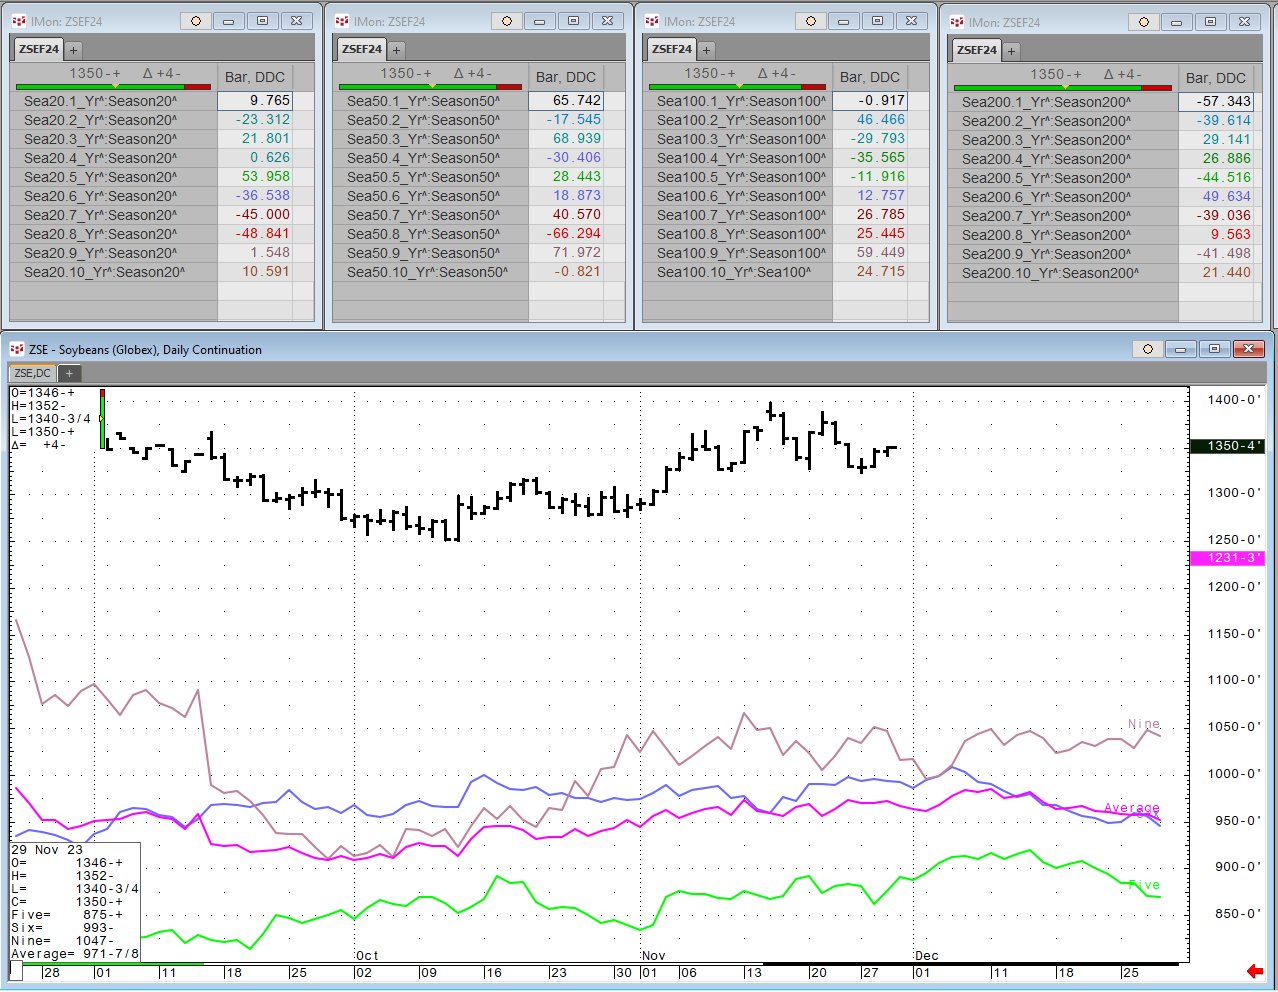
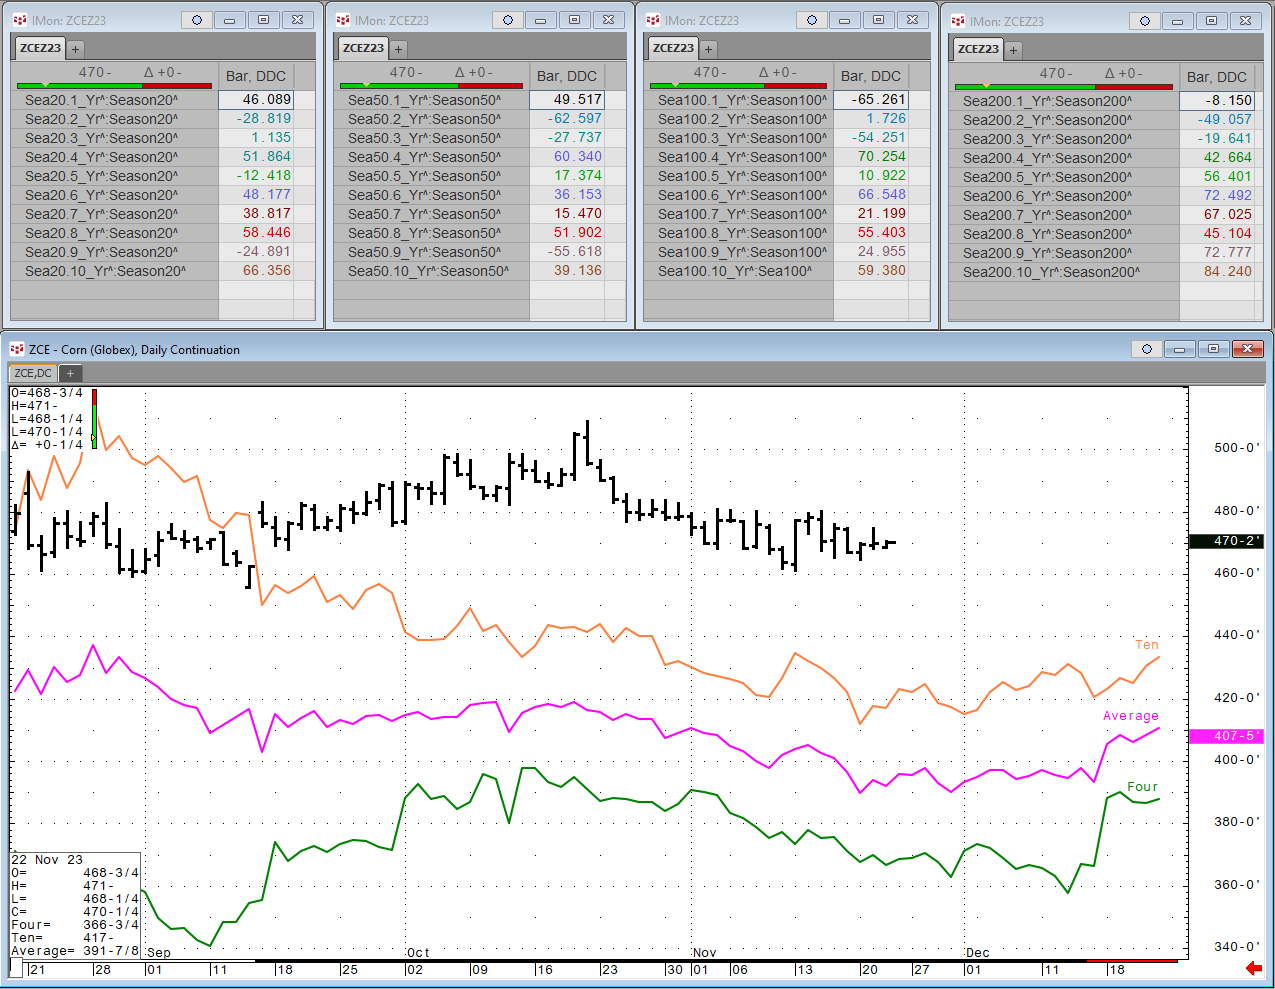
Each Wednesday this article will be updated with the current seasonal study using CQG's Seasonal analysis applied to the Soybean, Wheat and Corn markets. You can download the CQG pac providing the… more
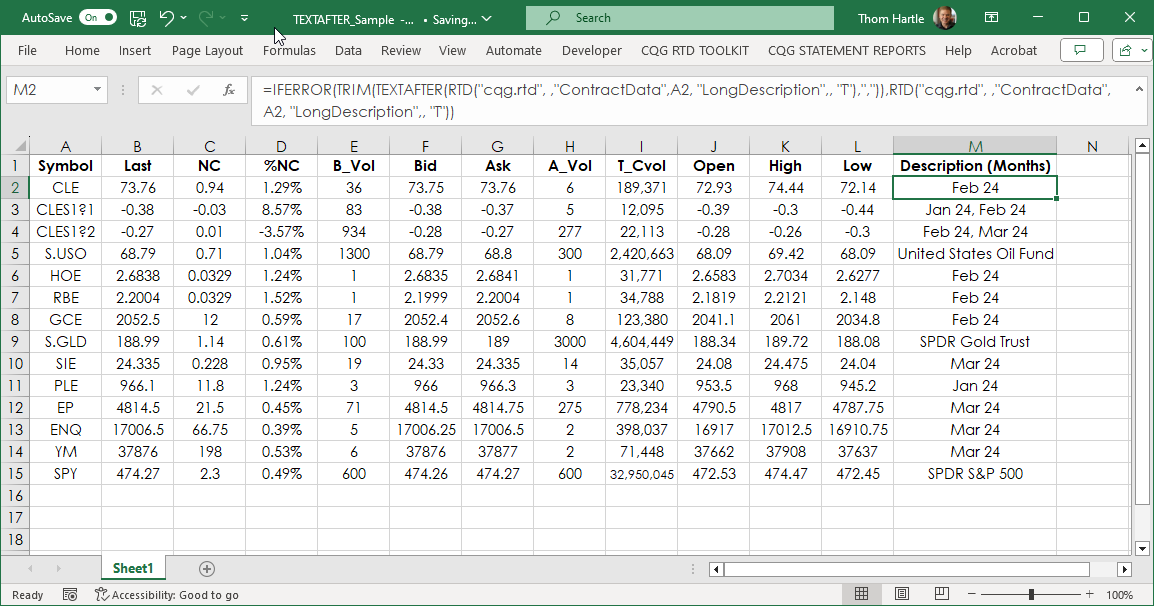
Microsoft® Excel 365 includes a Text function that makes pulling text out of a string much easier than before Excel 365 was released. To illustrate, we will review the steps before Excel 365 was… more
Each Wednesday this article will be updated with the current seasonal study using CQG's Seasonal analysis applied to the Soybean, Wheat and Corn markets. You can download the CQG pac providing the… more
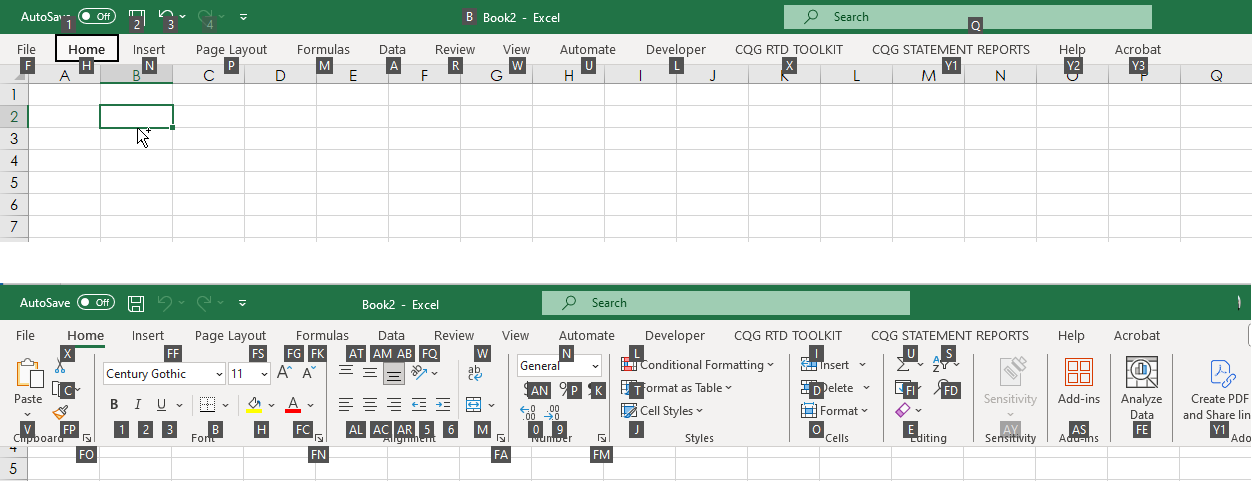
If you use Microsoft® Excel as part of your workflow with CQG IC or QTrader then you may or may not be using Excel keyboard shortcuts. This post details using keyboard shortcuts in Excel 365 to… more
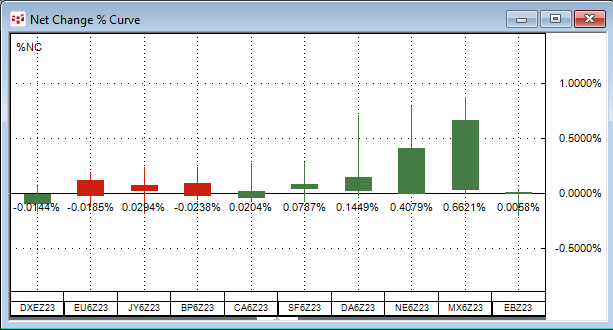
The Net Change Curve chart displays a collection of symbols’ daily net price change or daily net percentage change making it easy to compare on a relative basis each market’s current session’s… more
Each Wednesday this article will be updated with the current seasonal study using CQG's Seasonal analysis applied to the Soybean, Wheat and Corn markets. You can download the CQG pac providing the… more
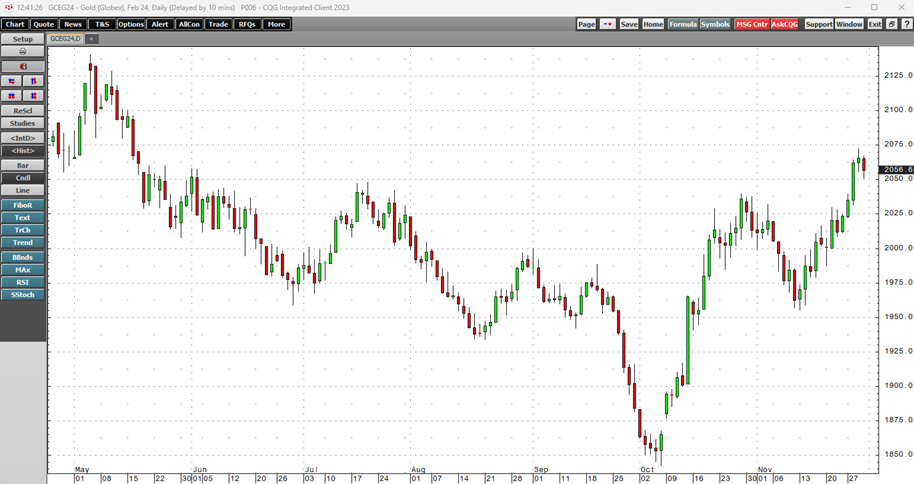
Gold is a hybrid, part commodity, and part financial asset. The precious yellow metal has industrial applications but has been a means of exchange for thousands of years.
London is the hub… more
In this post, the aspects of becoming a good rule-based trader are discussed. But first, an illustrative story...
While attending college I worked in warehouses on Seattle's… more
Each Wednesday this article will be updated with the current seasonal study using CQG's Seasonal analysis applied to the Soybean, Wheat and Corn markets. You can download the CQG pac providing the… more
Each Wednesday this article will be updated with the current seasonal study using CQG's Seasonal analysis applied to the Soybean, Wheat and Corn markets. You can download the CQG pac providing the… more
