The raw material markets asset class moved higher in the first quarter of 2022 after posting gains throughout 2021. The commodity asset class consisting of 29 of the primary commodities that trade on US and UK exchanges moved 16.01% higher in Q1 than the level at the end of December 2021. Last year, the asset class posted a 26.79% gain. In 2020, the asset class moved 9.89% higher. In 2019 it gained 10.98%, but in 2018 the asset class lost 6.82% of its value.
The overall winners of the 29 for the first quarter were the LME nickel market, which posted a gain of 54.68% in Q1, and the natural gas futures market, which moved 51.26% higher over the three months.
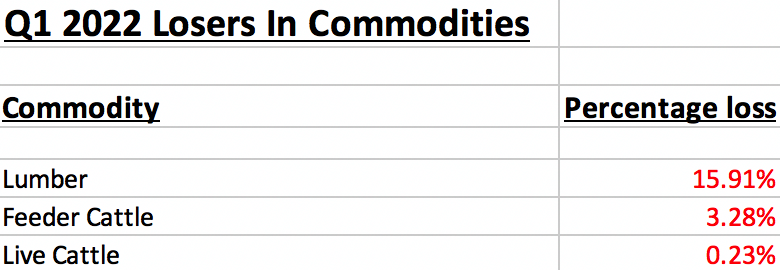
Heating oil futures came in third place with a 44.54% quarterly gain. Gasoline was the fourth-leading market in the composite, posting a 41.64% price increase since December 31, 2021. The first major war in Europe since WW II lifted energy prices. The biggest loser in the composite for the quarter was the lumber market, which fell 15.91%. Live and feeder cattle prices declined, but all of the other commodities posted gains in Q1. Crude oil posted its eighth consecutive quarterly gain as the price closed at the $100 per barrel level on the nearby NYMEX futures.
Coal for delivery in Rotterdam, the Netherlands, exploded 132.54% higher and reached a new record high in March. The Baltic Dry Index moved 6.86% higher as the war increased insurance premiums, supporting higher freight rates.
There were lots of double-digit percentage gains in Q1. Five markets were over 50% higher, and seven gained 30%-45% percent. Seven markets moved from 20%-30% higher, and five markets posted over 10% gains during the quarter. Only one commodity, lumber, posted a double-digit percentage loss. Winners edged out losers in the first quarter of 2022 by an incredible margin of 38 to three.
The US dollar is typically a significant factor for commodity prices, as it tends to have an inverse value relationship with raw material prices. The dollar index rose 2.89% in Q1, after rising 6.34% in 2021. The dollar index was 0.34% higher in 2019 after moving 4.26% higher in 2018, which followed a 10.23% decline in 2017. The dollar rallied in Q3 2021 through Q1 2022 on the prospects of higher US interest rates. US 30-Year Treasury bond futures fell 6.05% in Q1 after moving 7.53% lower in 2021.
All six sectors post gains in Q1 2022
The energy sector led on the upside in Q1, gaining 34.88%. In 2021, energy commodities gained 54.13%. Base metals posted a 19.86% gain in Q1 after a 38.09% rise in 2021.
In the first quarter, grains moved 18.89% higher after moving 29.71% higher in 2021. Precious metals were 8.73% higher in Q1 after falling 11.91% in 2021.
Animal proteins gained 7.12% in Q1 after gaining 19.16% in 2021. Soft commodities were the worst-performing sector, but they still moved 6.58% to the upside from December 31, 2021, through March 31, 2022. In 2021, the softs gained 31.57%.
The rising dollar and prospects for higher interest rates did not weigh on the raw material markets in Q1. Rising inflation, supply chain issues, and the war in Ukraine created a potent bullish cocktail for commodity prices, which was the place to be in Q1 2022 as the asset class outperformed stocks, bonds, and cryptocurrencies.
All six sectors of the commodities asset class rallied in Q1.
Winners in Q1 2022
Thirty-eight commodity markets moved higher in Q1 2022:
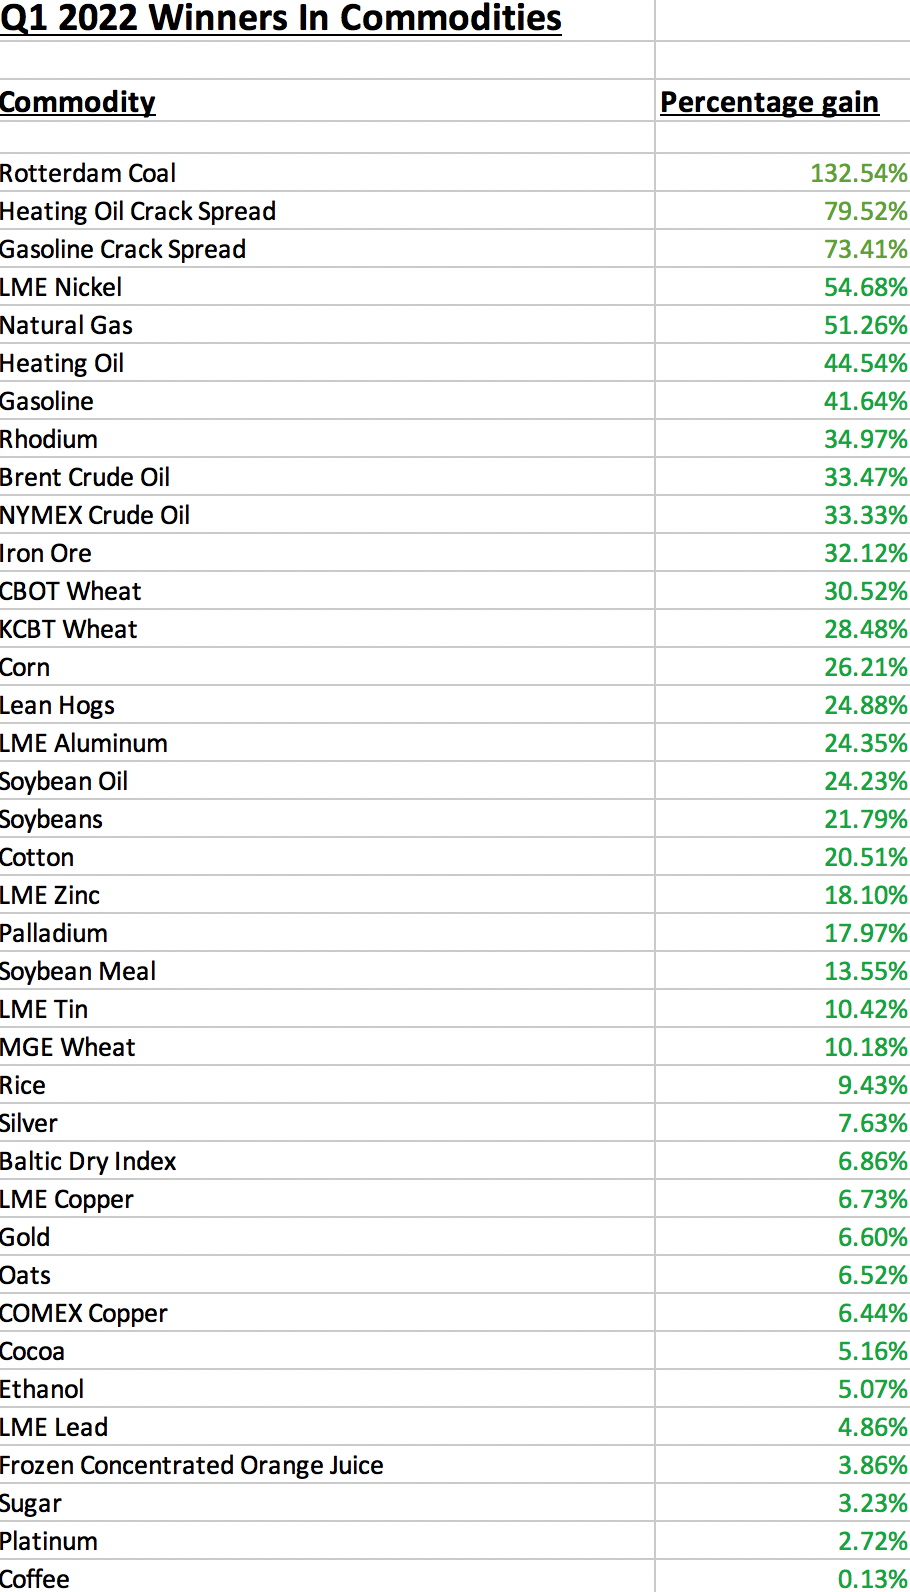
More than half the markets posted double-digit percentage gains.
Losers in Q1 2022
Only three commodity markets moved lower in Q1 2022:
Meanwhile, the stock market fell over the first three months of 2022. In Q1, the DJIA was 4.57% lower, the S&P 500 moved 4.95% to the downside, while the NASDAQ dropped 9.10%. The US 30-Year Treasury bond futures fell 6.05% in Q1. Inflation weighed on stock and bond prices during the first quarter.
Meanwhile, Bitcoin, Ethereum, and digital currencies declined in Q1. Bitcoin edged only 0.73% lower, while Ethereum fell 9.94%. The cryptocurrency asset class’s market cap fell 3.76% for the quarter, as Bitcoin outperformed while Ethereum underperformed the asset class.
Highlight on energy and grains
The central bank liquidity and government stimulus was the arsonist that lit the inflationary fuse, pushing commodity prices higher after reaching lows in 2020. Energy and grain prices had been rallying since April 2020, and the upward pressure on prices continued through Q1 2022.
Moreover, the shift in US energy policy to address climate change by supporting alternative and renewable energy and inhibiting traditional fossil fuels handed US energy independence back to the international oil cartel and Russia since early 2021.
The February 2022 CPI data showed that inflation was at the 7.9% level. After calling inflation “transitory” throughout most of 2021, the US central bank and government realized that more than supply chain bottlenecks were responsible for the economic condition.
On February 24, 2022, Russia’s invasion of Ukraine poured fuel on the inflationary fire. Russia is a leading oil and gas producer, and Russia and Ukraine are leading wheat and corn exporters.
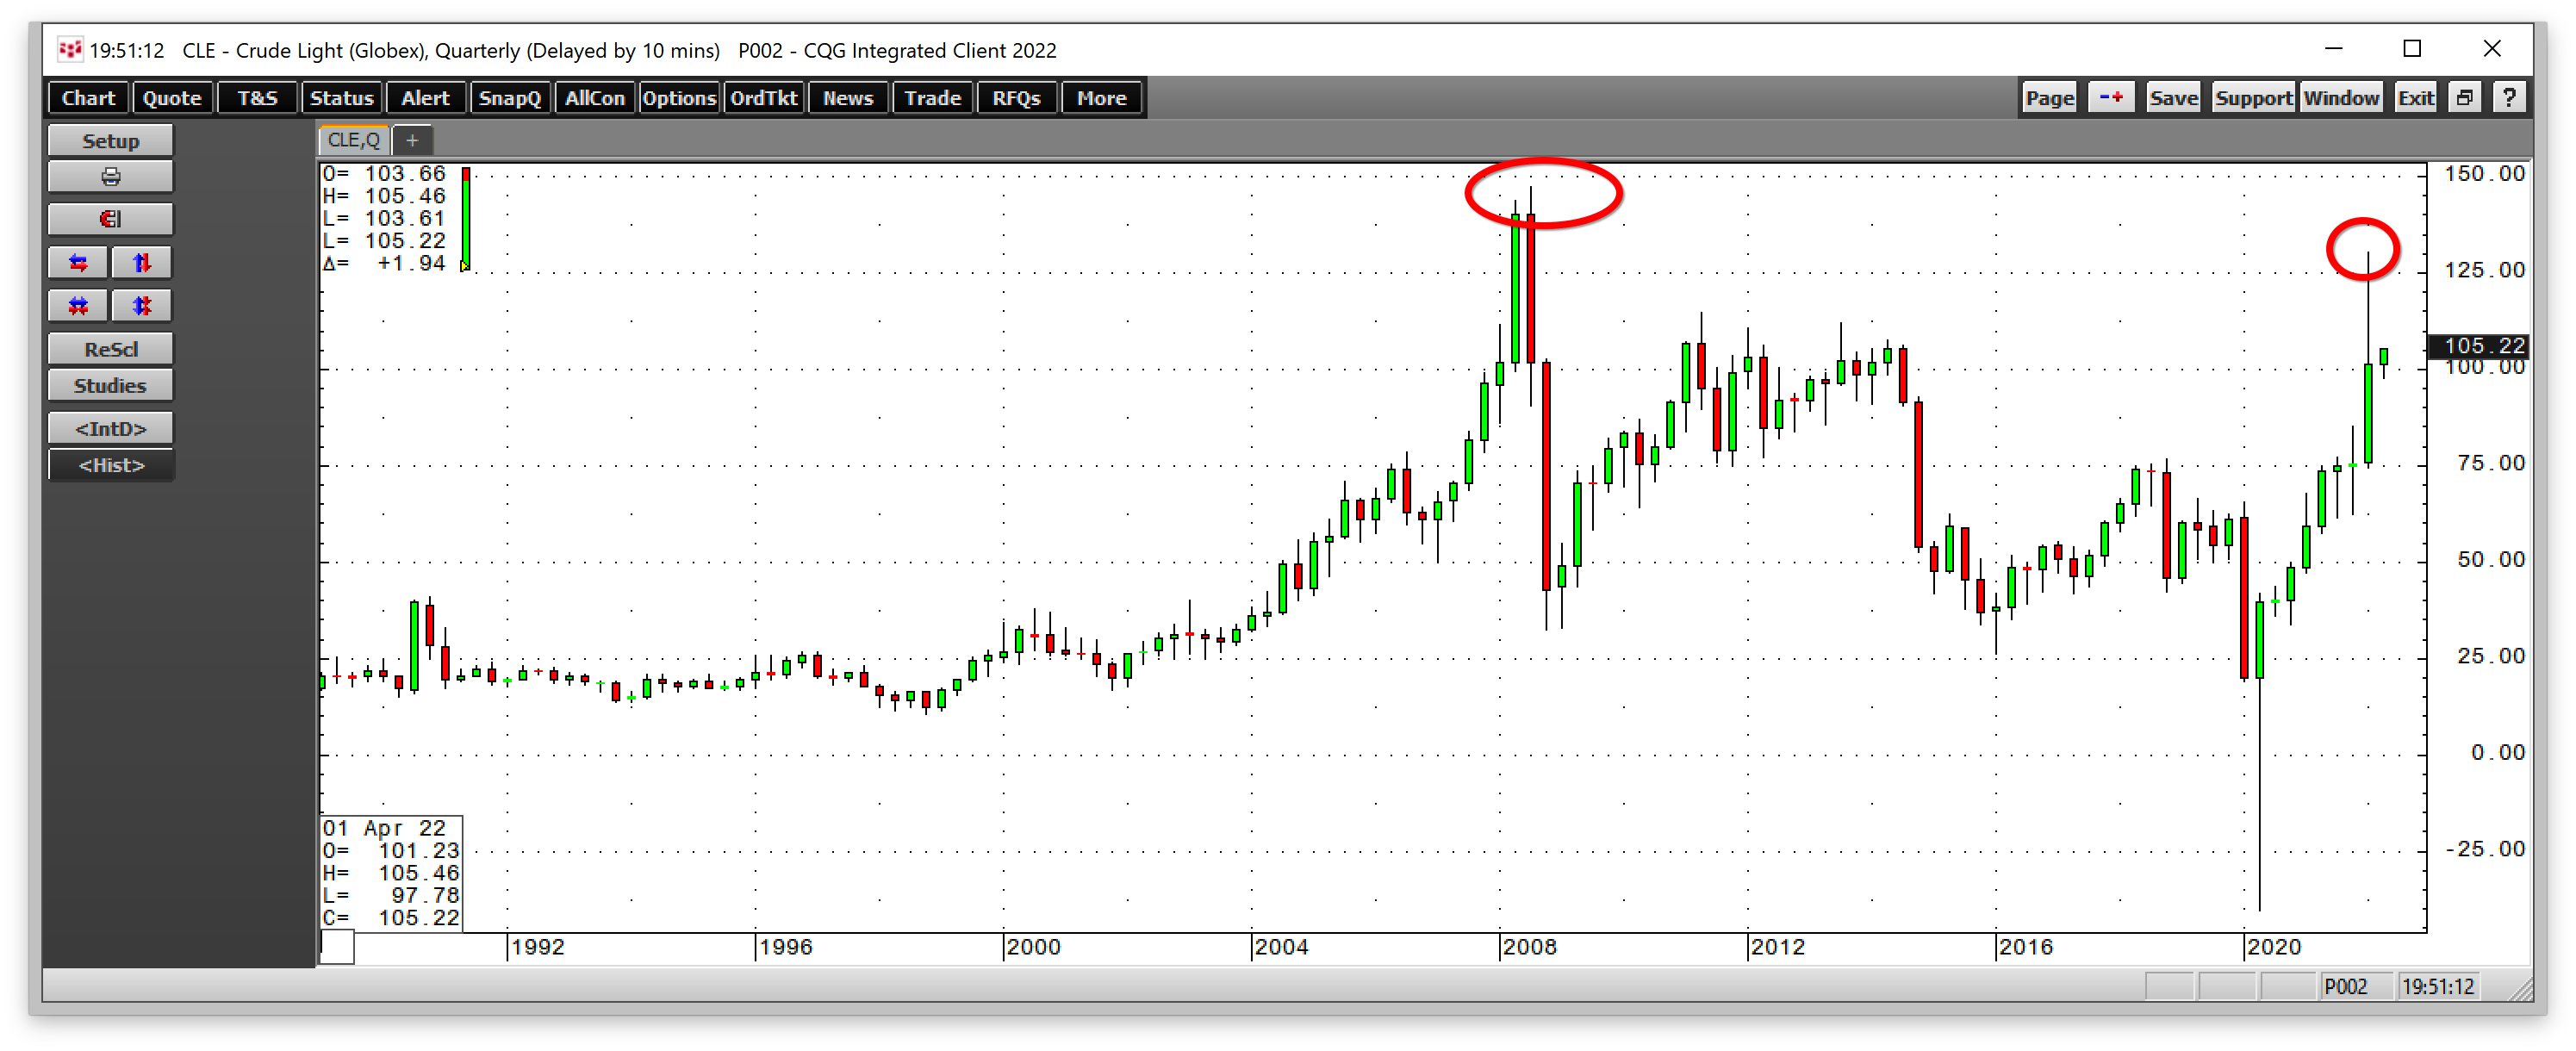
NYMEX crude oil futures rose to $130.50 in Q1 2022, the highest price since 2008. Nearby Brent futures rose to $139.13 per barrel, with gasoline and heating oil prices rising to all-time highs in March 2022.
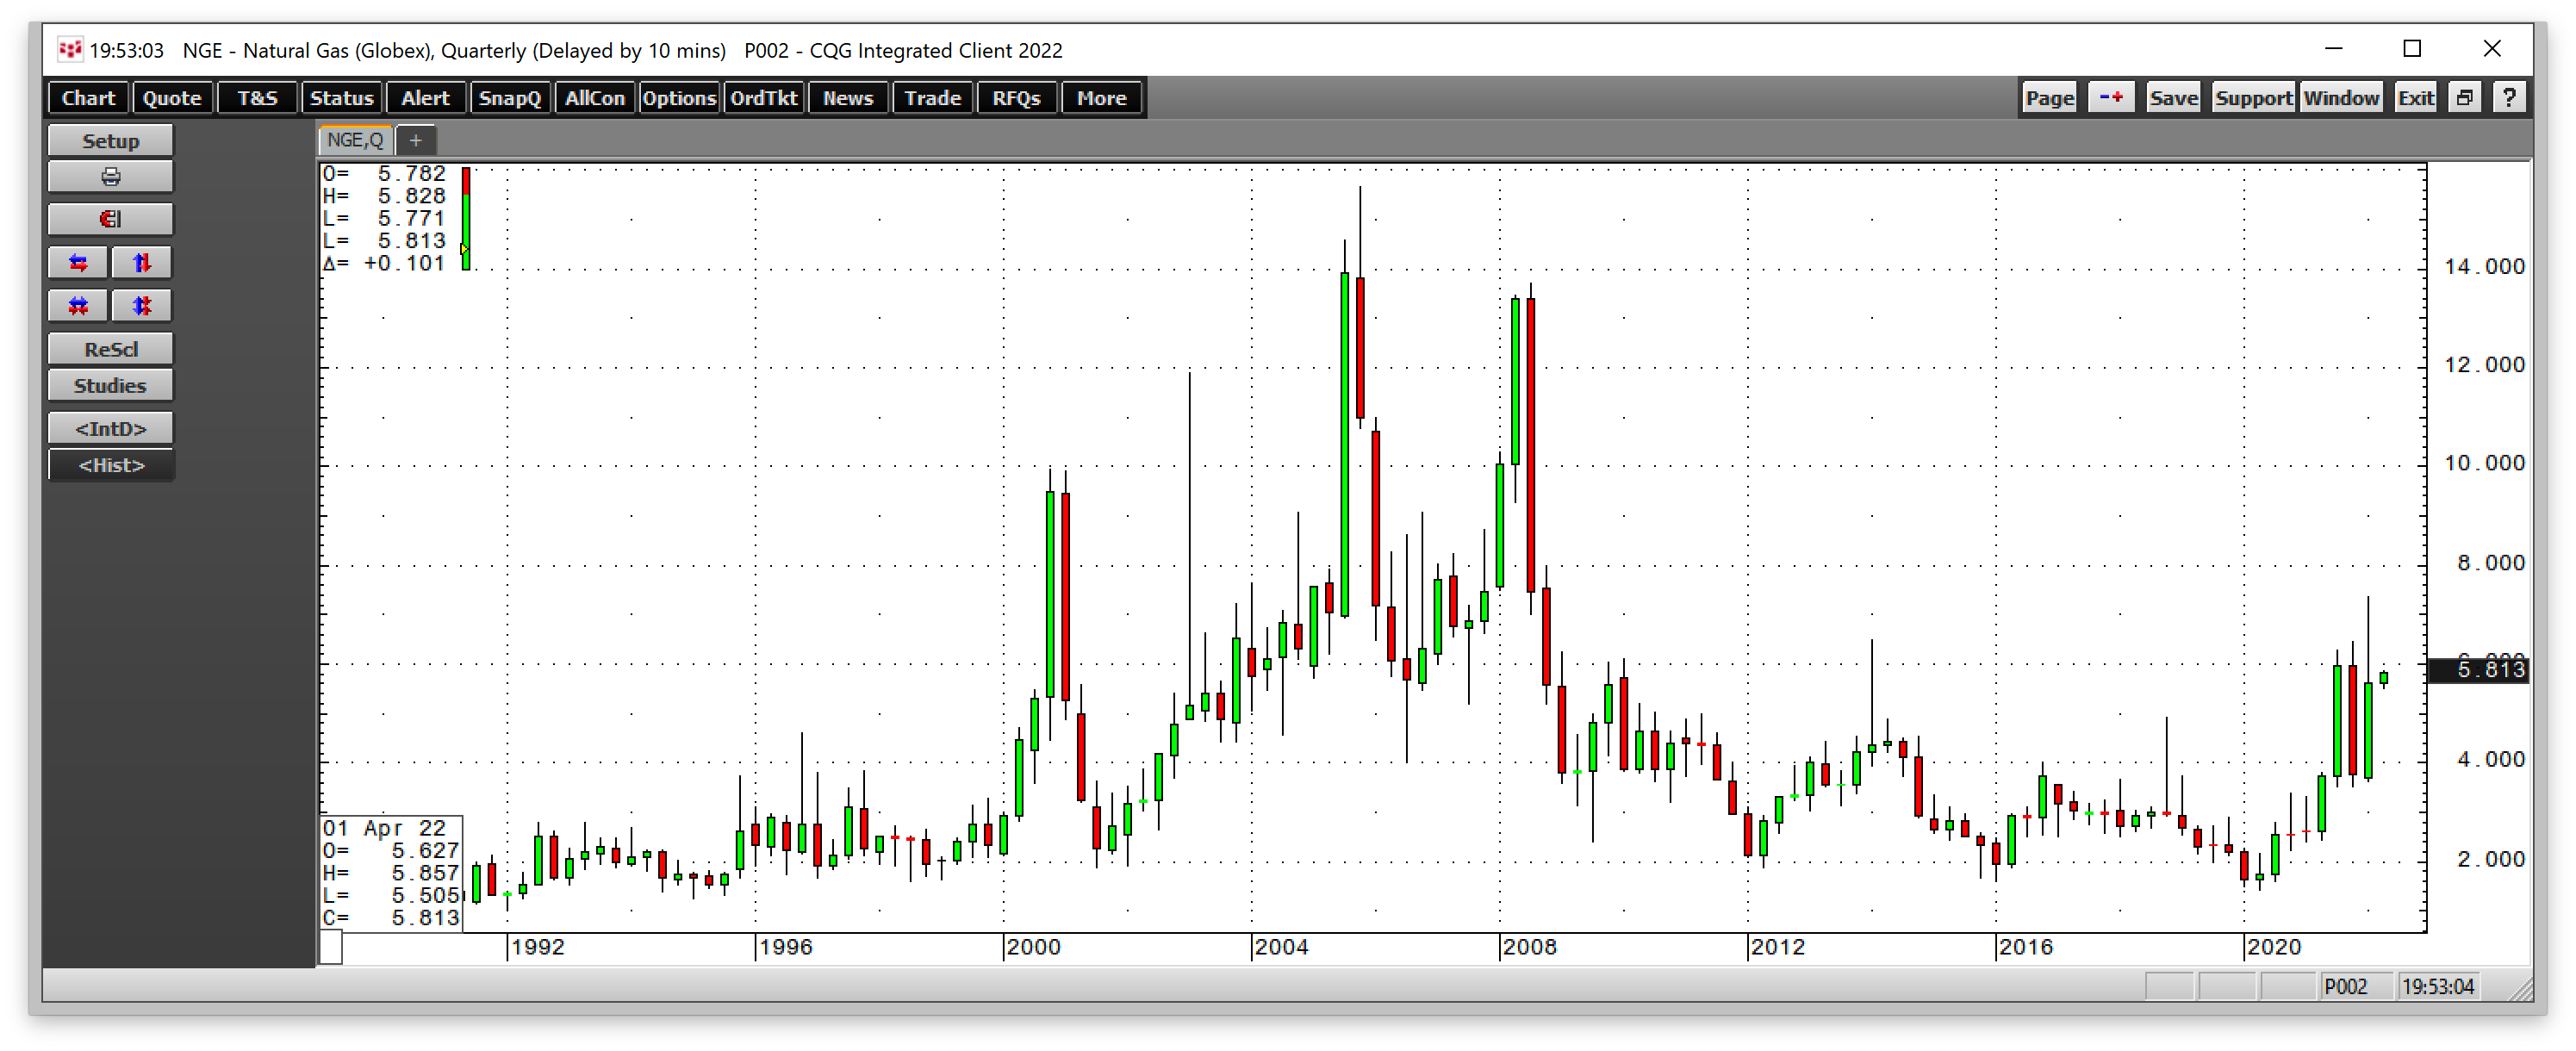
Natural gas rose to over $7 per MMBtu in Q1, the highest level since 2008. In March, the price at over $5 per MMBtu was the highest in March, the beginning of the offseason for demand, since 2008. Natural gas prices in Europe and Asia soared to all-time highs in Q1. LNG caused US natural gas prices to rise as the addressable market for the energy commodity has spread beyond the US pipeline network.
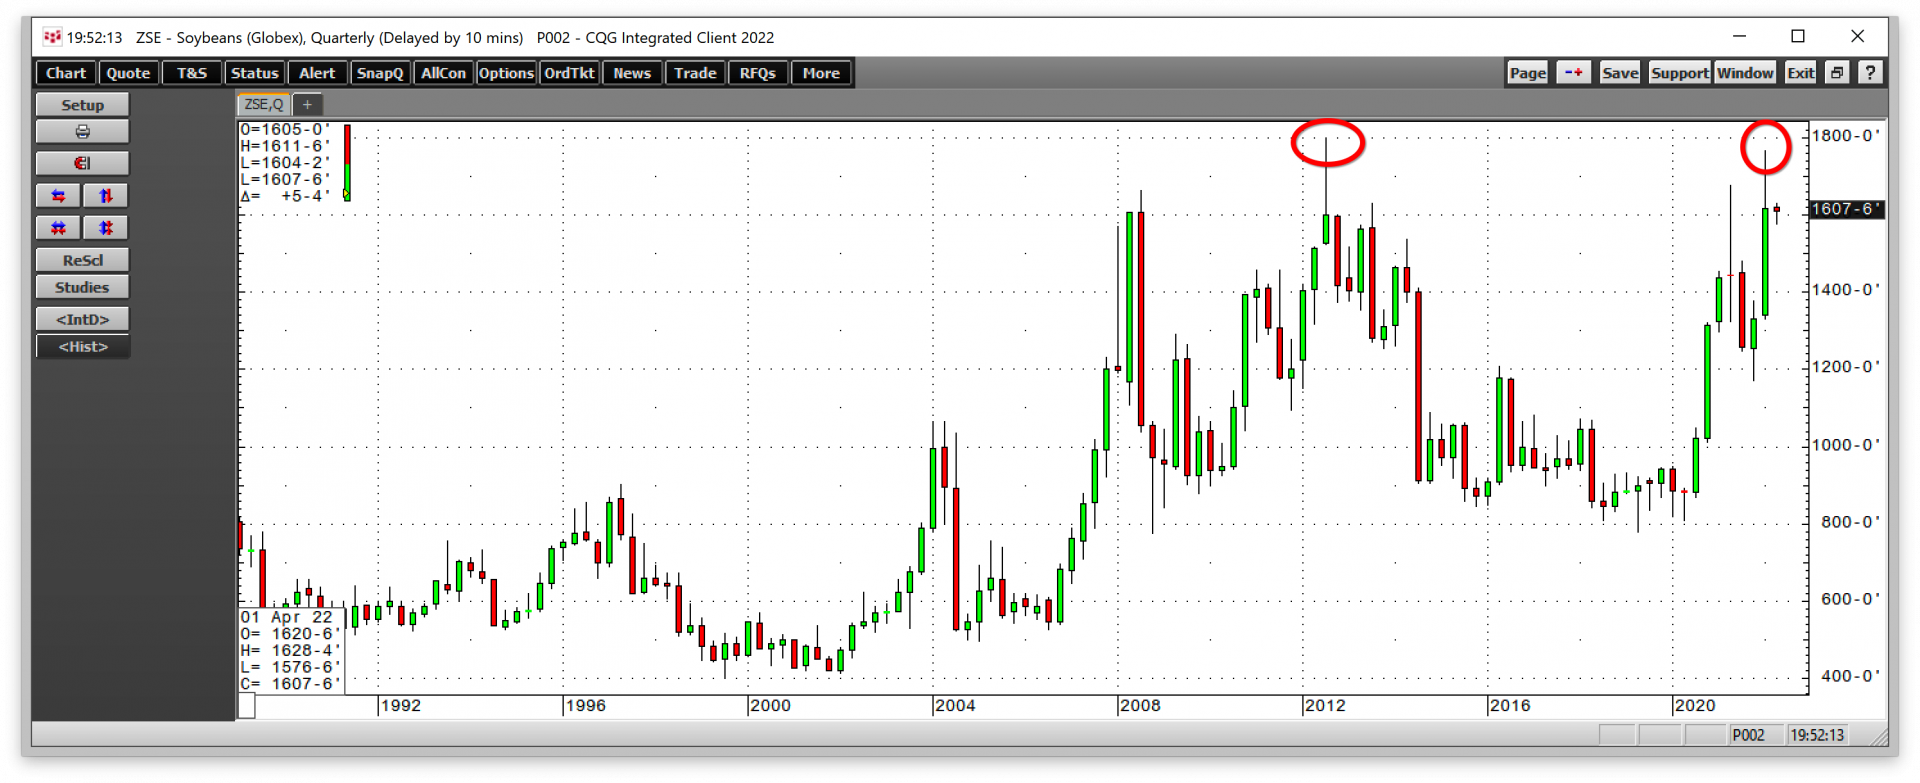
Nearby soybean futures rose to the highest price since 2012 when they traded at $17.65 per bushel in Q1 2022.
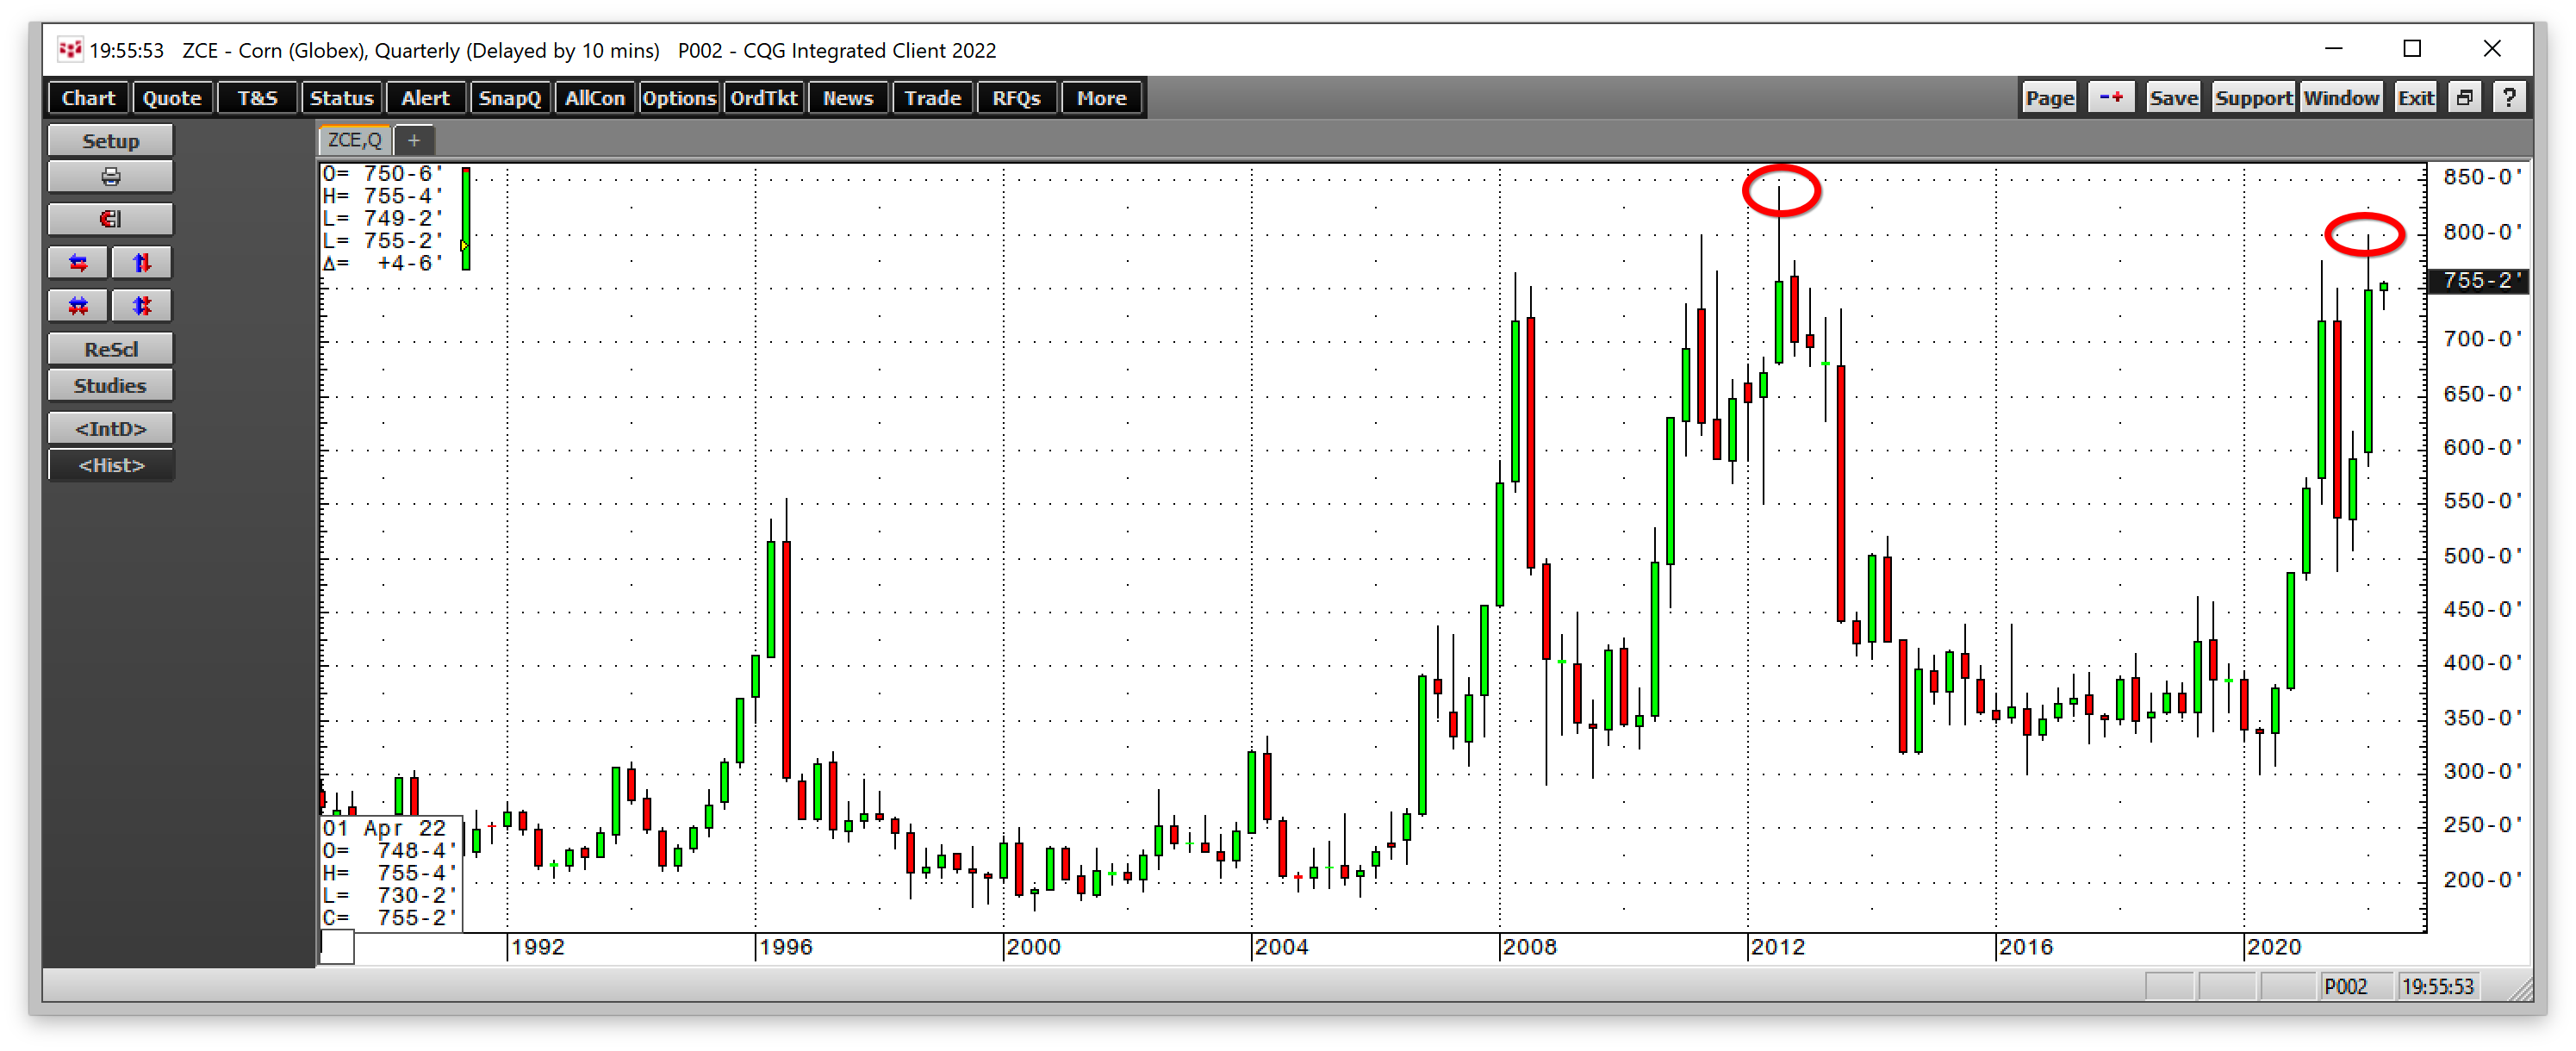
Nearby corn futures rose to $8 per bushel in Q1 2022, the highest price since 2012. Corn and beans are food and energy commodities as corn is the primary input in US ethanol production and soybean oil is an ingredient in biodiesel.
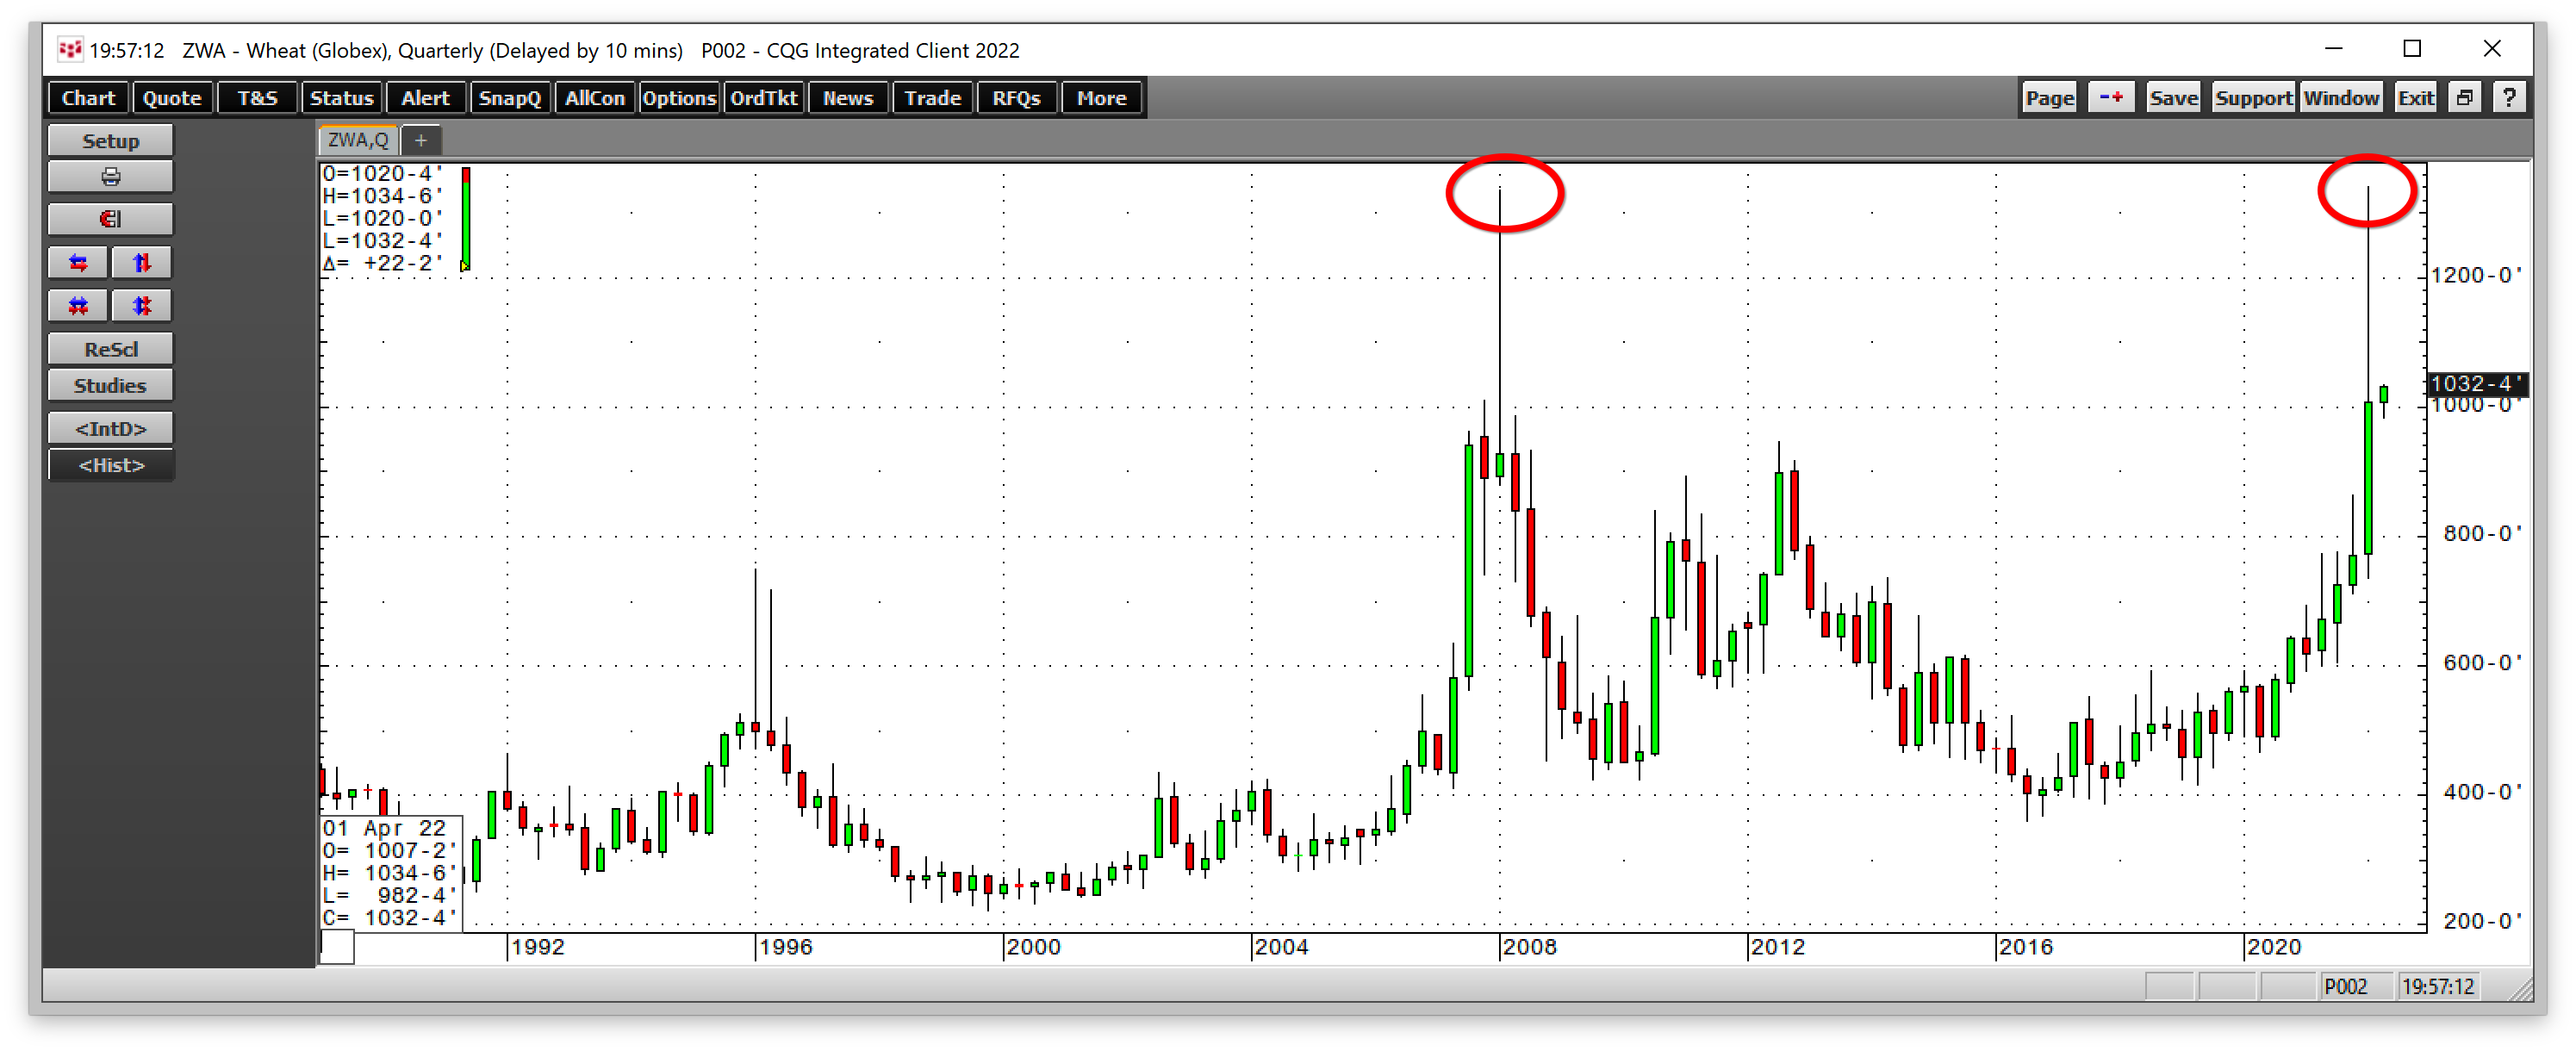
Nearby CBOT wheat prices rose to $13.40 per bushel in Q1, a new all-time high, eclipsing the 2008 $13.3450 previous record high. Russia and Ukraine export approximately one-third of the world’s annual wheat requirements. The war has turned Europe’s breadbasket into mine and battlefields. Moreover, the Black Sea ports are a war zone as the 2022 crop year in the Northern Hemisphere is getting underway in April.
Inflation has caused production costs to soar, and rising energy, labor, land, financing, equipment, and other expenses created a potent bullish cocktail. Moreover, Russia is a leading fertilizer producer, and US and European sanctions caused the Russians to “temporarily” ban fertilizer exports as the 2022 crop year gets underway.
Expect the unexpected in Q2 2022
The world has gone from one crisis to the next. The 2020 global pandemic gave way to the 2022 Russian invasion of Ukraine.
February 4, 2022 may go down as a watershed event in world history as it was the day Chinese President Xi and Russian President Putin shook hands on a $117 billion trade deal and a “no-limits” alliance. Twenty days later, Russia invaded Ukraine, and China’s support for Russia could set the stage for reunification with Taiwan over the coming months or years.
The pandemic was the event that impacted markets over the past two years. Meanwhile, the bifurcation of global nuclear powers along ideological lines will have long-lasting consequences for markets across all asset classes. Markets reflect the economic and geopolitical landscapes. Inflation and the highest level of geopolitical tensions since WWII could cause bouts of extreme price variance. Expect the unexpected in Q2 2022 and beyond, and you will not be disappointed.