In 2008, the global financial crisis caused by a housing meltdown in the US and sovereign debt issues in Europe caused a risk-off period that sent the prices of all assets appreciably lower. Crude oil, copper, precious metals, and a host of other commodities prices fell dramatically. Central banks around the world led by the US Fed stepped in, cut interest rates, and dug deep into their monetary policy toolboxes to stabilize the global economy. Since then, markets have experienced speedbumps, but nothing like the conditions seen in 2008. In 2011, many commodity prices reached new highs as the asset class staged a significant recovery.
In late 2015 and early 2016, an economic slowdown in China caused commodity prices to decline to multiyear lows. The world had become accustomed to double-digit economic growth from the Asian nation, but as GDP grew, it became impossible to sustain the same rate of expansion. President Xi rolled out the “new normal,” which set expectations for lower, but stable growth from the world’s second-leading economy. Since then, China has faced one crisis after another. The latest is a virus that is spreading across the world’s most populous nation. When China catches an economic cold, the world comes down with financial flu. The outbreak of Coronavirus has caused fears of a global pandemic with significant ramifications for the worldwide economy at the end of January 2020.
Trade fears calm
Since China is the demand side of the fundamental equation for most commodities because of its population and economic growth, protectionist policies designed to force negotiations on trade weighed heavily on its economy. In August 2019, the trade dispute escalated into an all-out trade war complete with US tariffs and retaliatory measures from China. The rhetoric flew back and forth between Washington and Beijing, but behind the scenes, negotiations continued. At the same time, China faced domestic issues as protests and demonstrations in Hong Kong grew, weighing on its economy.
In December, the two sides agreed on a “phase one” deal and to continue talking and working towards a comprehensive agreement. The breakthrough on trade eased the fear and uncertainty that the trade war would thrust the world into a global recession. The stock market in the US rose to a new all-time high, Chinese equity prices recovered, and many commodity prices rallied. Copper rose to almost $2.90 per pound and crude oil to over $60 per barrel on the back of the prospects for global economic growth. At the same time, the Chinese seemed to calm a tense situation in Hong Kong. Optimism rose at the beginning of 2020, but a new problem in China emerged.
The virus takes the center of the stage
After the trade issue and problems in Hong Kong, the outbreak of Coronavirus stoked concerns that the rising number of cases would cause a pandemic. As of the end of last week, the number of cases in China continued to rise, with reports of illness across all continents.
The Chinese population is a massive part of the global addressable consumer market. The government is taking significant precautions. Businesses are remaining closed after the Lunar New Year holiday, people are not traveling, and many are staying at home to avoid catching the virus. As the nation of 1.4 billion people grinds to a halt, the potential impact on the Chinese and global economies could be devastating. Since the outbreak of Coronavirus, we have seen risk-off conditions in markets across all asset classes.
Crude oil and copper markets have been falling like stones. Crude oil powers the world, and China is one of the leading consumers of the energy commodity. Copper is a barometer for the Chinese economy as it is an essential building block for infrastructure.
Crude oil moved to the bottom end of its trading range - an ugly picture on the monthly chart
The Coronavirus is just one of many issues impacting the crude oil market these days, but it has had a bearish impact on the energy commodity. On January 8, the price of crude oil climbed to the highest price since April 2019 when it traded to $65.65 per barrel on the nearby NYMEX futures contract. Tensions between the US and Iran rose to a boiling point, causing supply fears. However, the situation calmed after a series of hostilities, and the price corrected lower. At the same time, US output rose to a record 13 million barrels per day, causing the price to fall below the $60 per barrel level. The virus in China added to the selling. The potential for a risk-off period drove the price of crude oil futures to the bottom end of a trading range that had been in place for the past year.
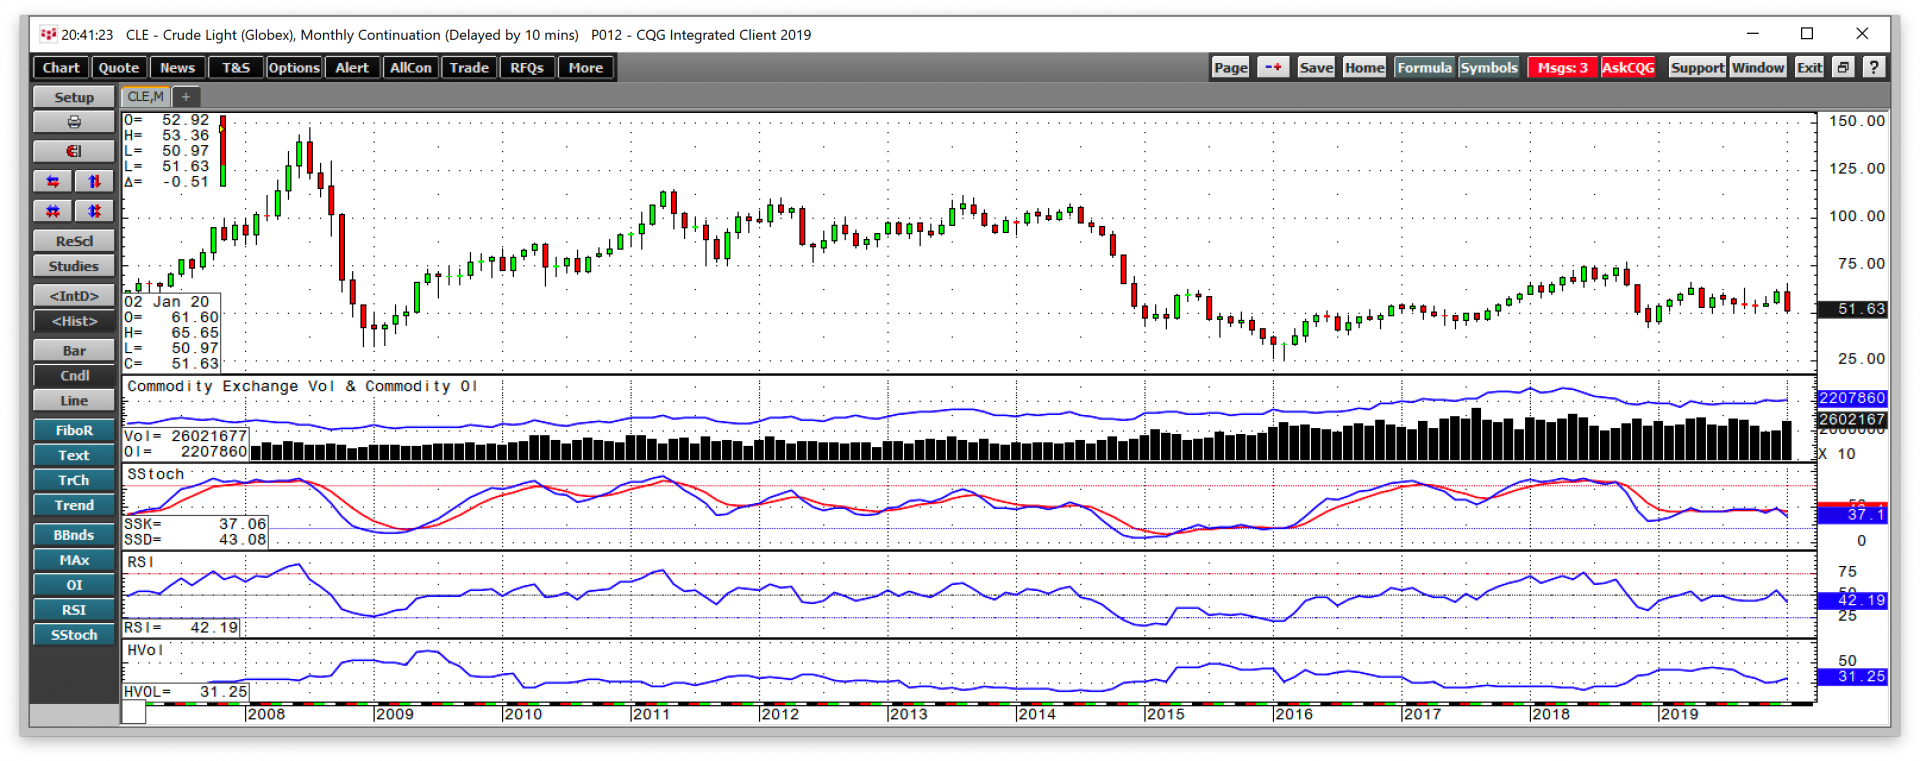 The monthly chart highlights the downside correction that took the price of NYMEX futures from within 95 cents of the 2019 high in January to the bottom end of its trading range. The low from December 2019 was at $55.35 per barrel, and the close on January 31 created a bearish reversal trading pattern on the monthly chart. Follow through selling could lead to prices below the $50 level in February, which is traditionally a weak month for the oil market. In 2016, the price of nearby NYMEX futures fell to a low of $26.05 during the second month of the year. Price momentum and relative strength indicators turned lower on the back of the price action in January. Open interest, the total number of open long and short positions in the futures market had been gently rising as the price declined. Falling price and increasing open interest is typically a technical validation of a bearish trend in a futures market. A continuation of risk-off behavior in markets could push oil lower over the coming days and weeks.
The same pattern in copper
The copper futures market experienced the same bearish price action as crude oil.
 The monthly chart shows that the red metal also put in a bearish reversal pattern in January as the price rose to a high of $2.8860, above the December 2019 peak of $2.8670. Copper then proceeded to close the month below the December low of $2.6050 per pound on the nearby futures contract. The slow stochastic and relative strength indicator both turned lower below neutral readings.
In a sign that the fears over the Coronavirus are impacting other markets, US stocks corrected from the recent all-time high, and bonds have rallied.
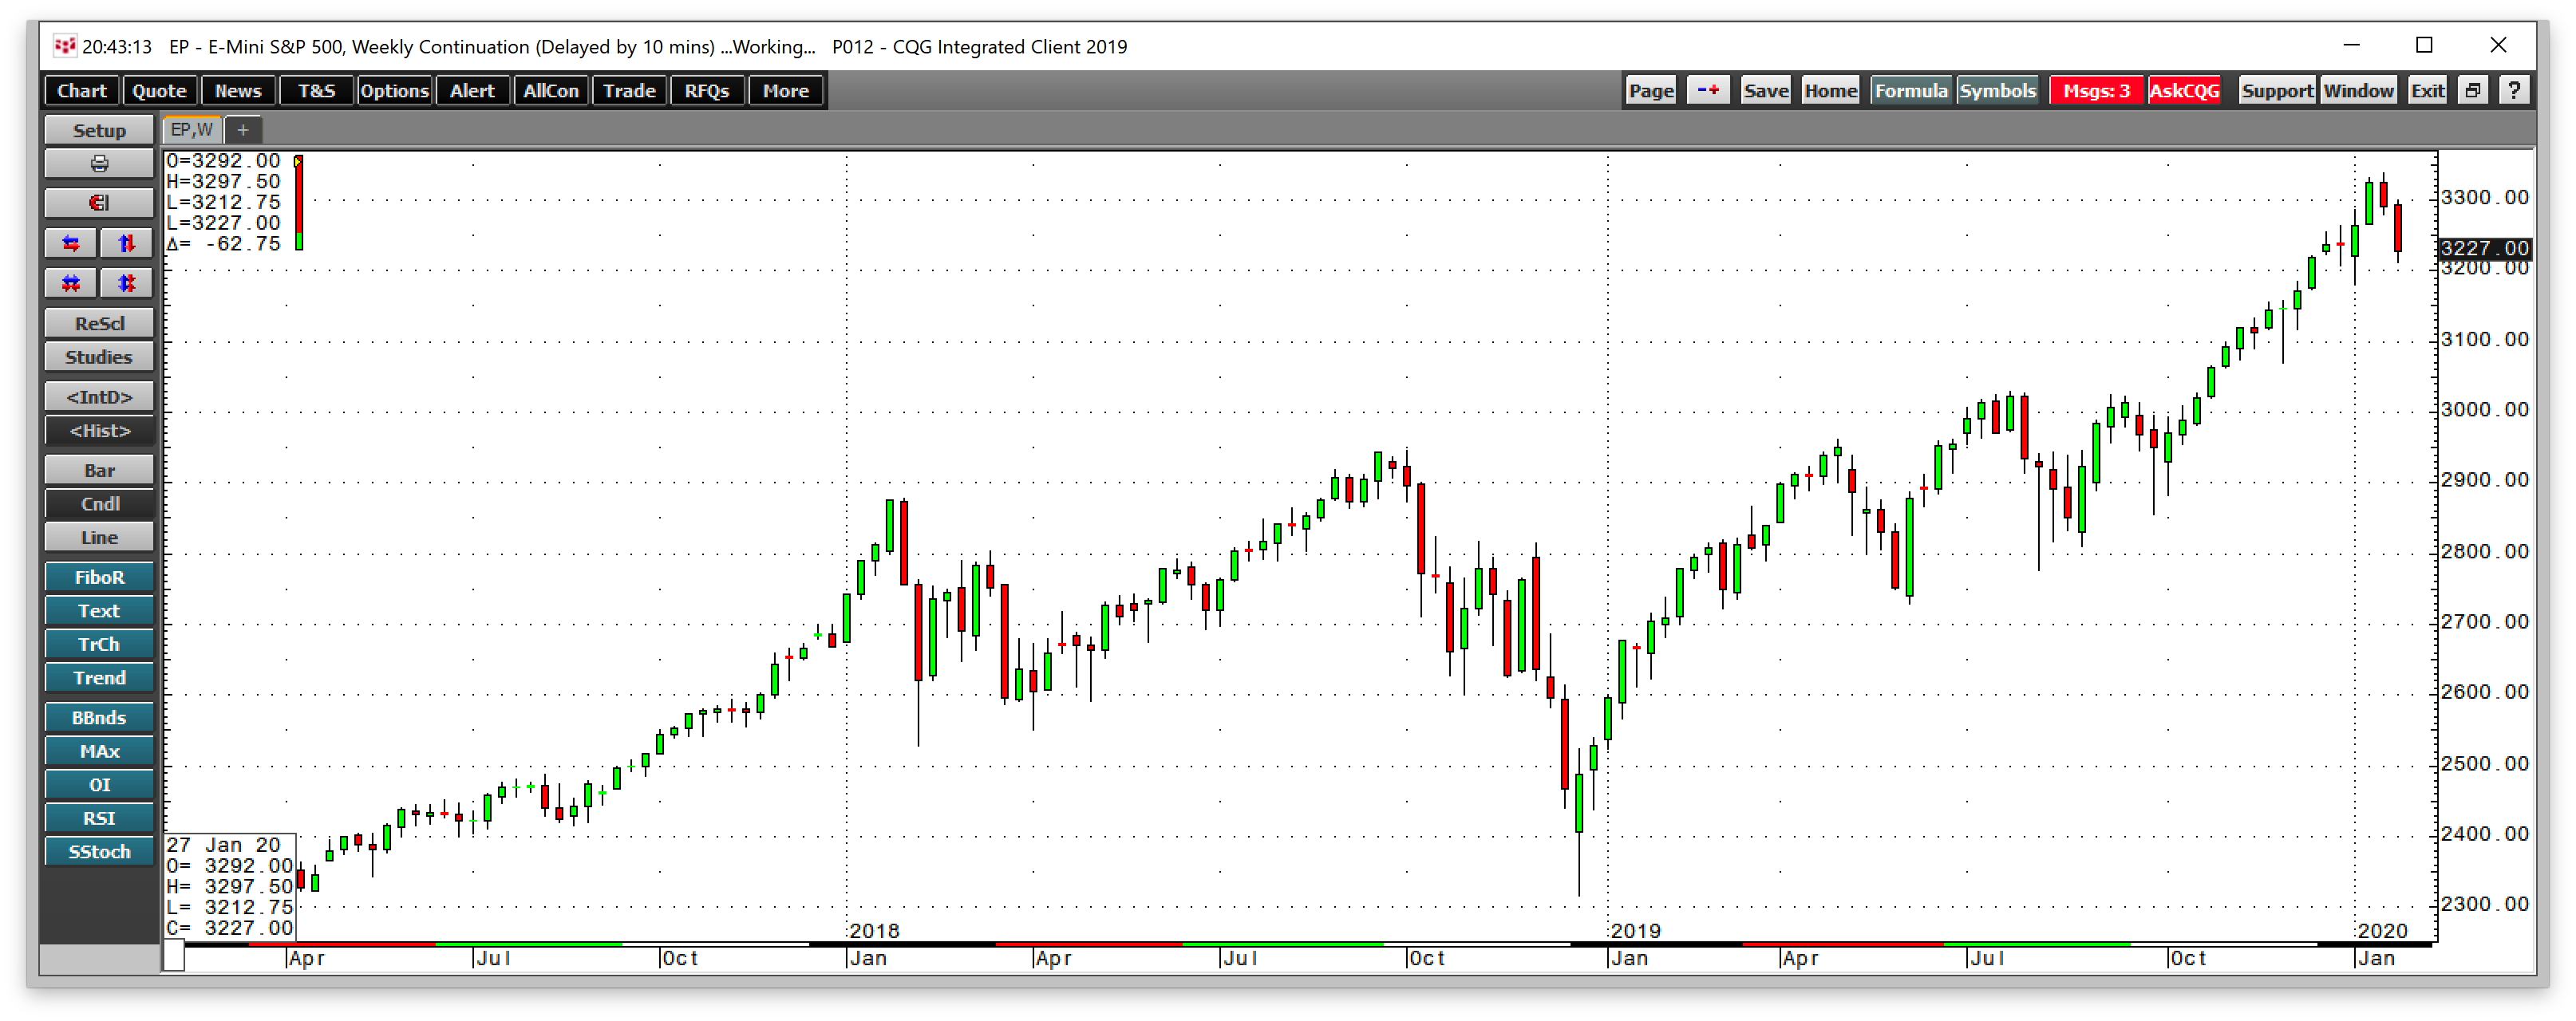 The weekly chart of the E-Mini S&P 500 futures contract shows the corrective price action over the past two weeks.
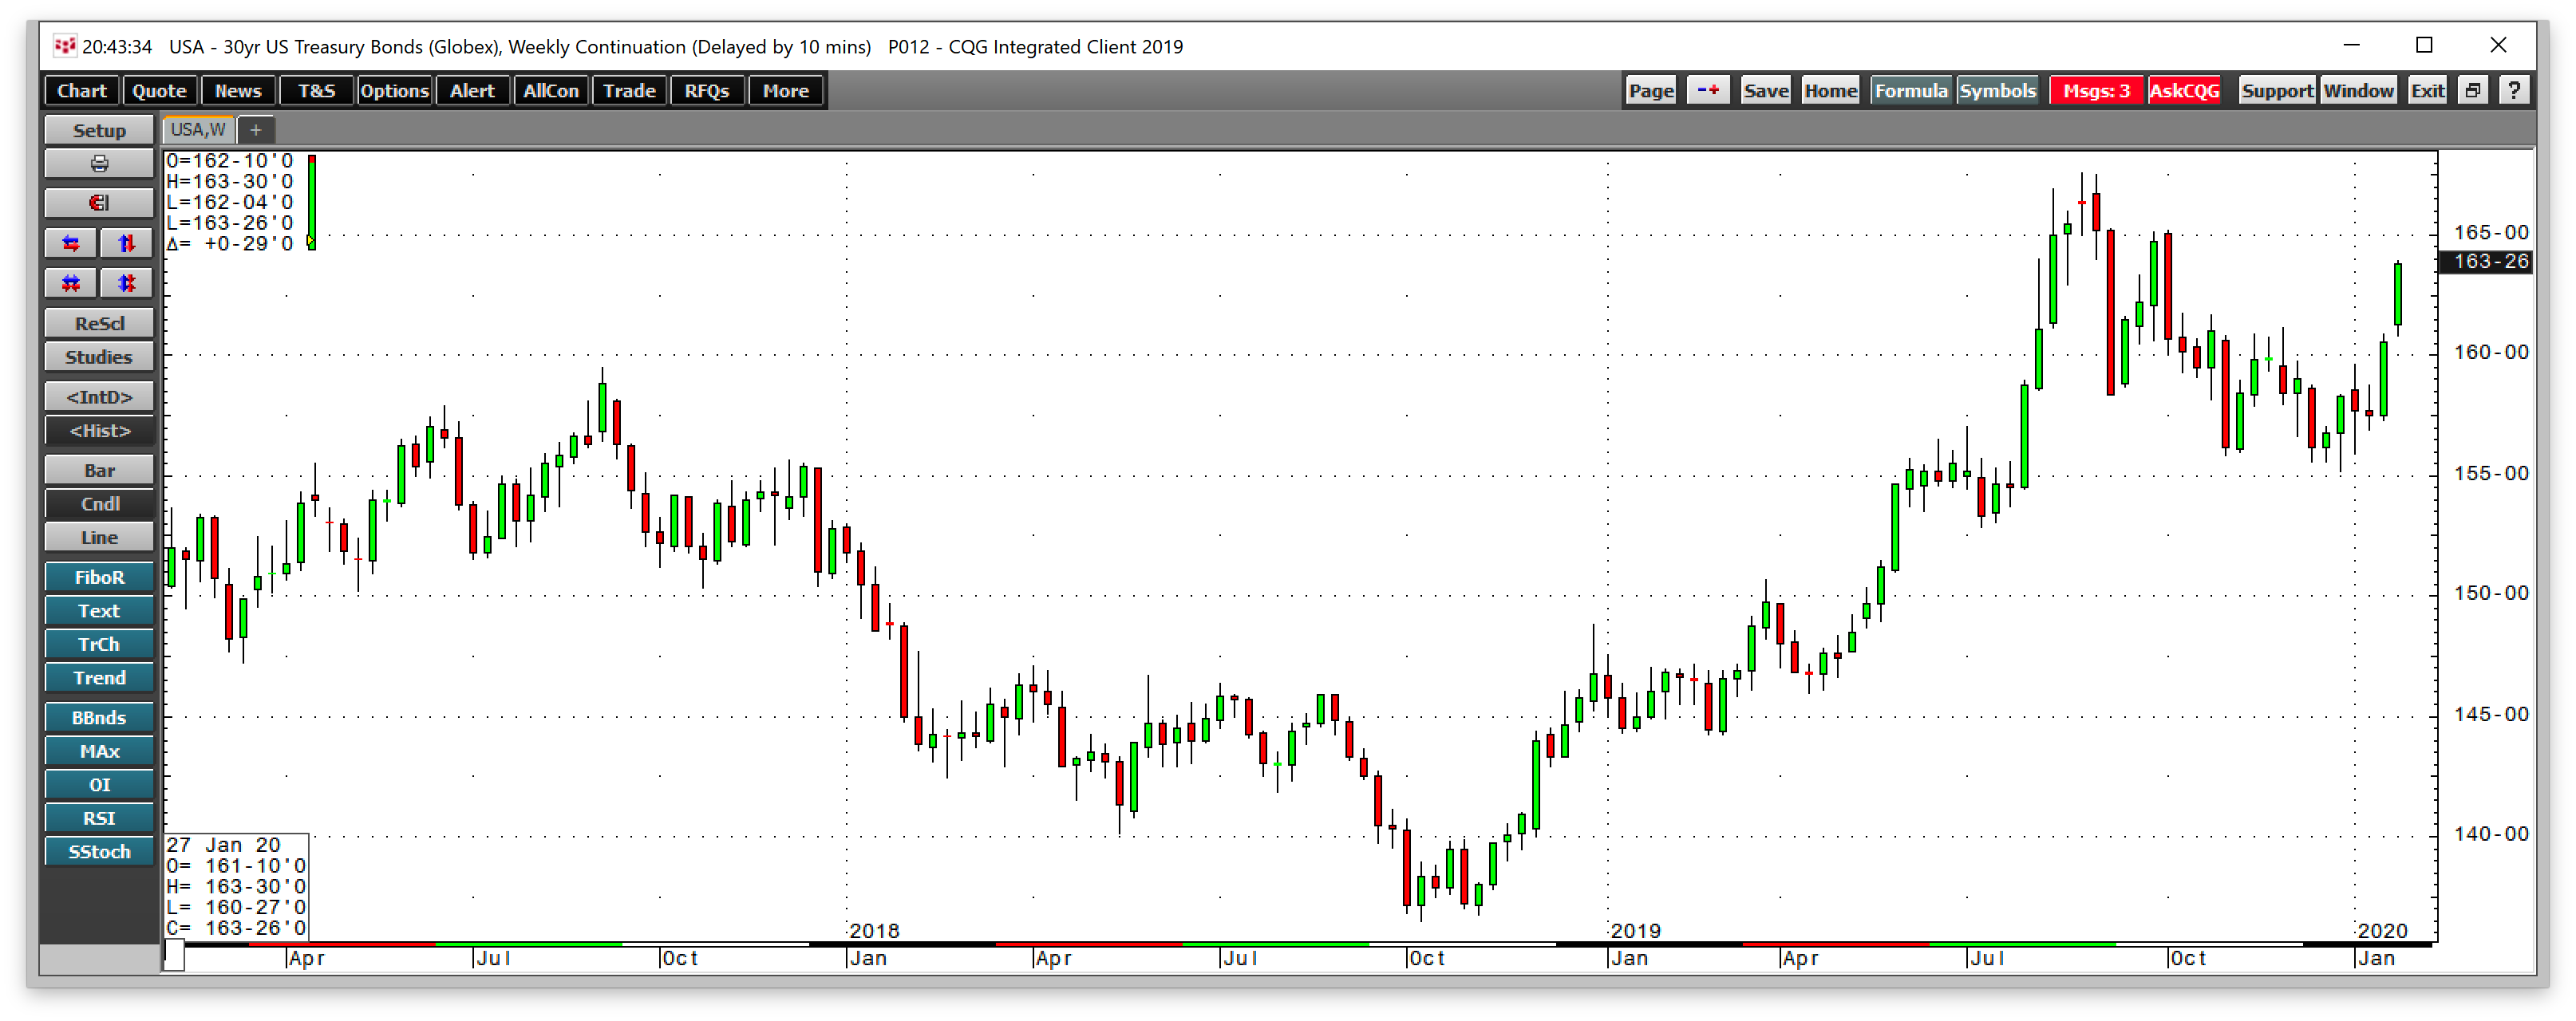 The US 30-Year Bond futures have been rallying as market participants have flocked to “safe” assets.
Gold is the safe haven
The gold market broke out of a $331.30 trading range in June when the US Fed told the market to expect interest rates to fall by the end of 2019. The level of critical technical resistance in the gold market was at the July 2016 peak of $1377.50 per ounce. By September, gold reached a high of $1559.80. Tensions between the US and Iran drove the price of the yellow metal to $1613.30 in December. Gold has not only rallied in US dollar terms but all other world currencies. The precious metal rose to an all-time high in most other currencies in January in a sign of underlying strength for the metal that is also the world’s oldest means of exchange. Gold was trading around the $1588.50 level on the final day of January, even though many other markets were under pressure.
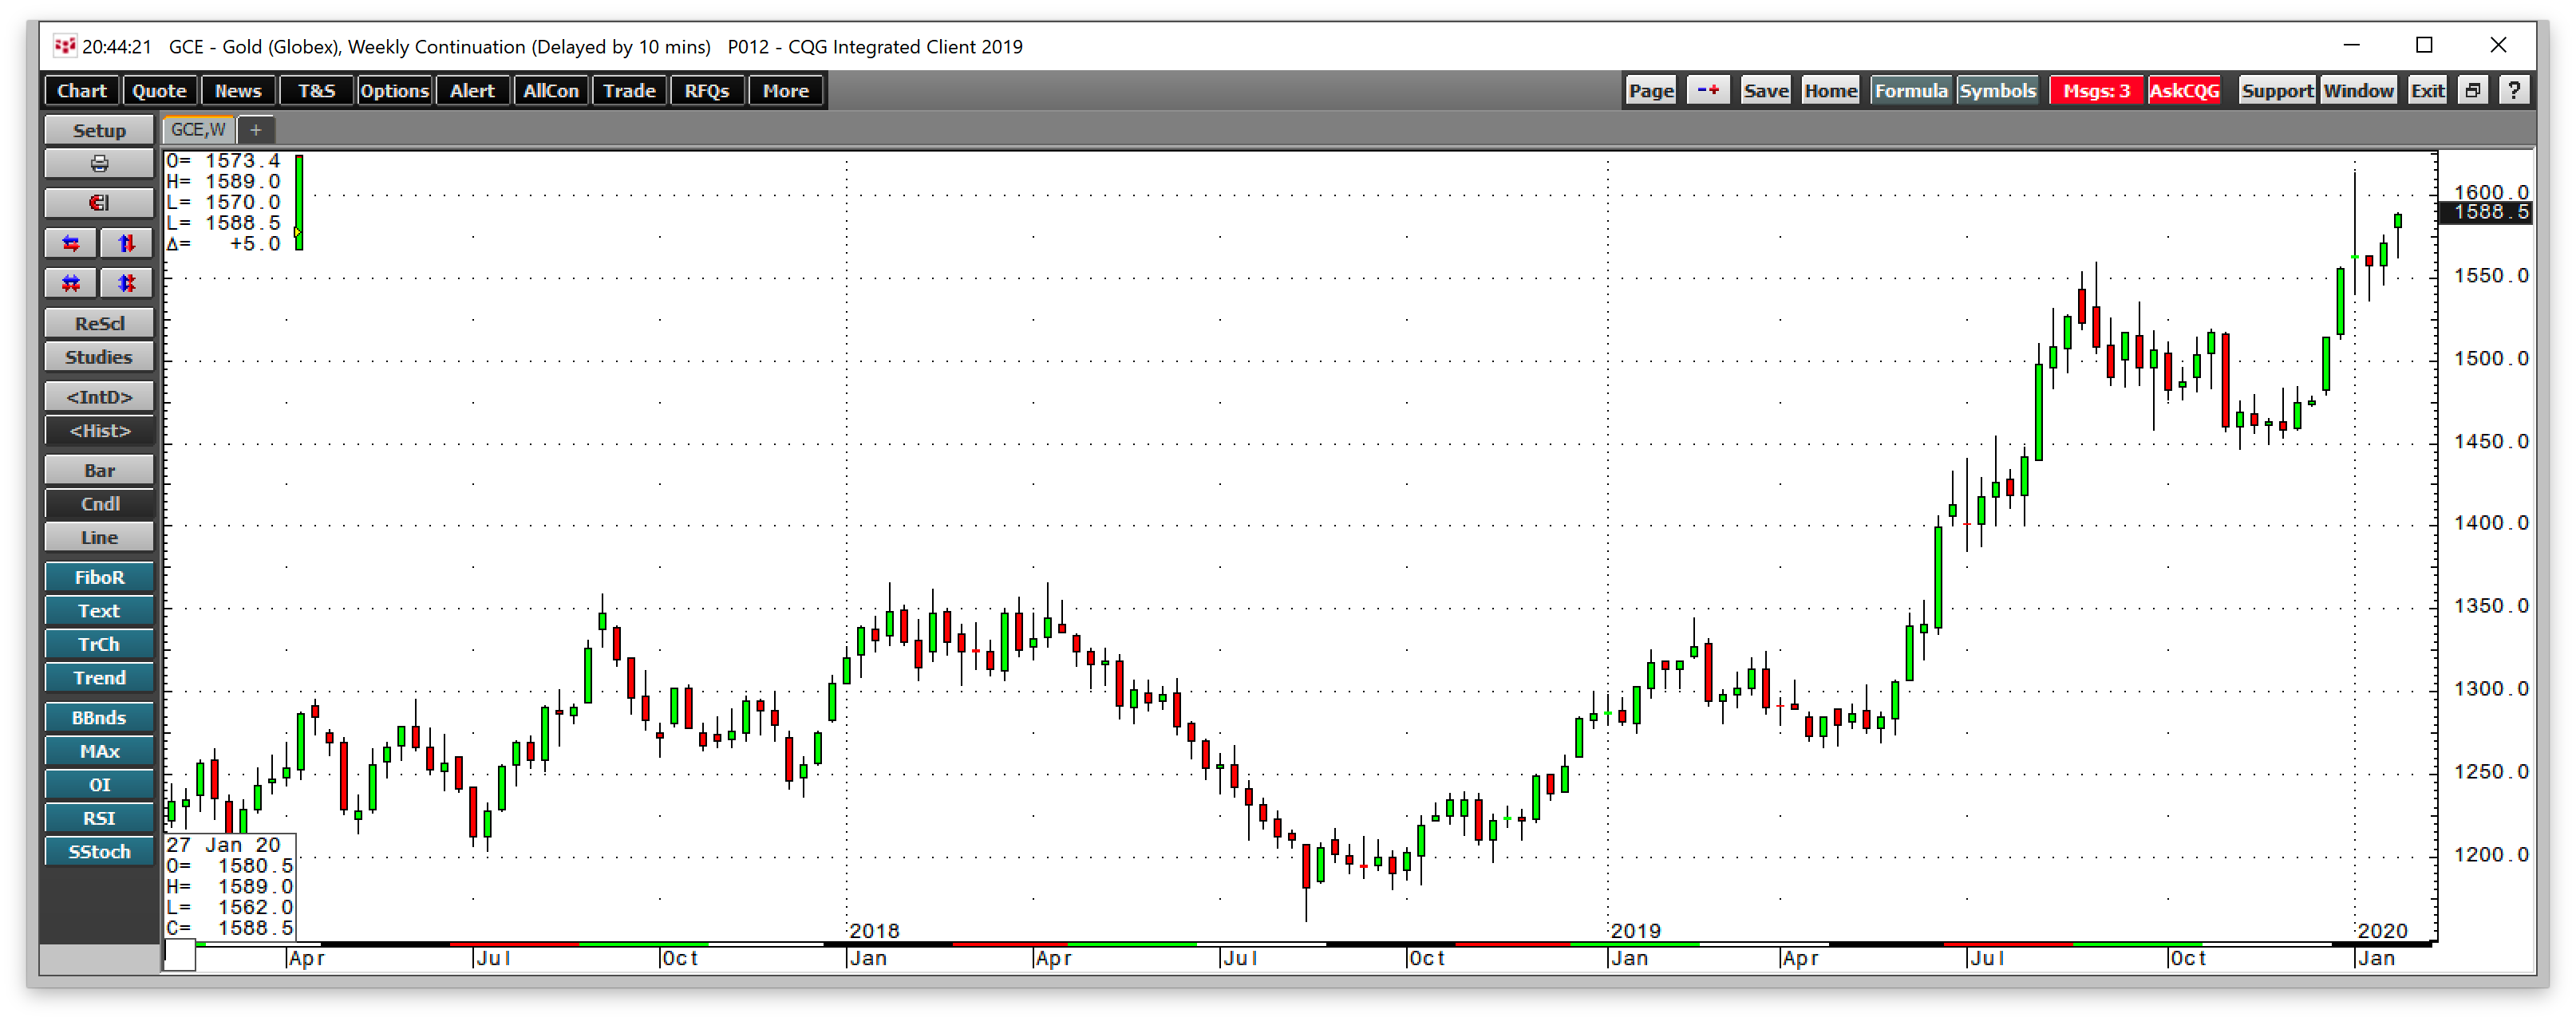
As the weekly chart illustrates, gold was above the September 2019 high at the end of January. The bullish price action in the gold market is a sign that investors and traders view the yellow metal as a safe harbor these days.
Coronavirus has the potential to trigger further risk-off behavior in markets across all asset classes. Safe haven assets could be the best bet over the coming days and weeks if the number of cases around the world continues to rise.