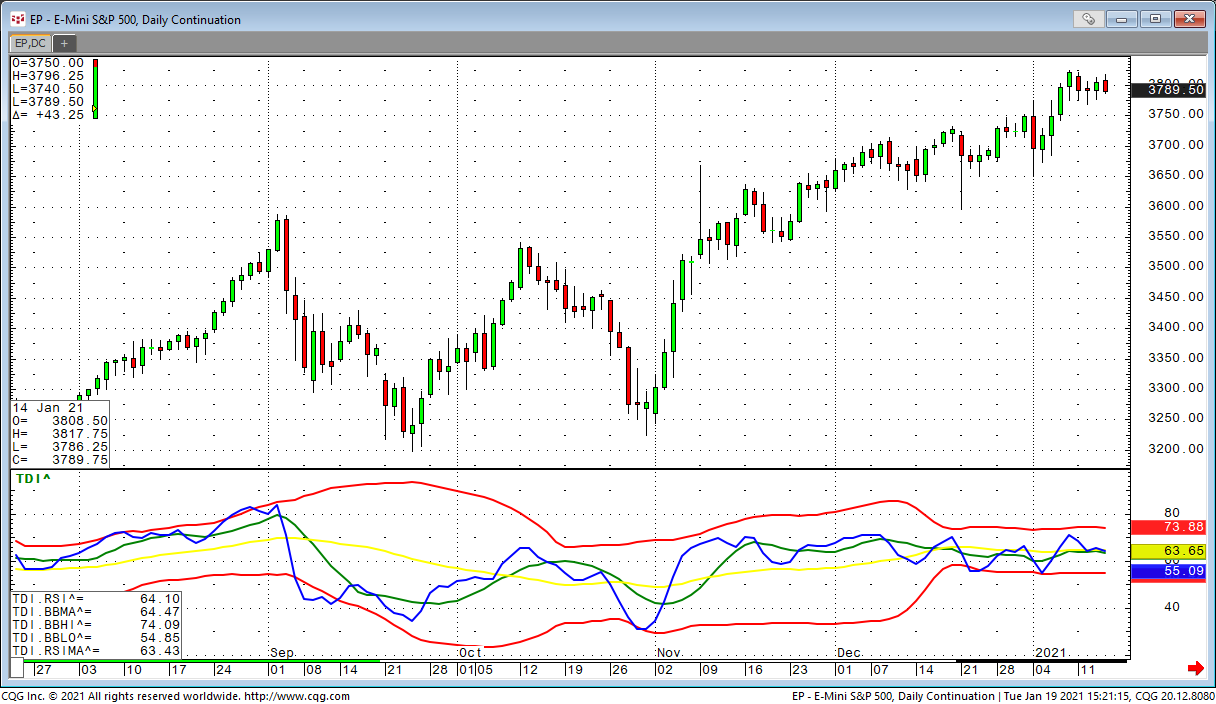
The Trader Dynamic Index is a combination of RSI and Bollinger Bands. We use a 13 period RSI with a tight moving average on top of it and another moving average on top of this. This is some kind… more
Indicators
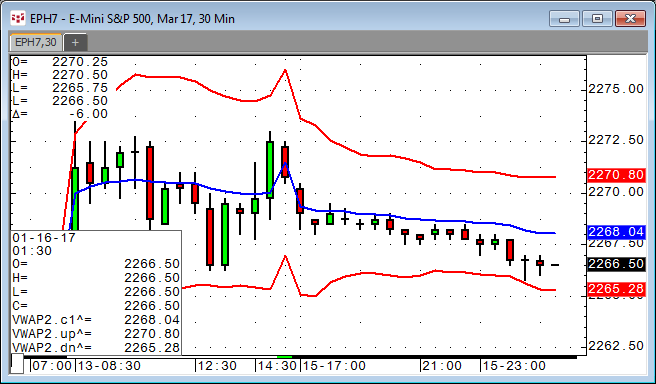
Here is a special version of the Volume-Weighted Average Price (VWAP) study including standard deviation bands.
VWAP is the volume-weighted average price for a futures contract… more
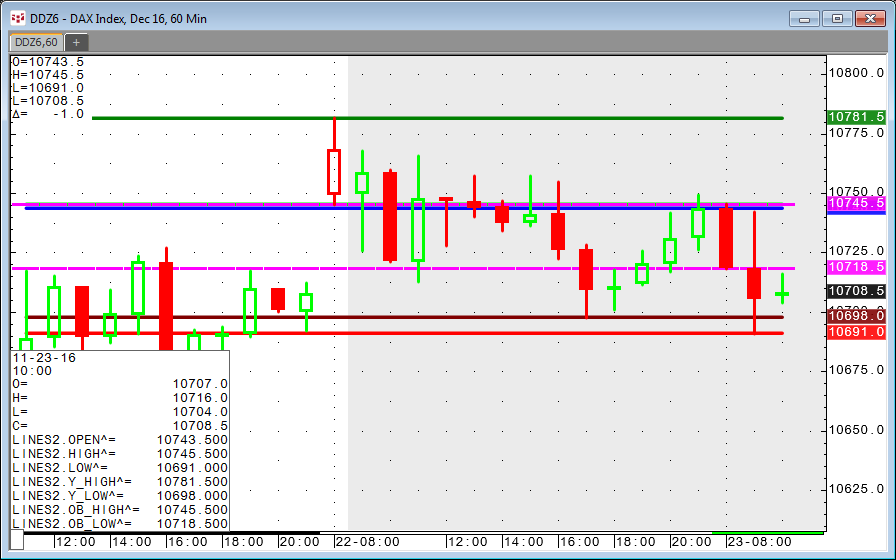
This custom study produces seven horizontal lines on a chart: today's open, high, and low; yesterday’s high and low; and today’s high and low for the opening balance. We often receive… more
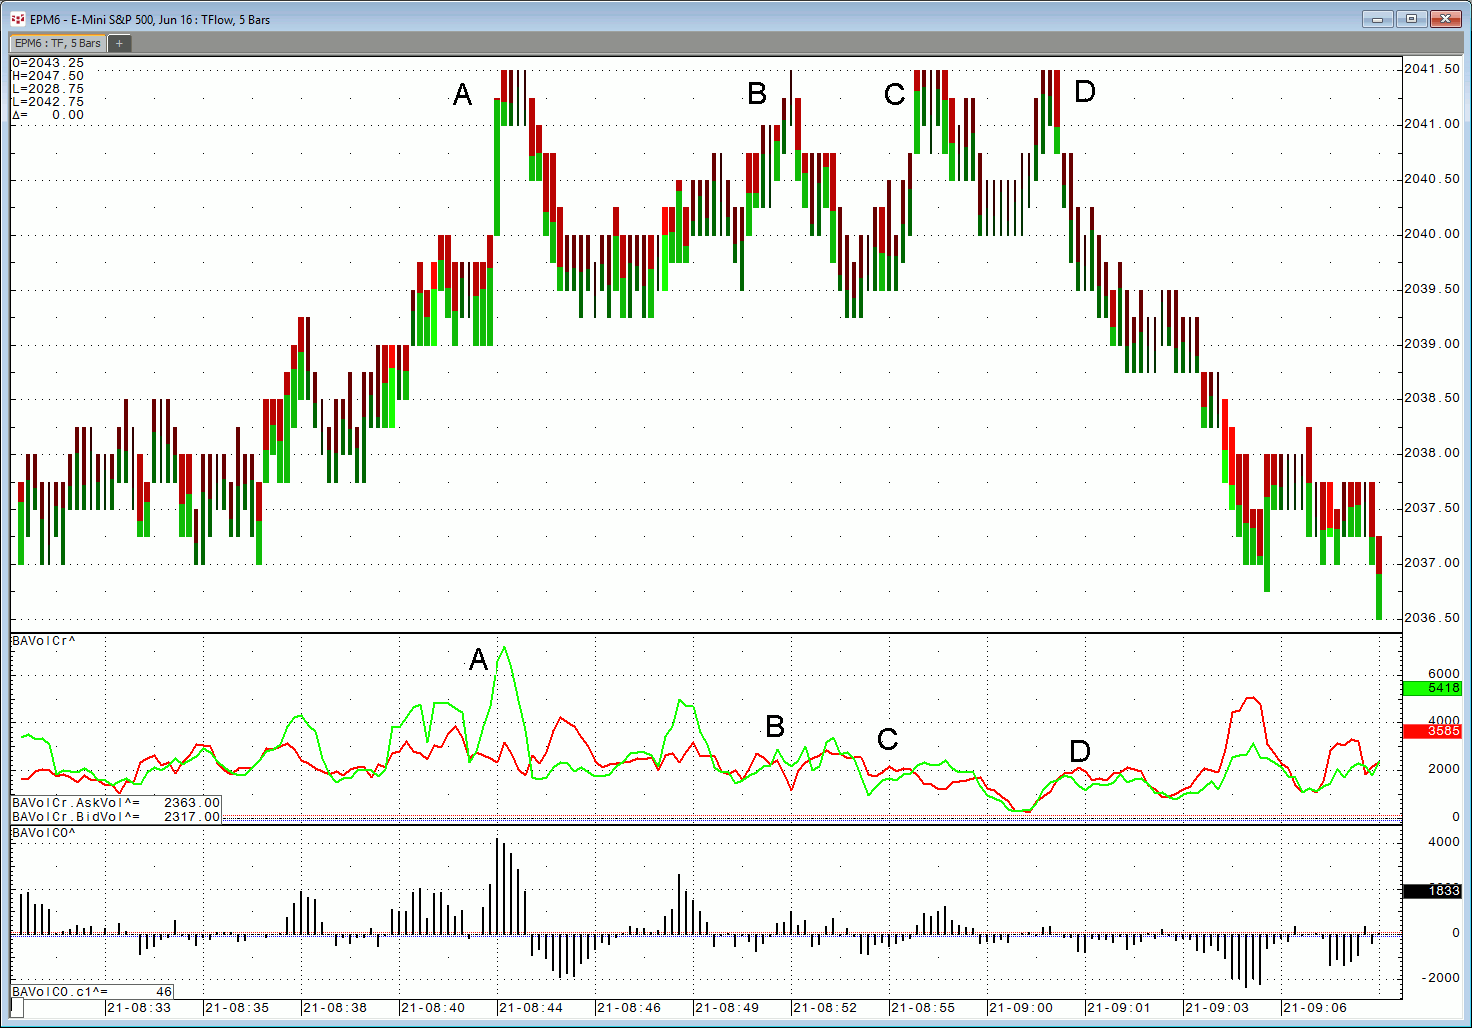
CQG provides the ability to separate volume into trades executed at the best bid price and trades executed at the best ask price. This feature gives you more insight into market action because you… more
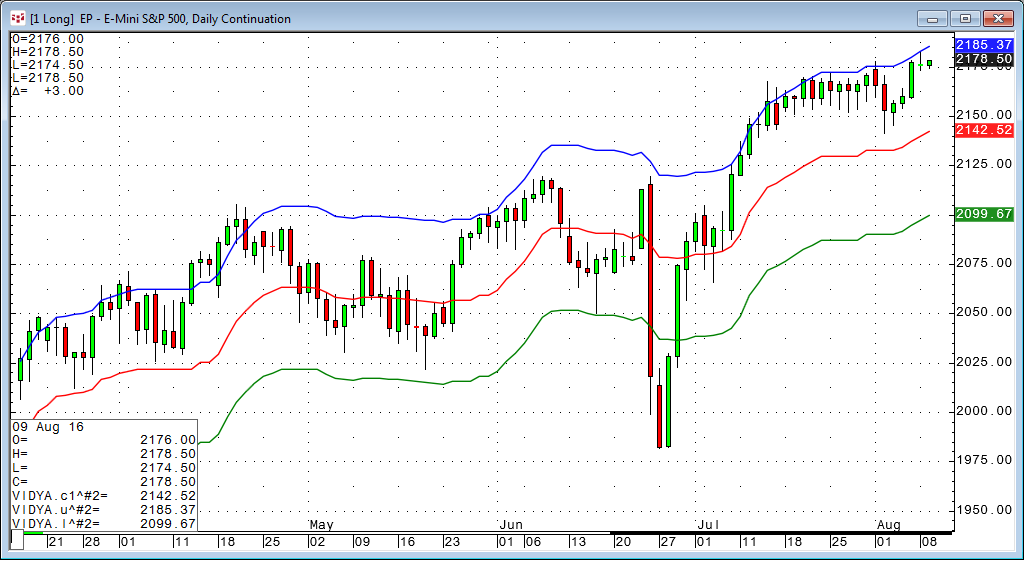
Chande's Variable Index Dynamic Average (VIDYA) is similar to the Exponential Moving Average (EMA), but automatically adjusts the smoothing weight based on price volatility.
VIDYA was… more
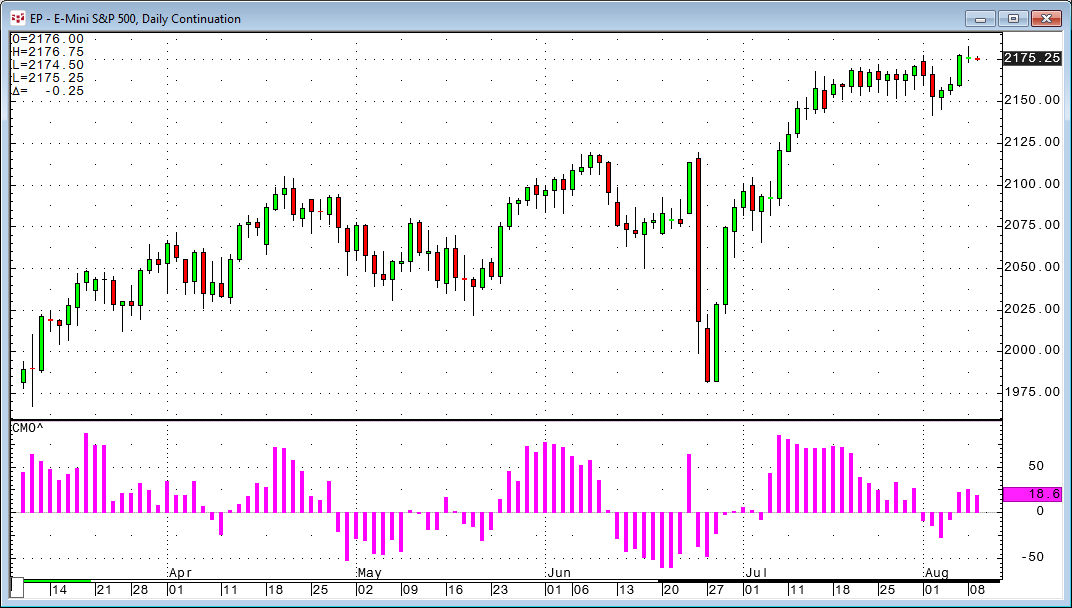
A technical momentum indicator invented by the analyst Tushar Chande.
The Chande Momentum Oscillator is created by calculating the difference between the sum of all recent gains and the sum… more
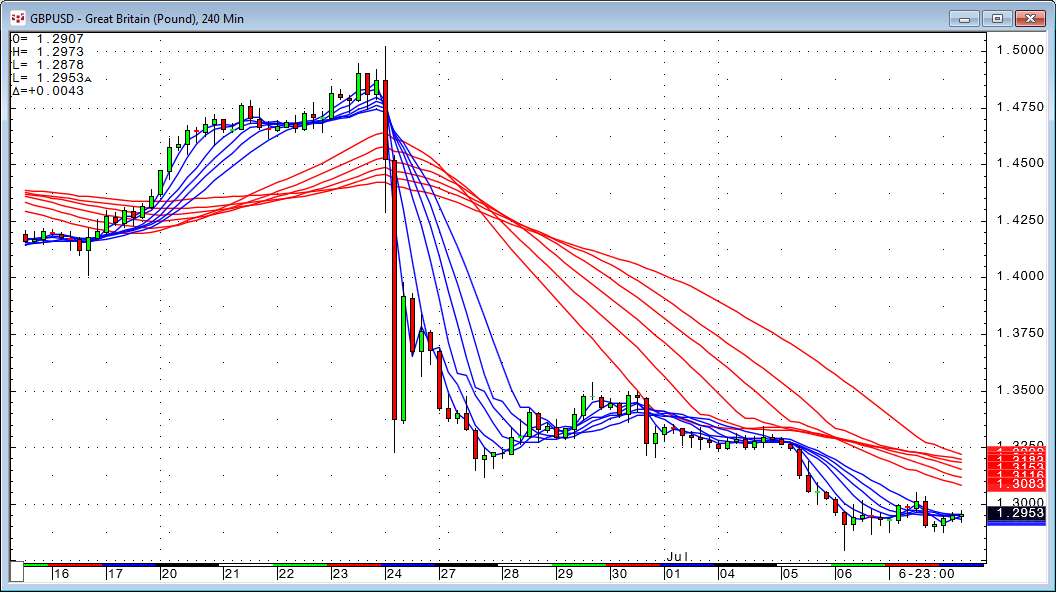
The Guppy is an indicator used in technical analysis to identify changing trends. The technique is based on combining two groups of moving averages with differing time periods.
One set of… more
Volume-Weighted Average Price with Bands
VWAP is the volume-weighted average price for a futures contract plotted as a line on the price chart. The calculation is the sum of traded volume,… more
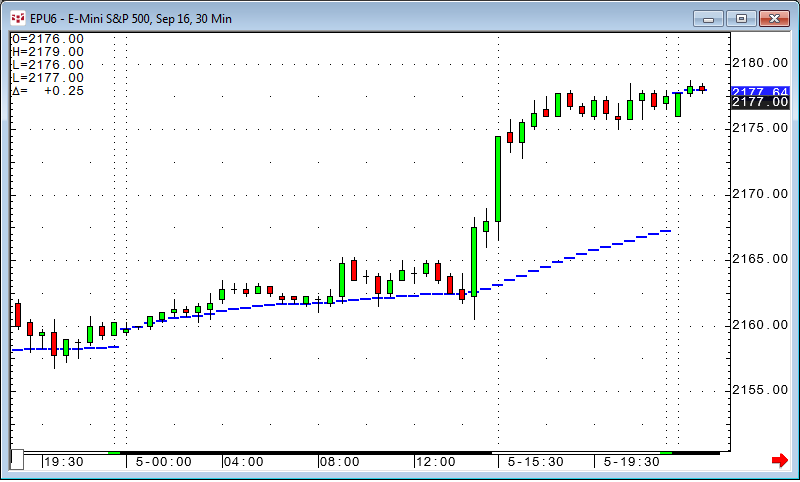
Flexible Period Moving Average
The Fluid indicator is only used for intraday charts. The idea is to have a moving average with a length that corresponds to the number of bars… more
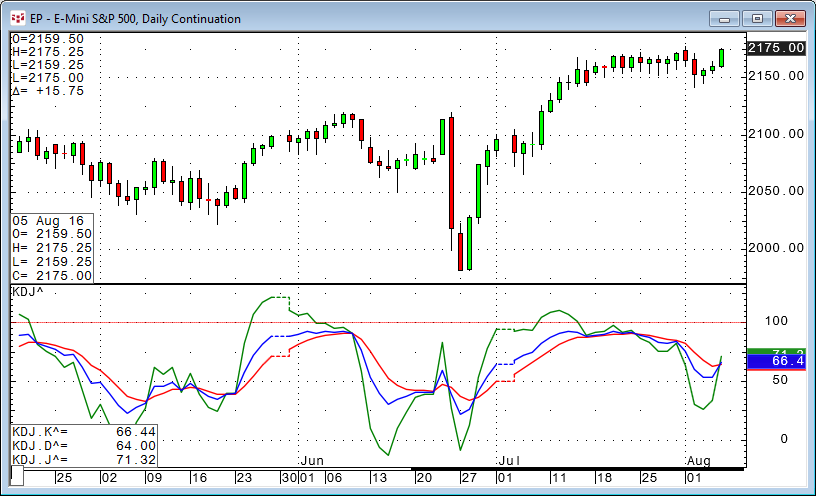
The SSK indicator using a divergence line
The KDJ indicator is actually a derived form of the Slow Stochastic with the only difference being an extra line called the J line. The J line… more