The silver-gold ratio measures the price relationship between the two precious metals. Silver and gold are hybrid commodities as both have long histories as both metals with a myriad of applications and as financial instruments. Long before there was dollar, euros, pounds, or any of the other currencies in circulation around the globe today, silver and gold were means of exchange.
Five thousand years ago, in around 3000 BC, the first Egyptian Pharaoh, Menes, stated that two and one-half parts silver equal one-part gold. The declaration was the first that linked the value of silver and gold. Over the centuries, many people continued to measure the value of silver and gold using the ratio. Since silver and gold began trading in the futures market on the COMEX division of the CME in the 1970s until recently, the number of ounces of silver value in each ounce of gold value traded in a range between 15.47:1 in 1979 to 94.58:1 in 1990. The average at around 55:1 is a level that many market participants believe is a guidepost for the relative value of the two metals. When the ratio is above the average, silver is historically inexpensive compared to gold. When below the 55:1 level, silver is traditionally expensive.
The ratio has risen over the years as central banks hold gold as part of their foreign currency reserves, but they do not hold silver any longer. Meanwhile, silver is a highly speculative metal. Market participants that follow price trends tend to flock to the silver market when it begins to move higher or lower because of the metal’s history of significant percentage moves. Memories of price appreciation to either side of the $50 per ounce level in 1980 and 2011 make silver a trading instrument that can provide substantial returns.
In March, the global pandemic’s risk-off conditions pushed the price of silver to its lowest level in over a decade, while gold’s downside correction was far less on a percentage basis. The move that took silver below $12 per ounce for the first time since 2009 sent the ratio to a new modern-day high at almost 125:1. Since then, the relationship declined to below the 100:1 level.
The recent price action in the ratio is similar to 2008. If history is going to repeat, silver could be ready for a significant move to the upside over the coming months and years.
The ratio rises to a record high in March
In March, when the price of silver fell below $12 per ounce for the first time since 2009, the ratio exploded to a modern-day record high.
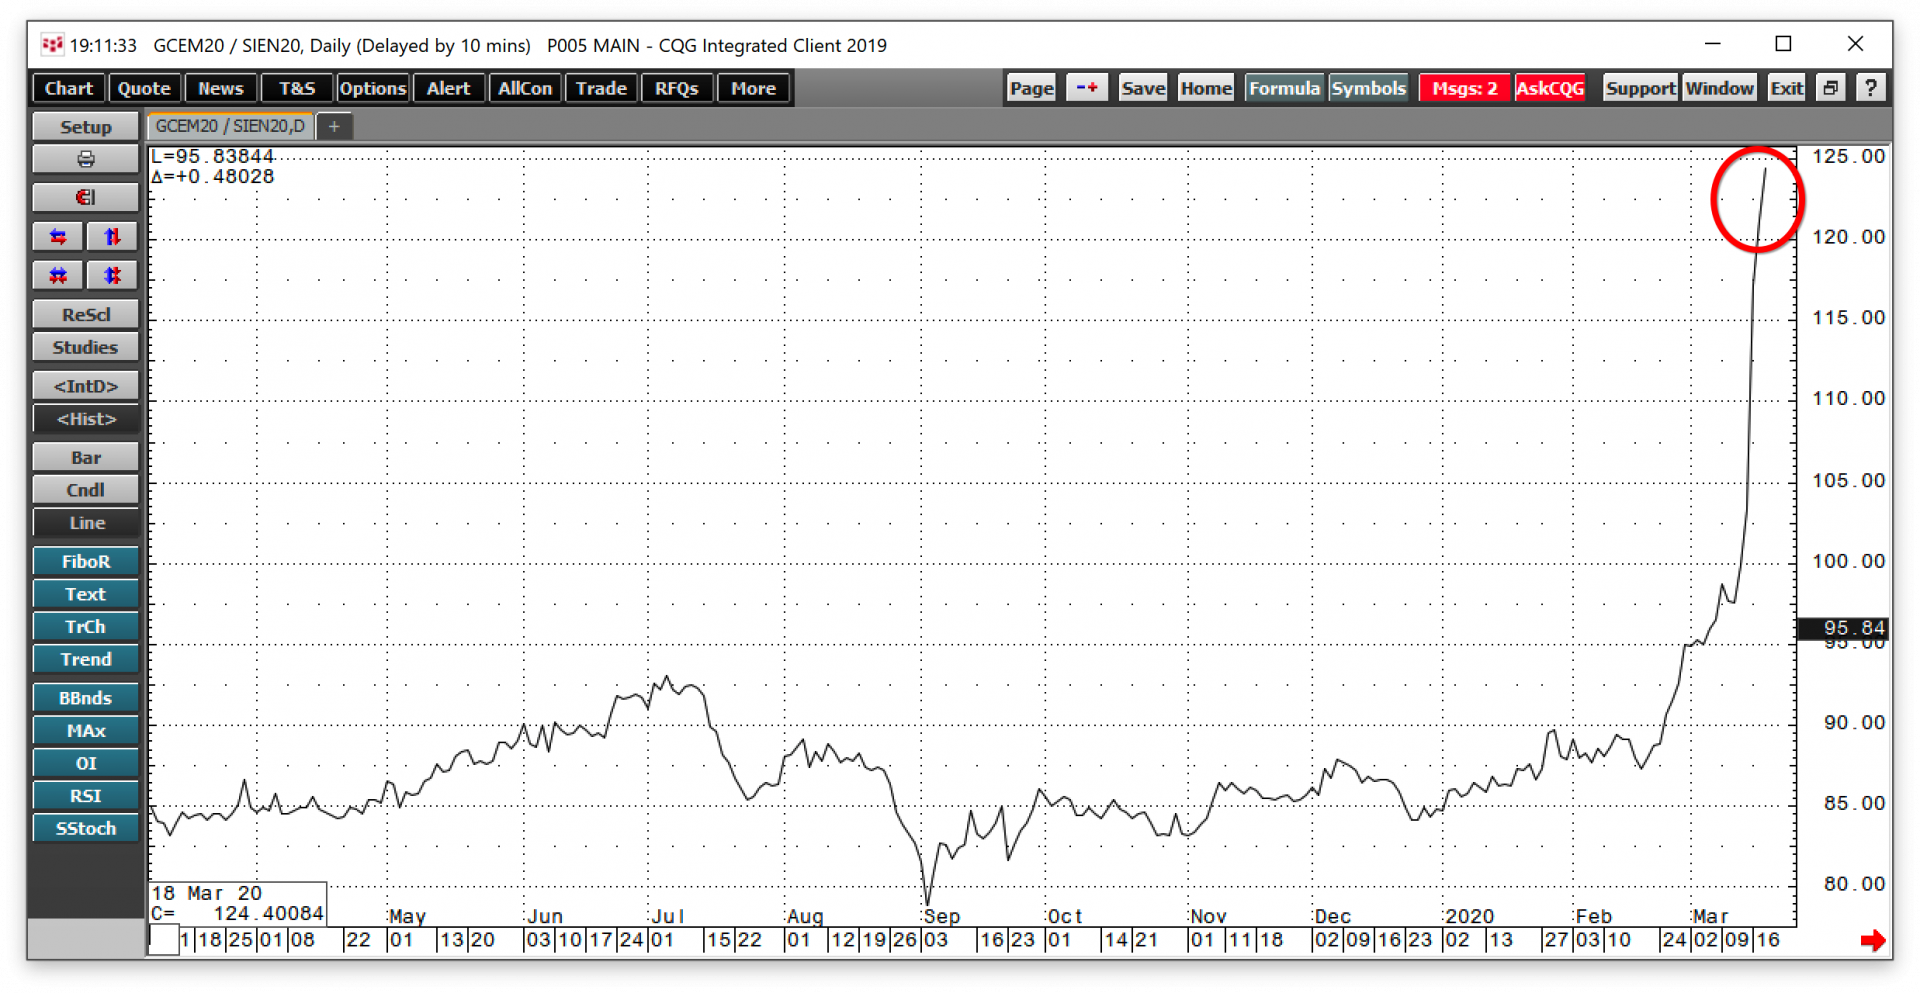
On March 18, the peak came at 124.40:1. Both gold and silver prices corrected during the height of risk-off selling on the back of the global pandemic, but the speculative silver market did far worse.
One of the signs that the upside explosion in the ratio and downside implosion in silver would not last came from the open interest data.
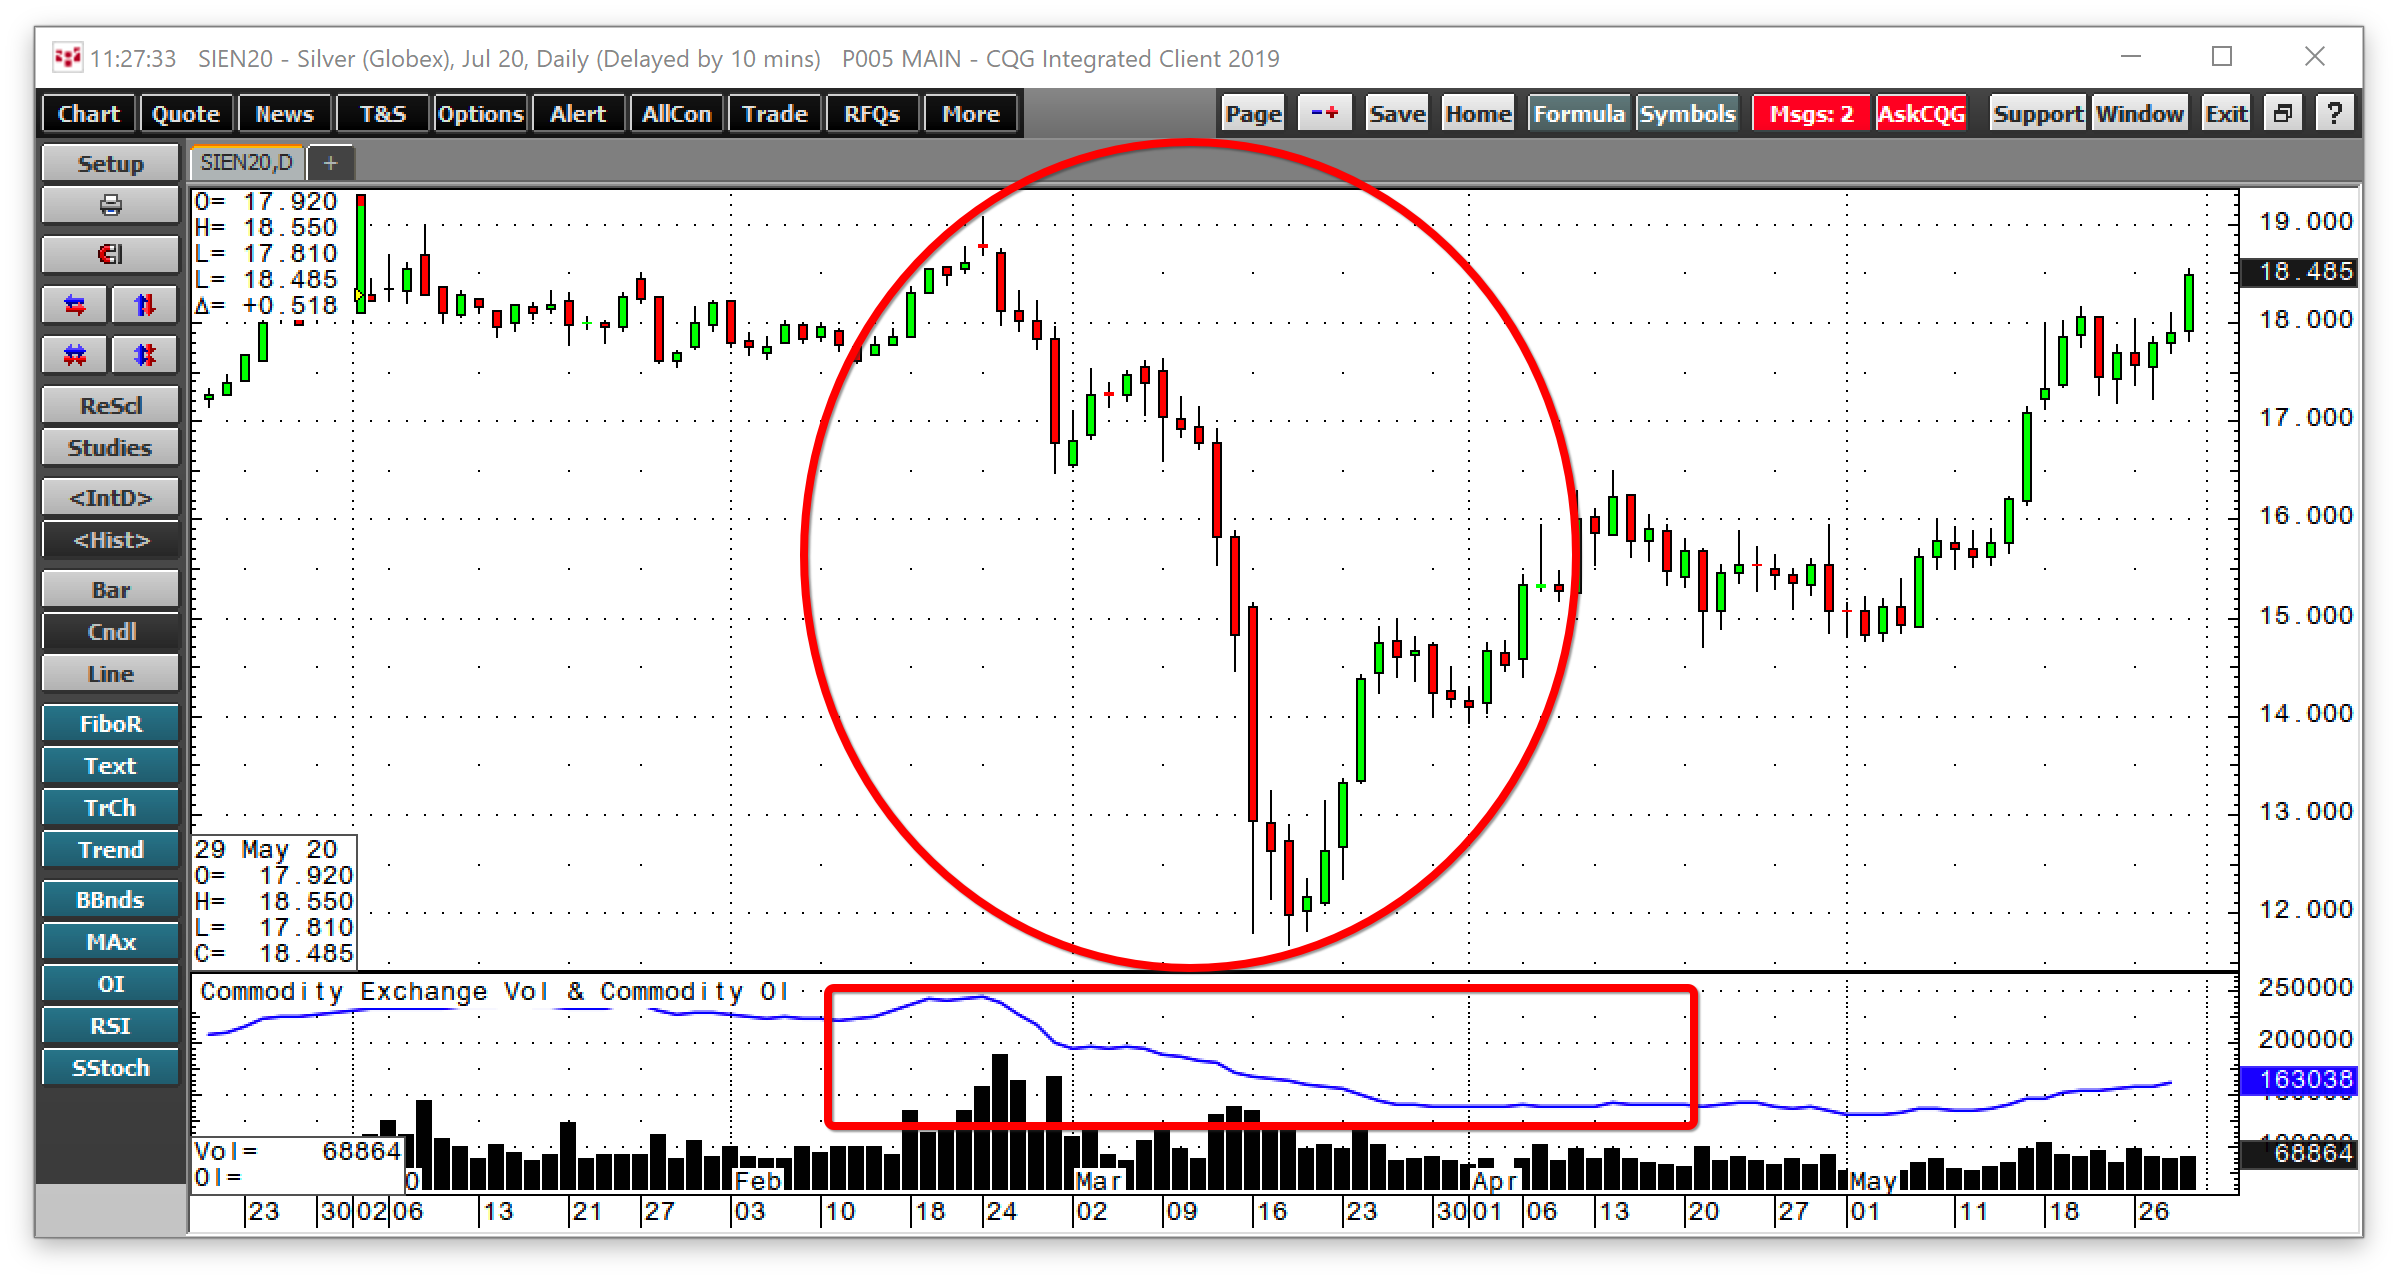
The chart shows that July silver futures fell from $19.075 on February 24 to a low of $11.68 on March 18 or 38.8%. At the same time, the open interest metric fell from 244,750 contracts, a record high, to 164,039 contracts on March 18 or 33%. Market participants scrambled to exit risk positions in the silver market as the price tanked. At the end of May, the metric was at 163,038 contracts, slightly lower than the mid-March low. However, the silver price made a stunning reversal and was trading around the $18.50 per ounce level at the end of May.
The relationship between silver and gold turned lower
Both silver and gold prices moved higher since the mid-March price carnage in the market, but silver has outperformed the yellow metal.
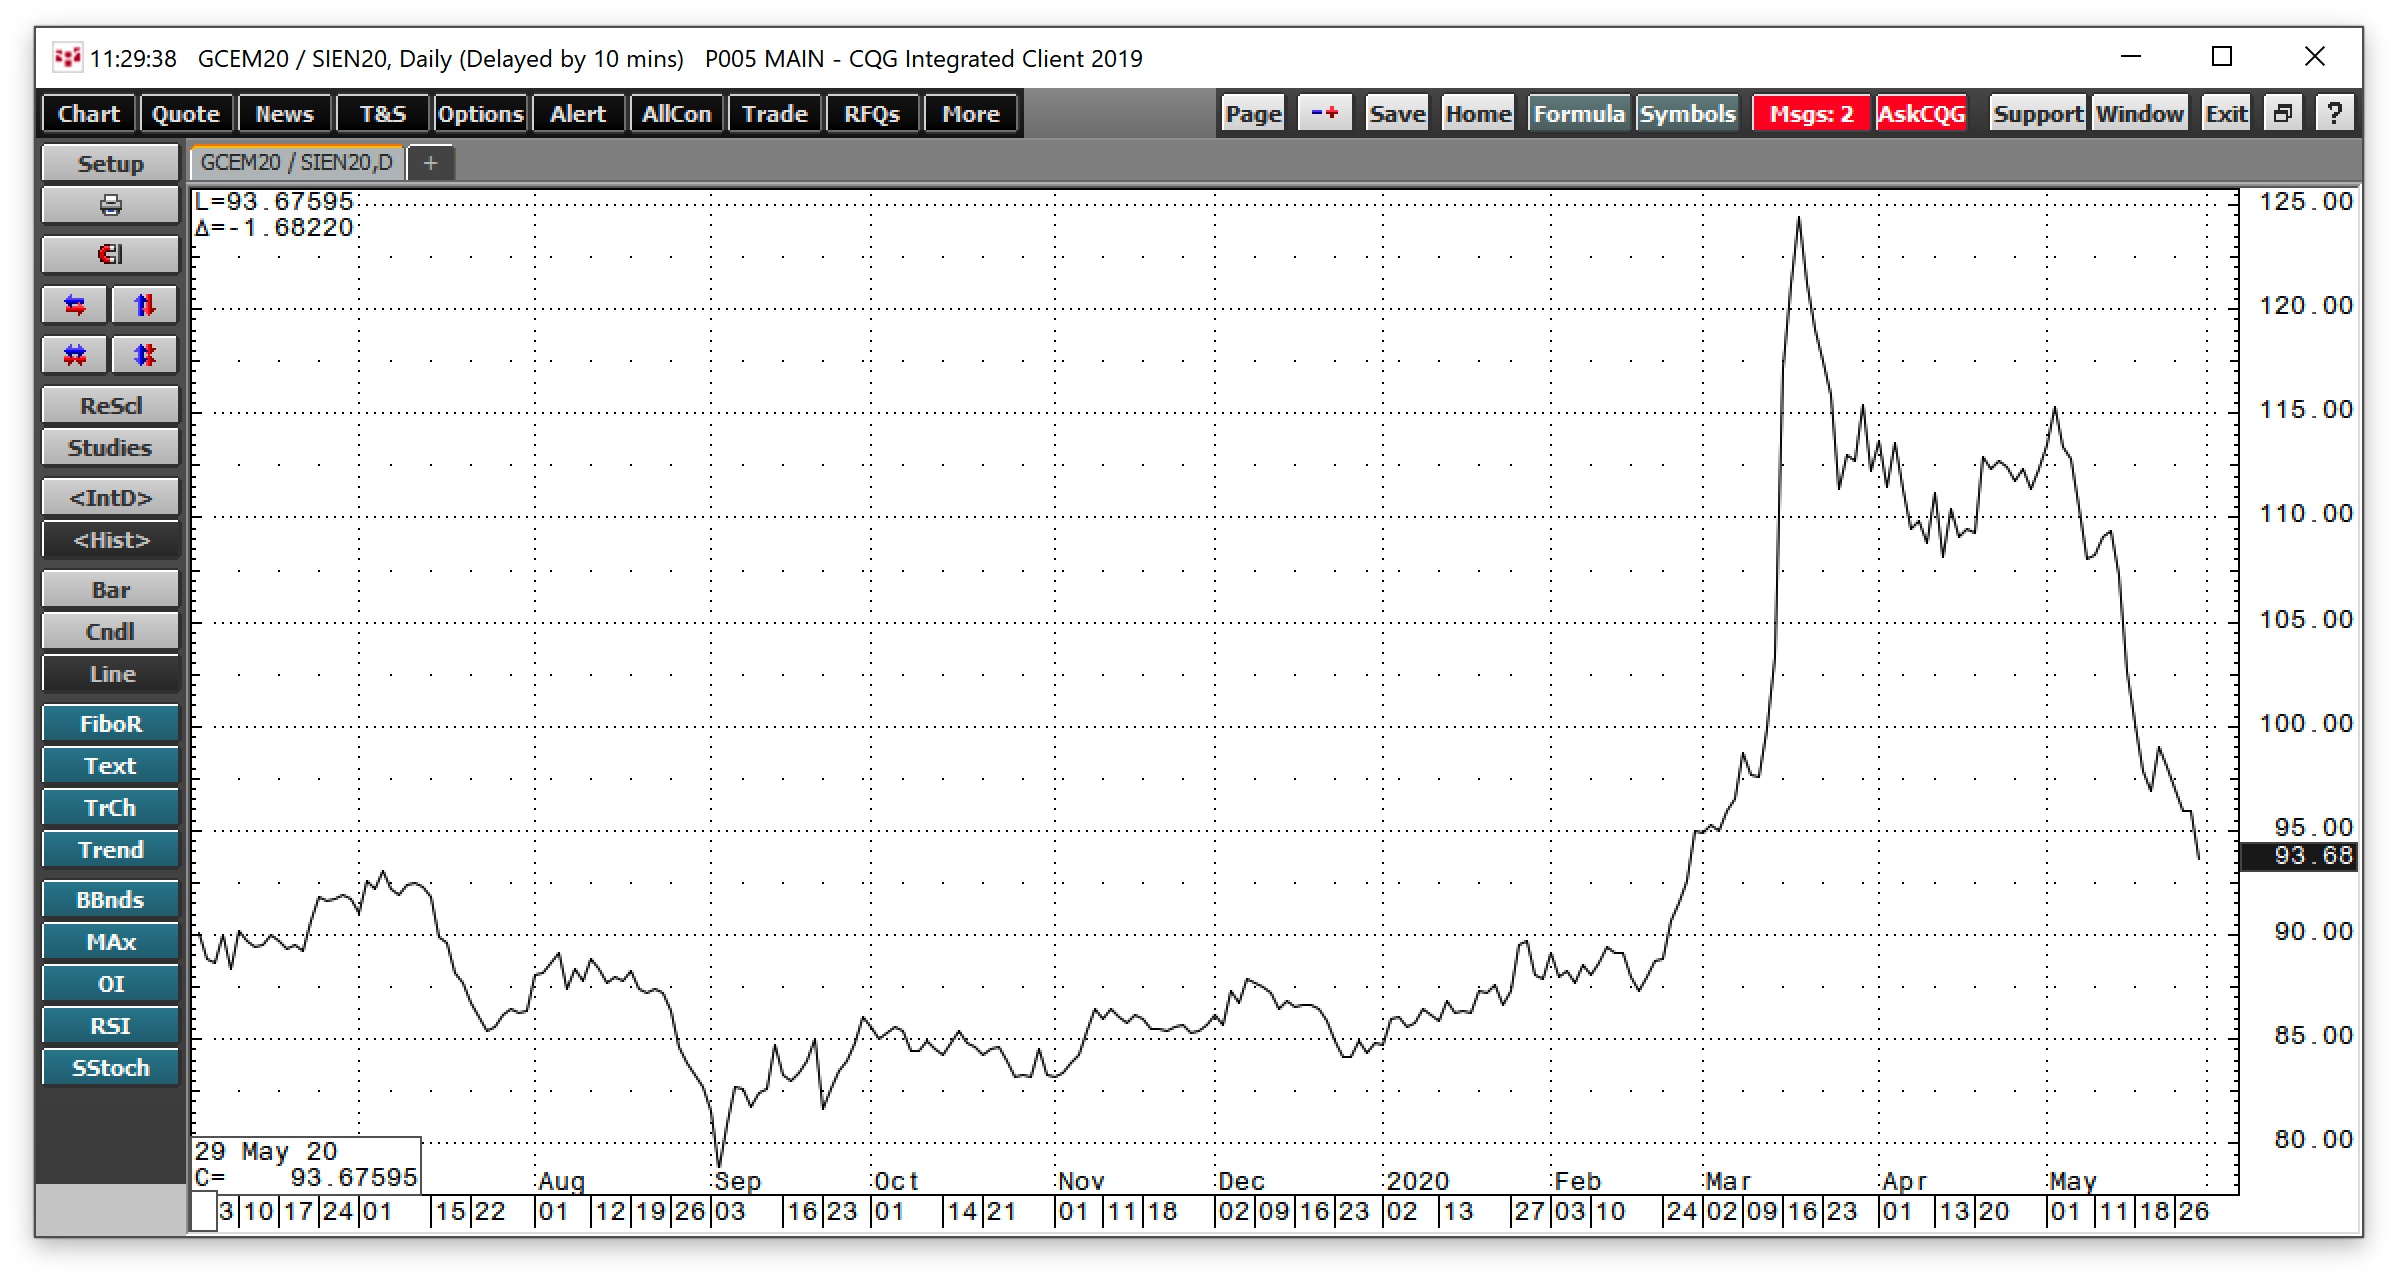
At the end of May, the ratio was below the 94:1 level, and the trend was lower in the relationship between silver and gold.
Memories of 2008-2011
At the beginning of the 2008 financial crisis, the risk-off selling took both gold and silver prices significantly lower. Gold dropped from a high of $1033.90 to a low of $681 or 34.1% in 2008. Silver did even worse, as the price carnage took the volatile metal from $21.185 to $8.40 or over 60% lower the same year.
The selling at the start of the 2008 crisis set the stage for an explosive rally in both metals. From July through September 2008, the US Treasury borrowed a record $530 billion to fund the stimulus. The waves of liquidity fueled a sector-wide rally in commodities as it weighed on the purchasing power of fiat currencies. Moreover, the low prices in 2008 caused production to decline for a host of raw materials, exacerbating the rally that followed.
In May 2020, the US Treasury borrowed $3 trillion, five times as much as in 2008. The waves of liquidity in 2008 became a tidal wave in 2020. The silver market could be telling us that we are on the verge of a spectacular move higher in the precious metals as well as most other raw material markets.
The potential of a launchpad for the coming months and years
If history repeats, and it tends to rhyme over time, the price action from 2008 through 2011 could be a harbinger for the months and years ahead.
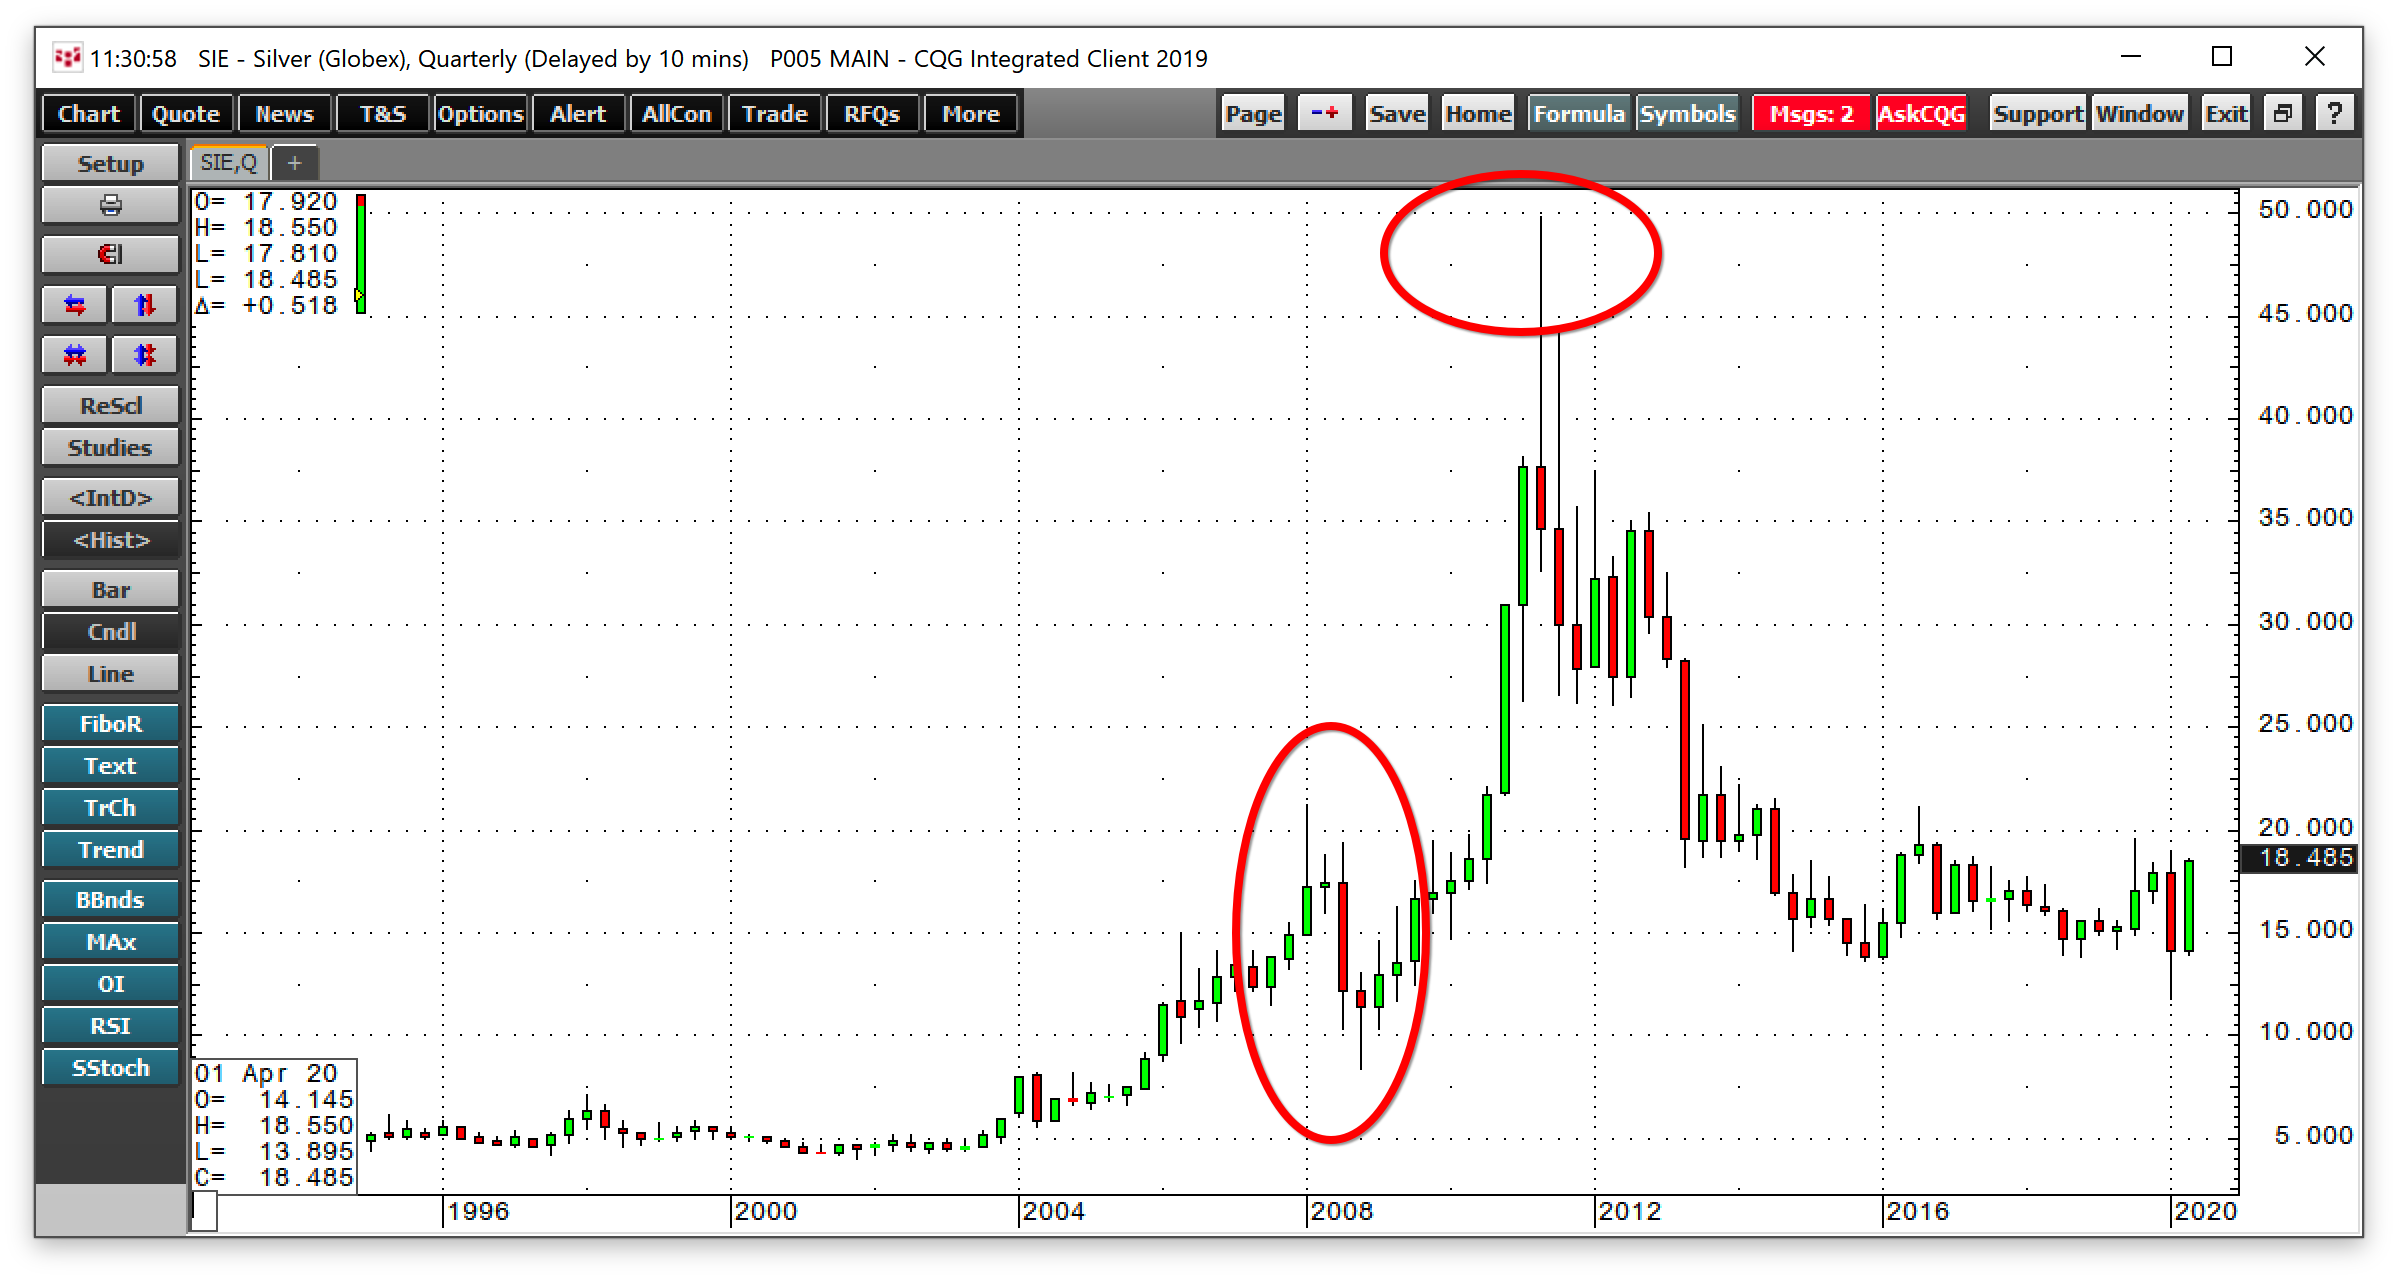
The decline of 60% in 2008 led to a move that took silver over 5.9 times higher in 2011 when the price peaked at $49.82 per ounce.
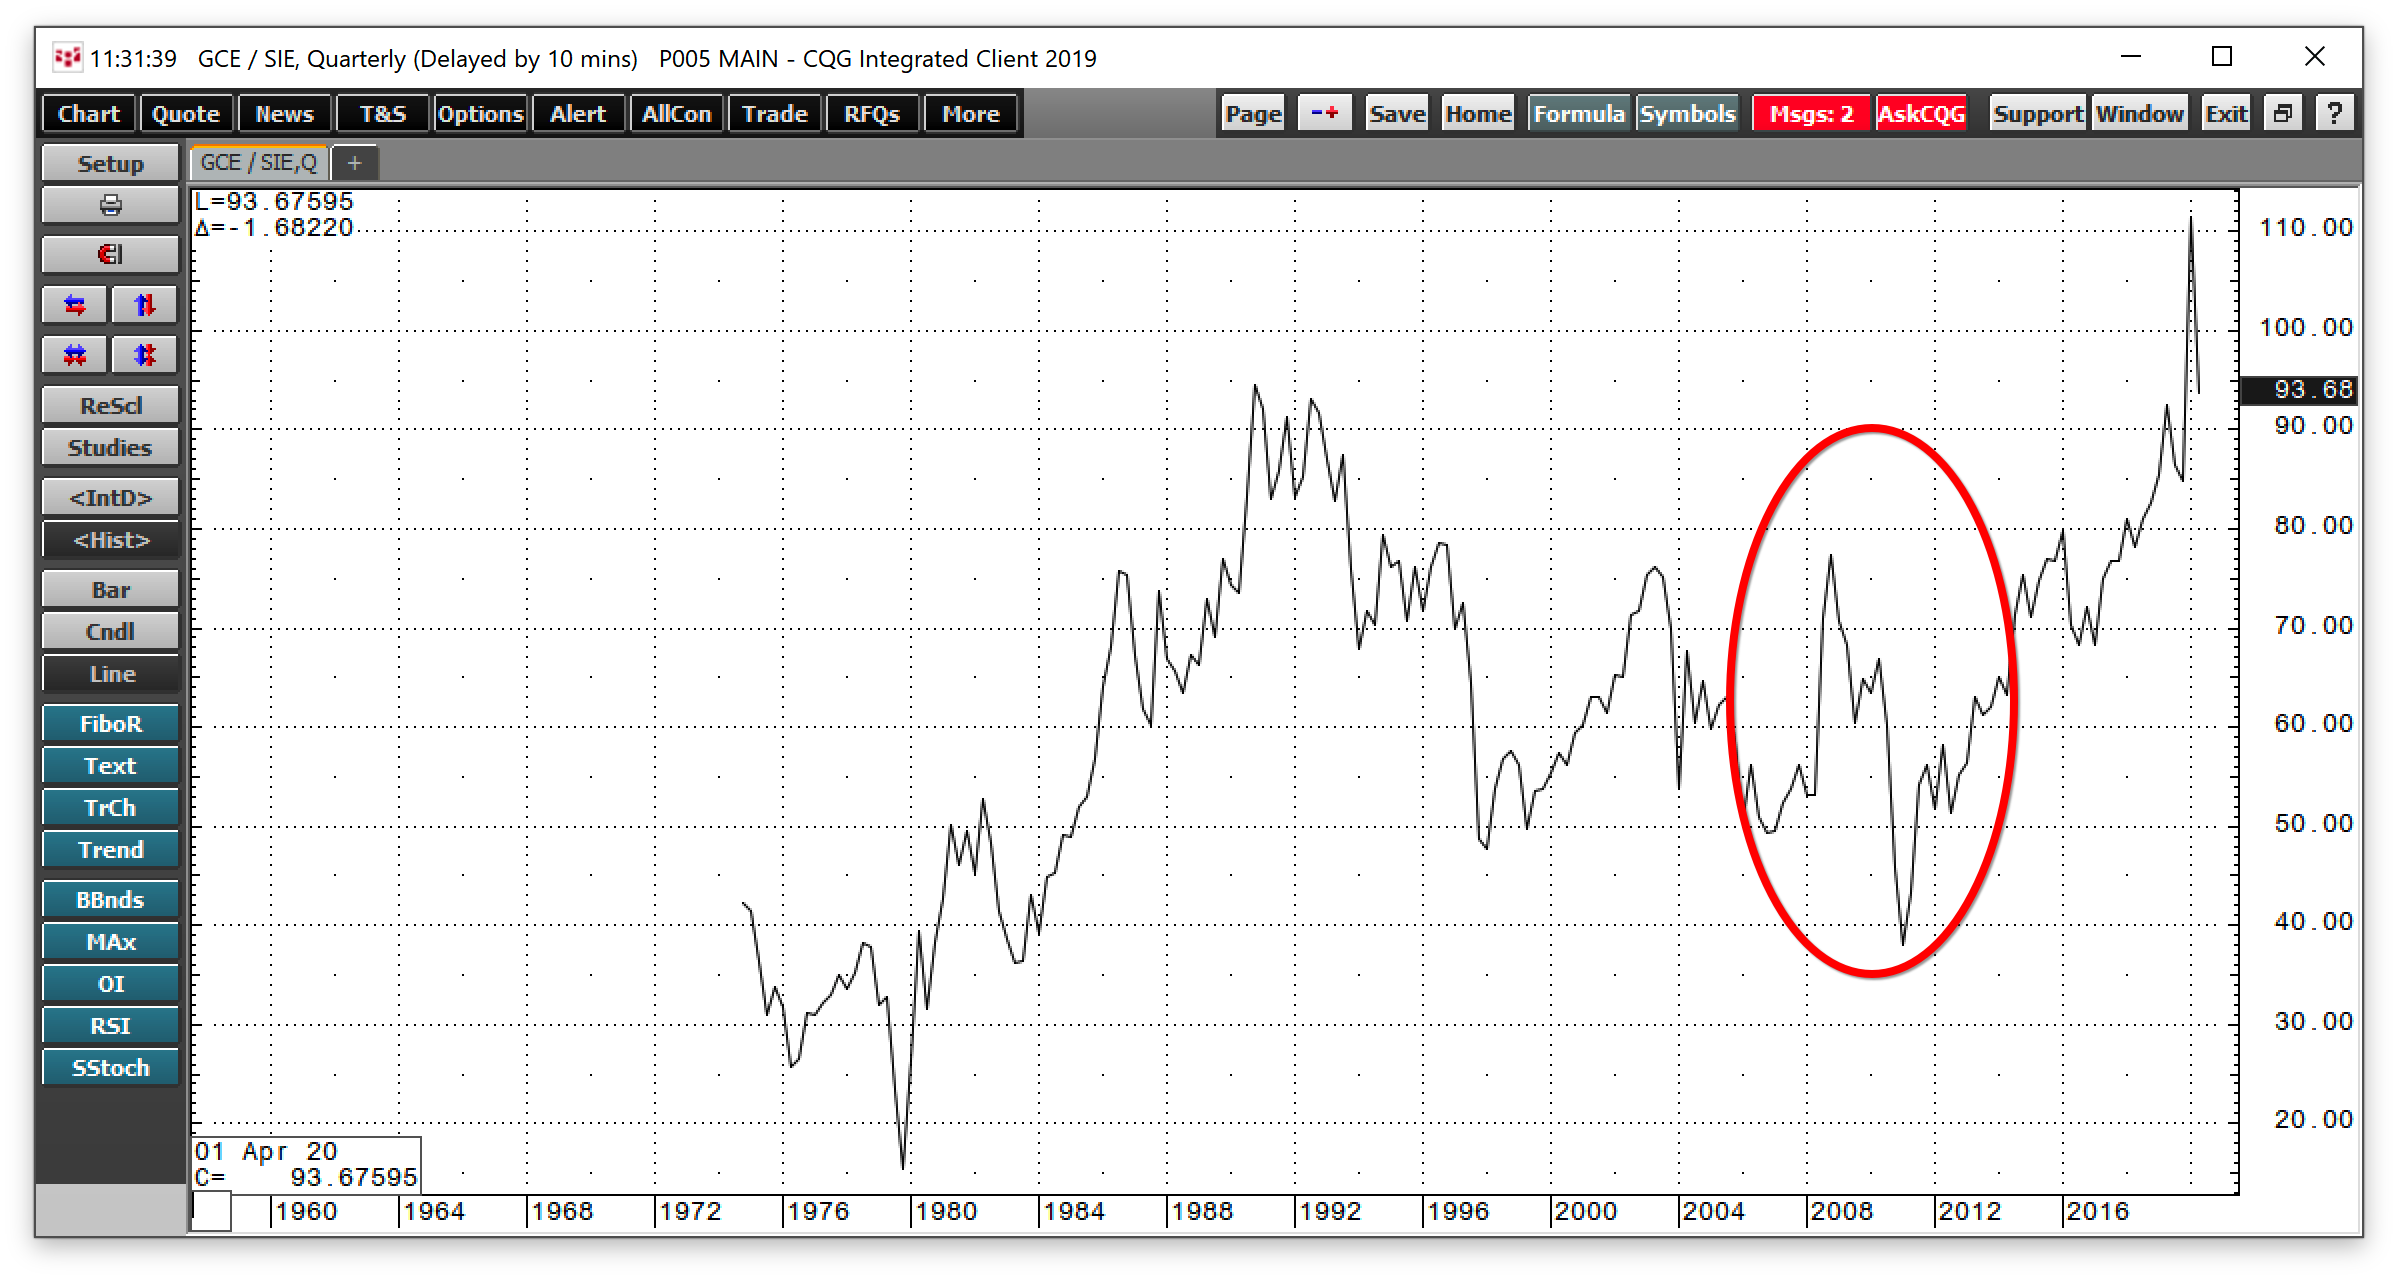
In 2008, the silver-gold ratio rose to a high of 77.40:1 when risk-off conditions hit the precious metals market. In 2011, the relationship fell to a low of 38:1.
The stimulus that has provided stability to markets comes at a price. The turn to the downside in the silver-gold ratio since March could be the start of a wild ride to the upside in the precious metals sector. Fasten your seatbelts.