On April 20, 2020, nearby NYMEX futures did what few market participants believed possible. Not only did the price of a barrel of West Texas Intermediate drop below zero during the delivery period, but it also fell to a low of negative $40.32. Expiring WTI futures became a bearish hot potato as holders of the contracts had nowhere to store the landlocked petroleum. Brent futures did not suffer the same fate as they reflect the price of seaborne crude oil, but they did drop to the lowest price of this century at the $16 per barrel level.
Since the April 2020 low, the prices have made higher lows and higher highs. At the beginning of June, NYMEX futures rose to the highest price since 2018 as they head towards a test of $70 per barrel on the July contract. August Brent futures were already north of $70.
The last time crude oil prices were over $100 per barrel was back in 2014. Analysts at Goldman Sachs are calling for $80 per barrel crude oil, but it is not unrealistic for the energy commodity to move towards the $100 level in the current environment.
The bullish action in commodities continued in May
May was another month of new multi-year and all-time highs in some commodities that trade on the futures exchange. The most significant rally came in the copper market, which rose above its 2011 peak at $4.6495 per pound.
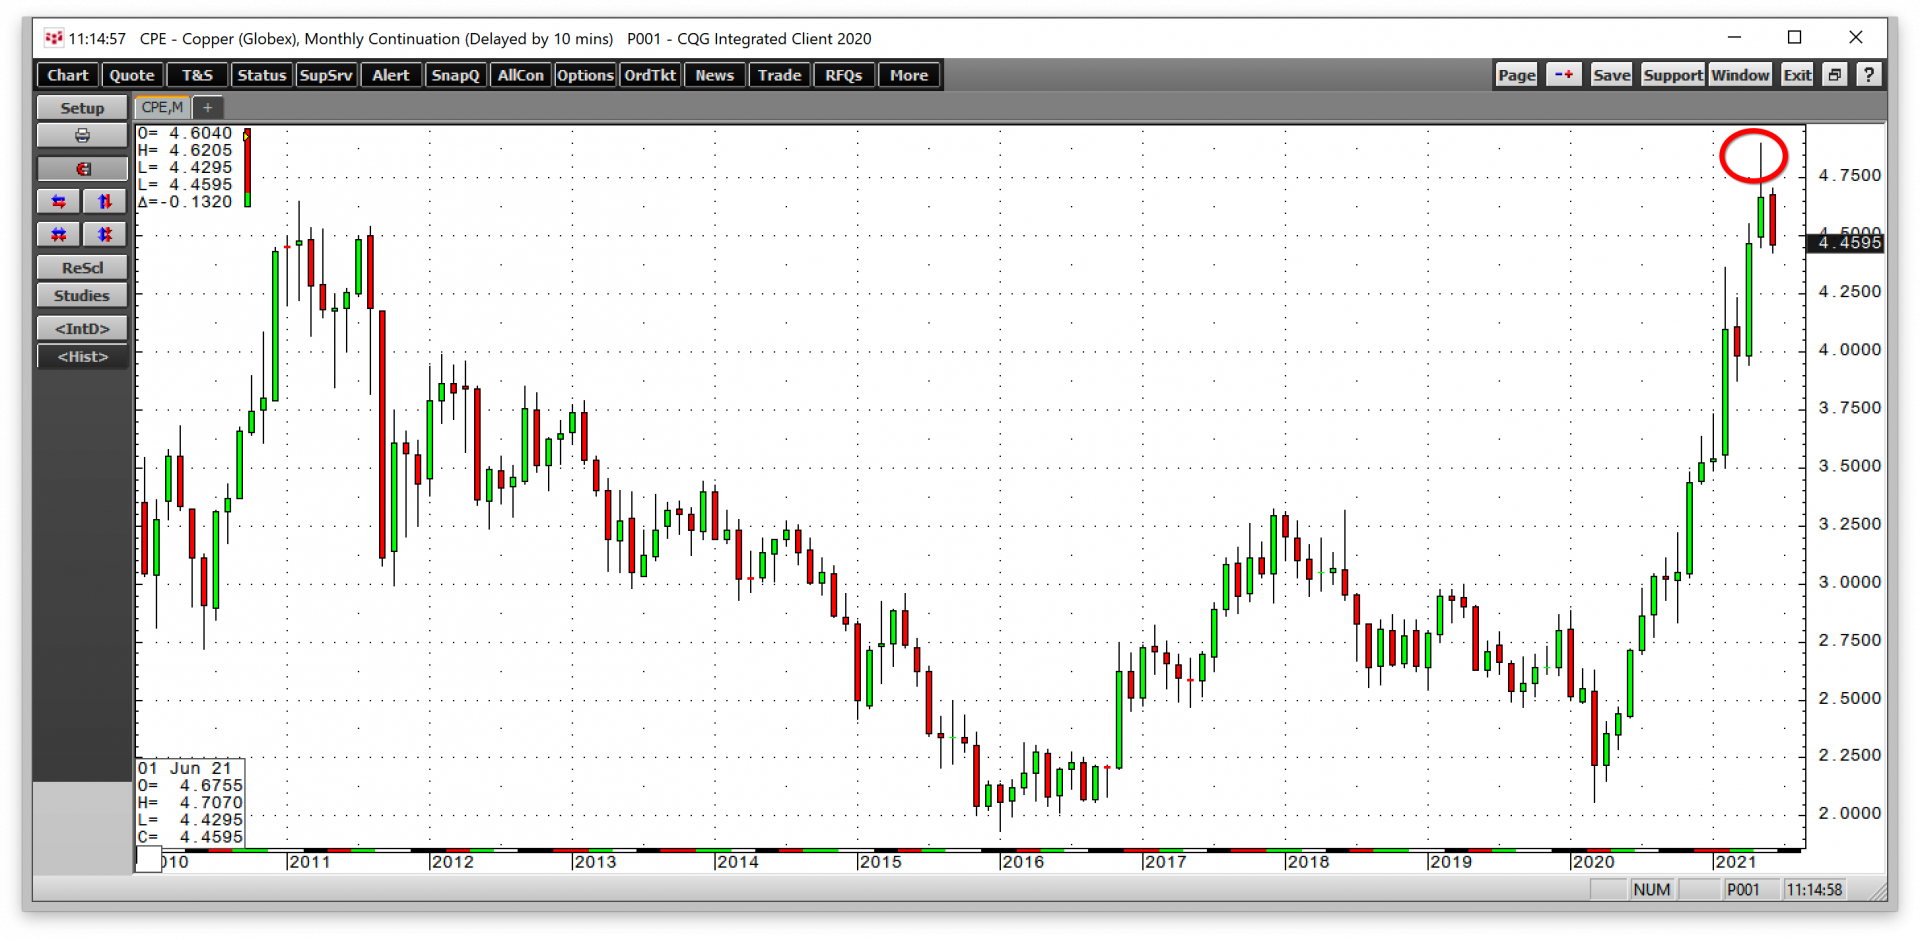
The monthly chart shows that nearby COMEX copper futures rose to a high of $4.8985 last month, a new record high.
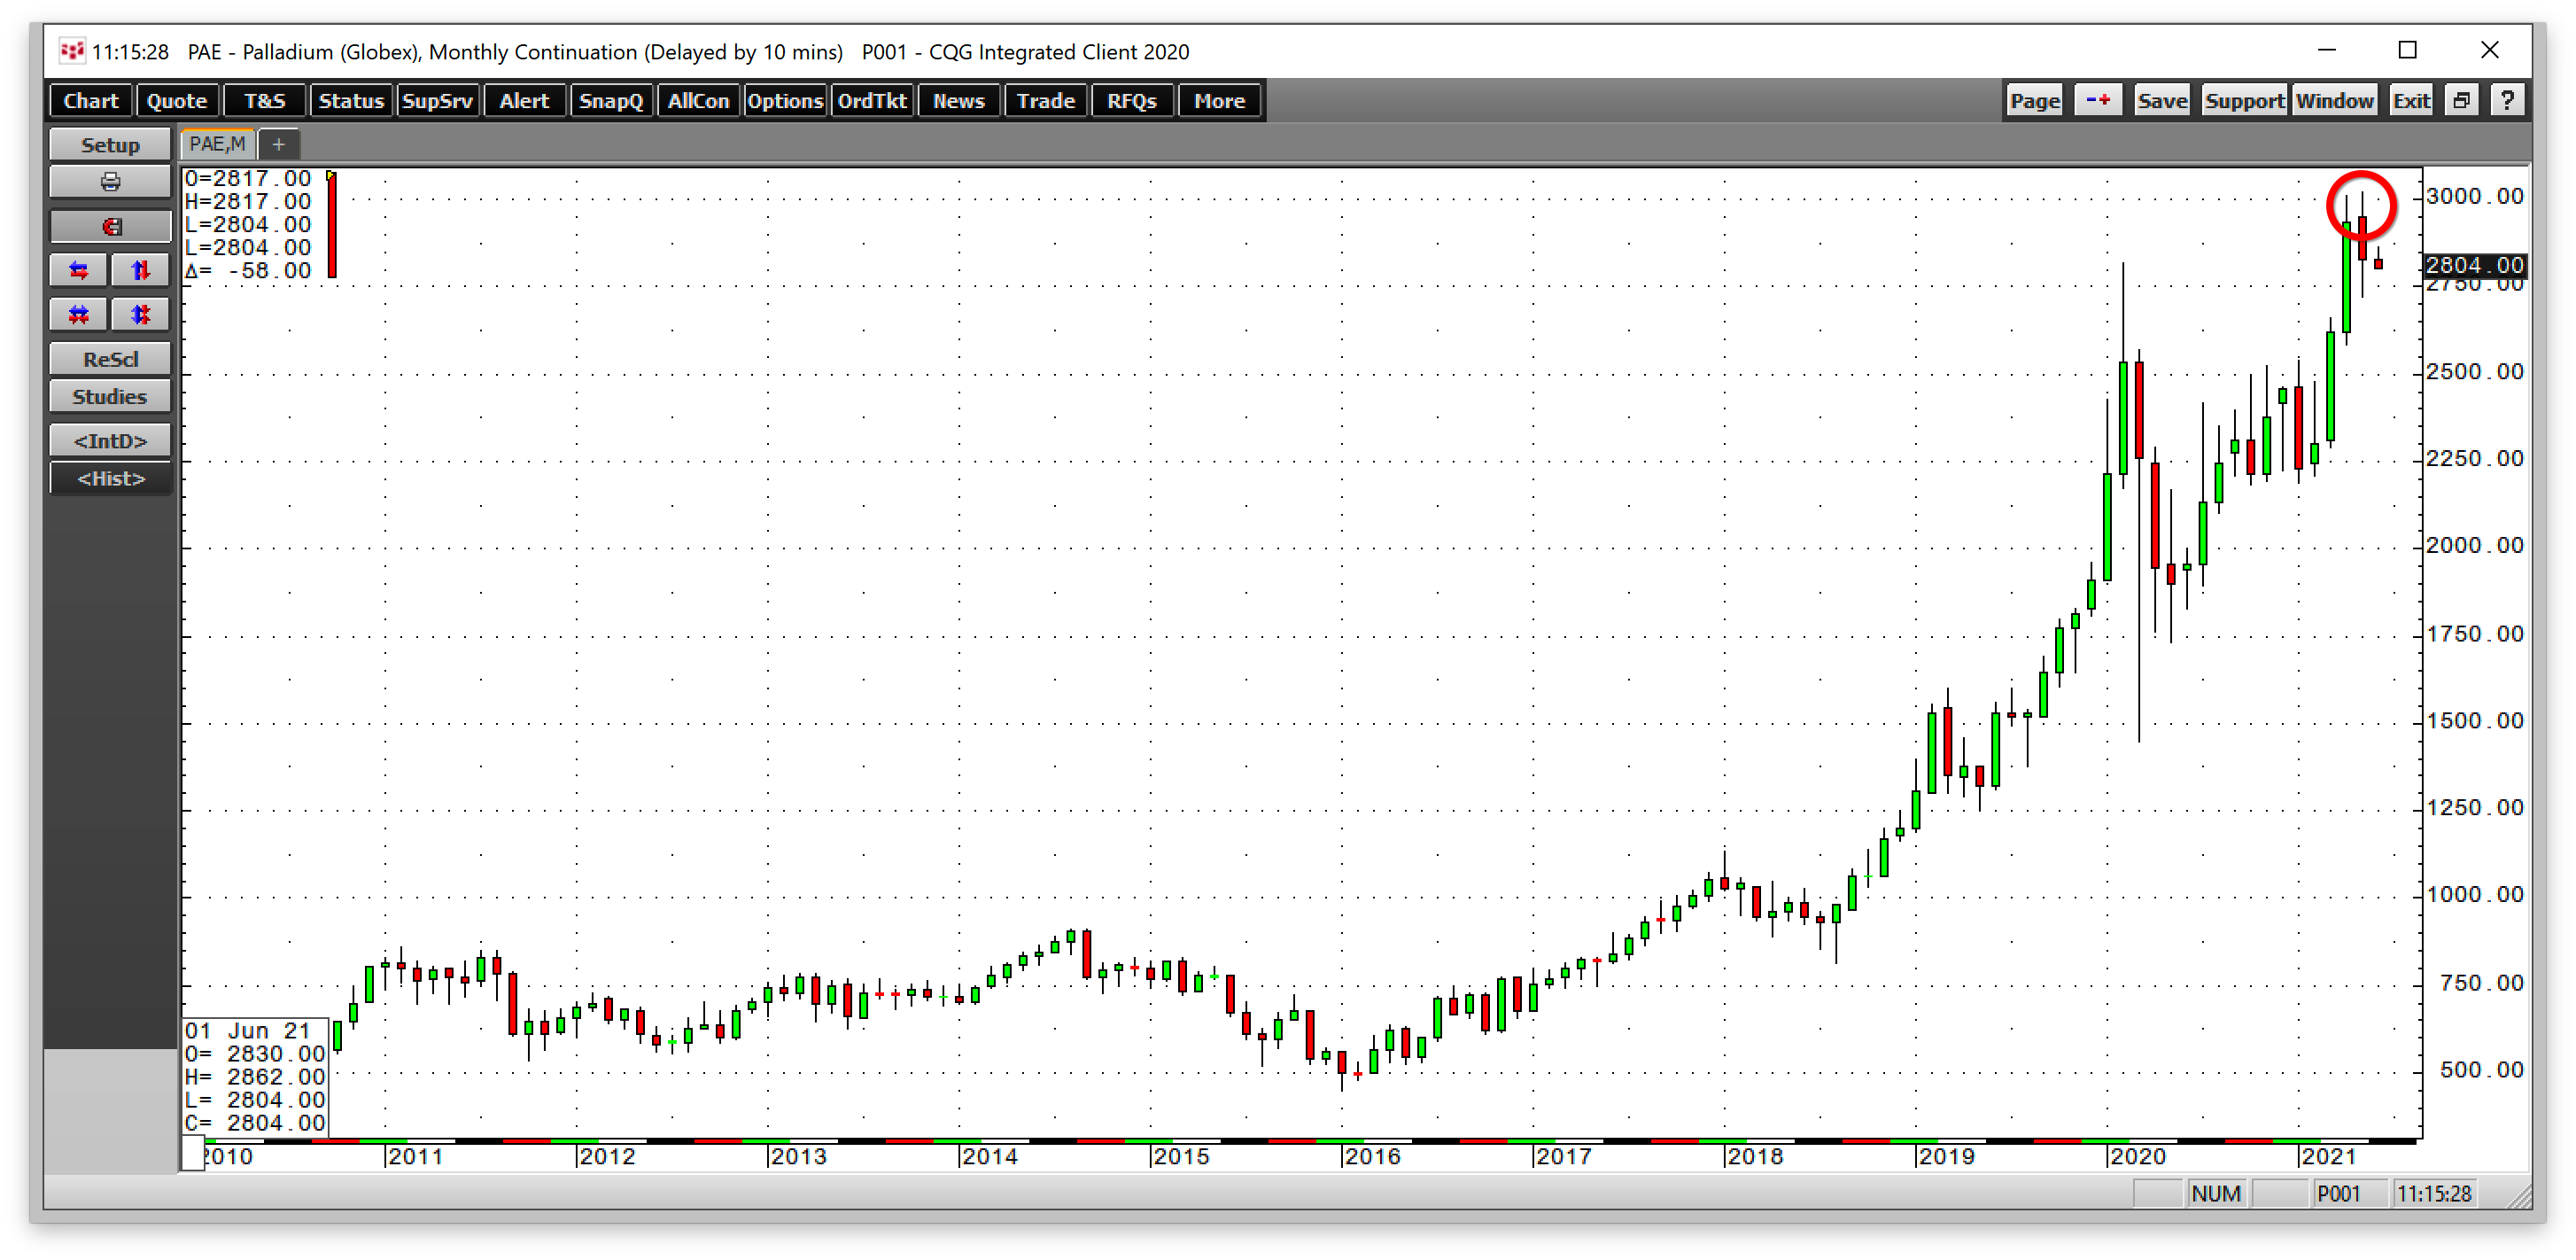
May brought another in a series of record highs in the palladium market as the price hit $3019 per ounce on the nearby NYMEX futures contract.
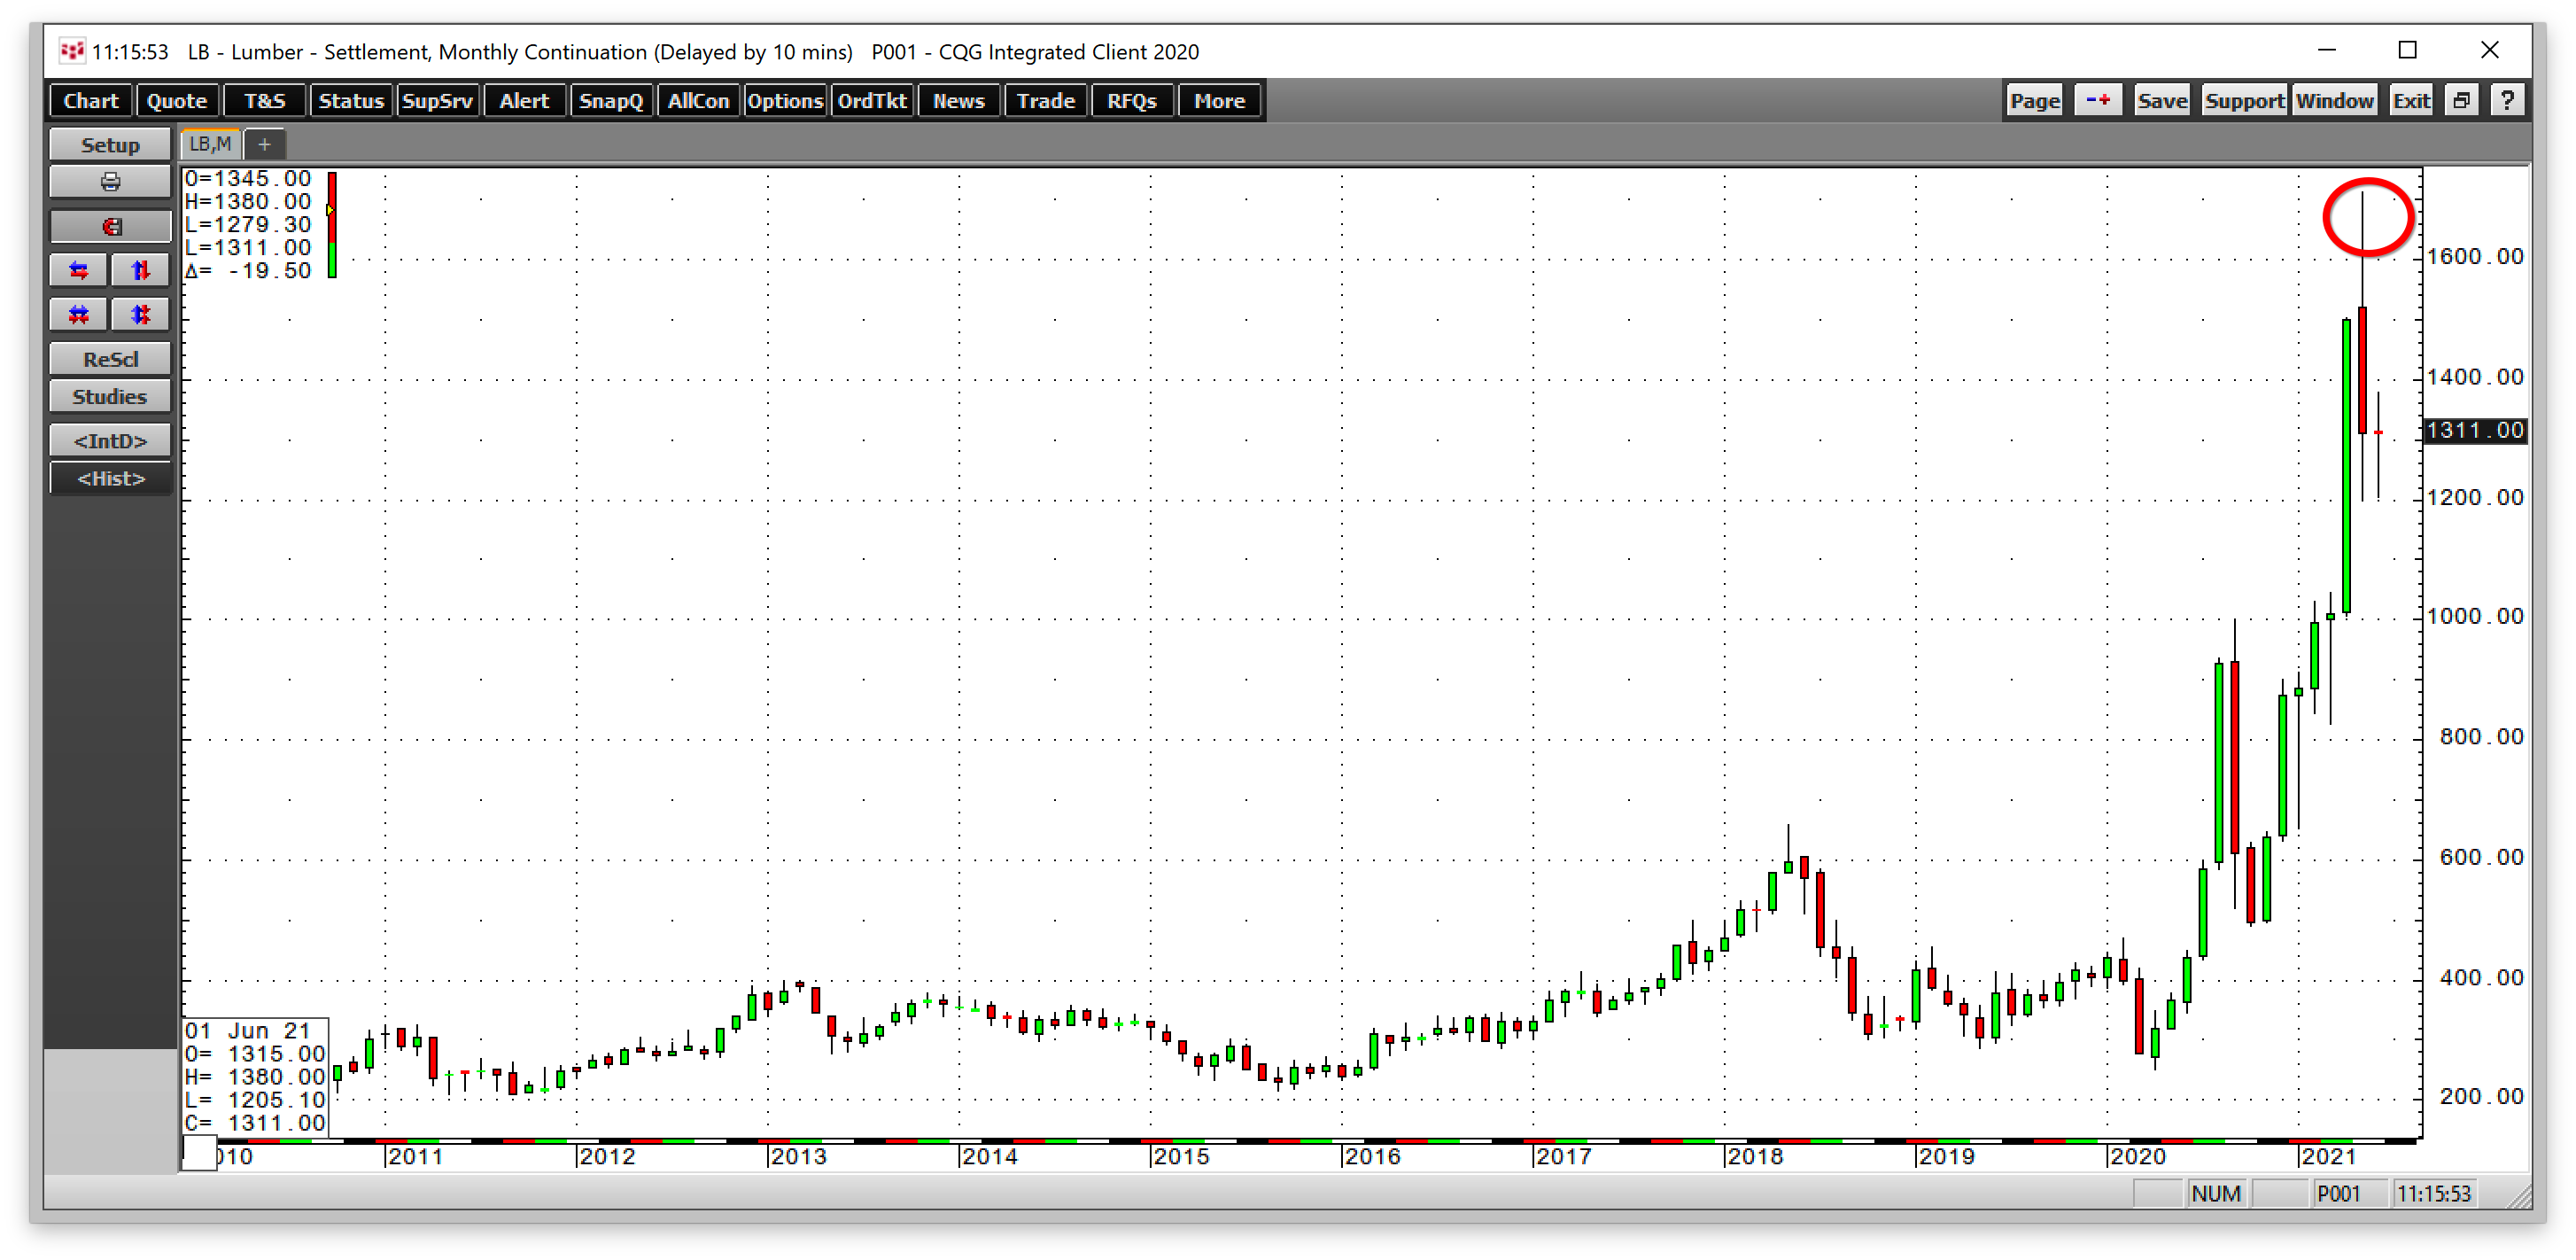
Lumber traded to a peak of $1711.20 per 1,000 board feet. Before 2018, the all-time high was at $483.50.
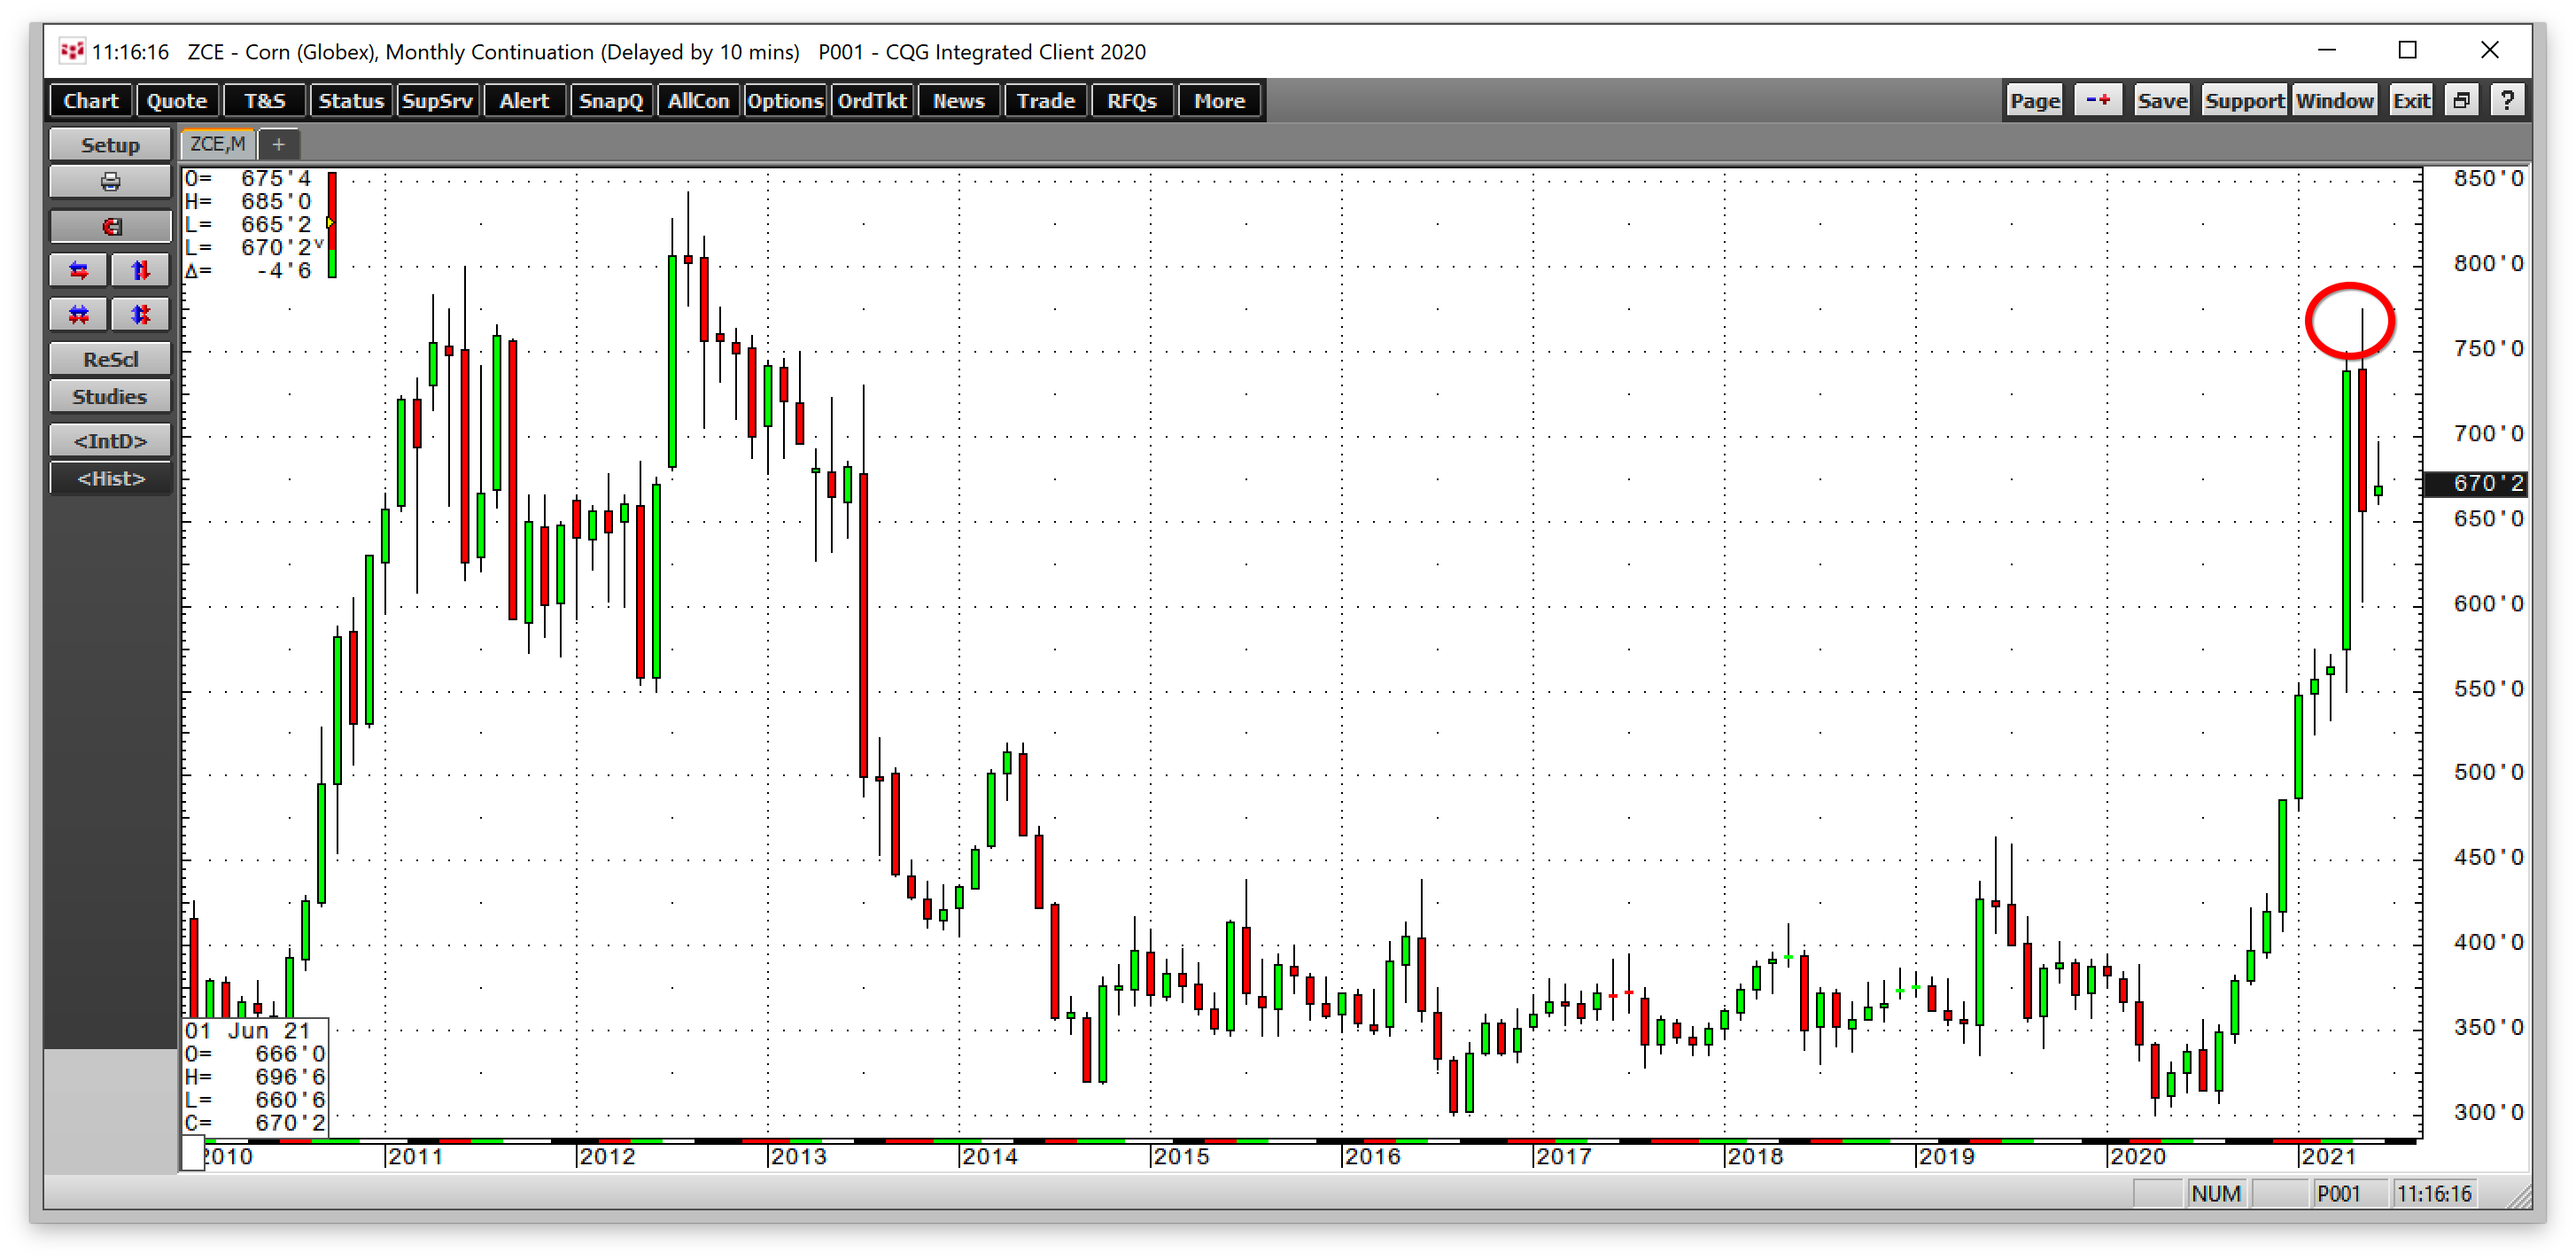
May was also a bullish month in the CBOT corn futures arena as nearby contract price reached $7.75 per bushel.
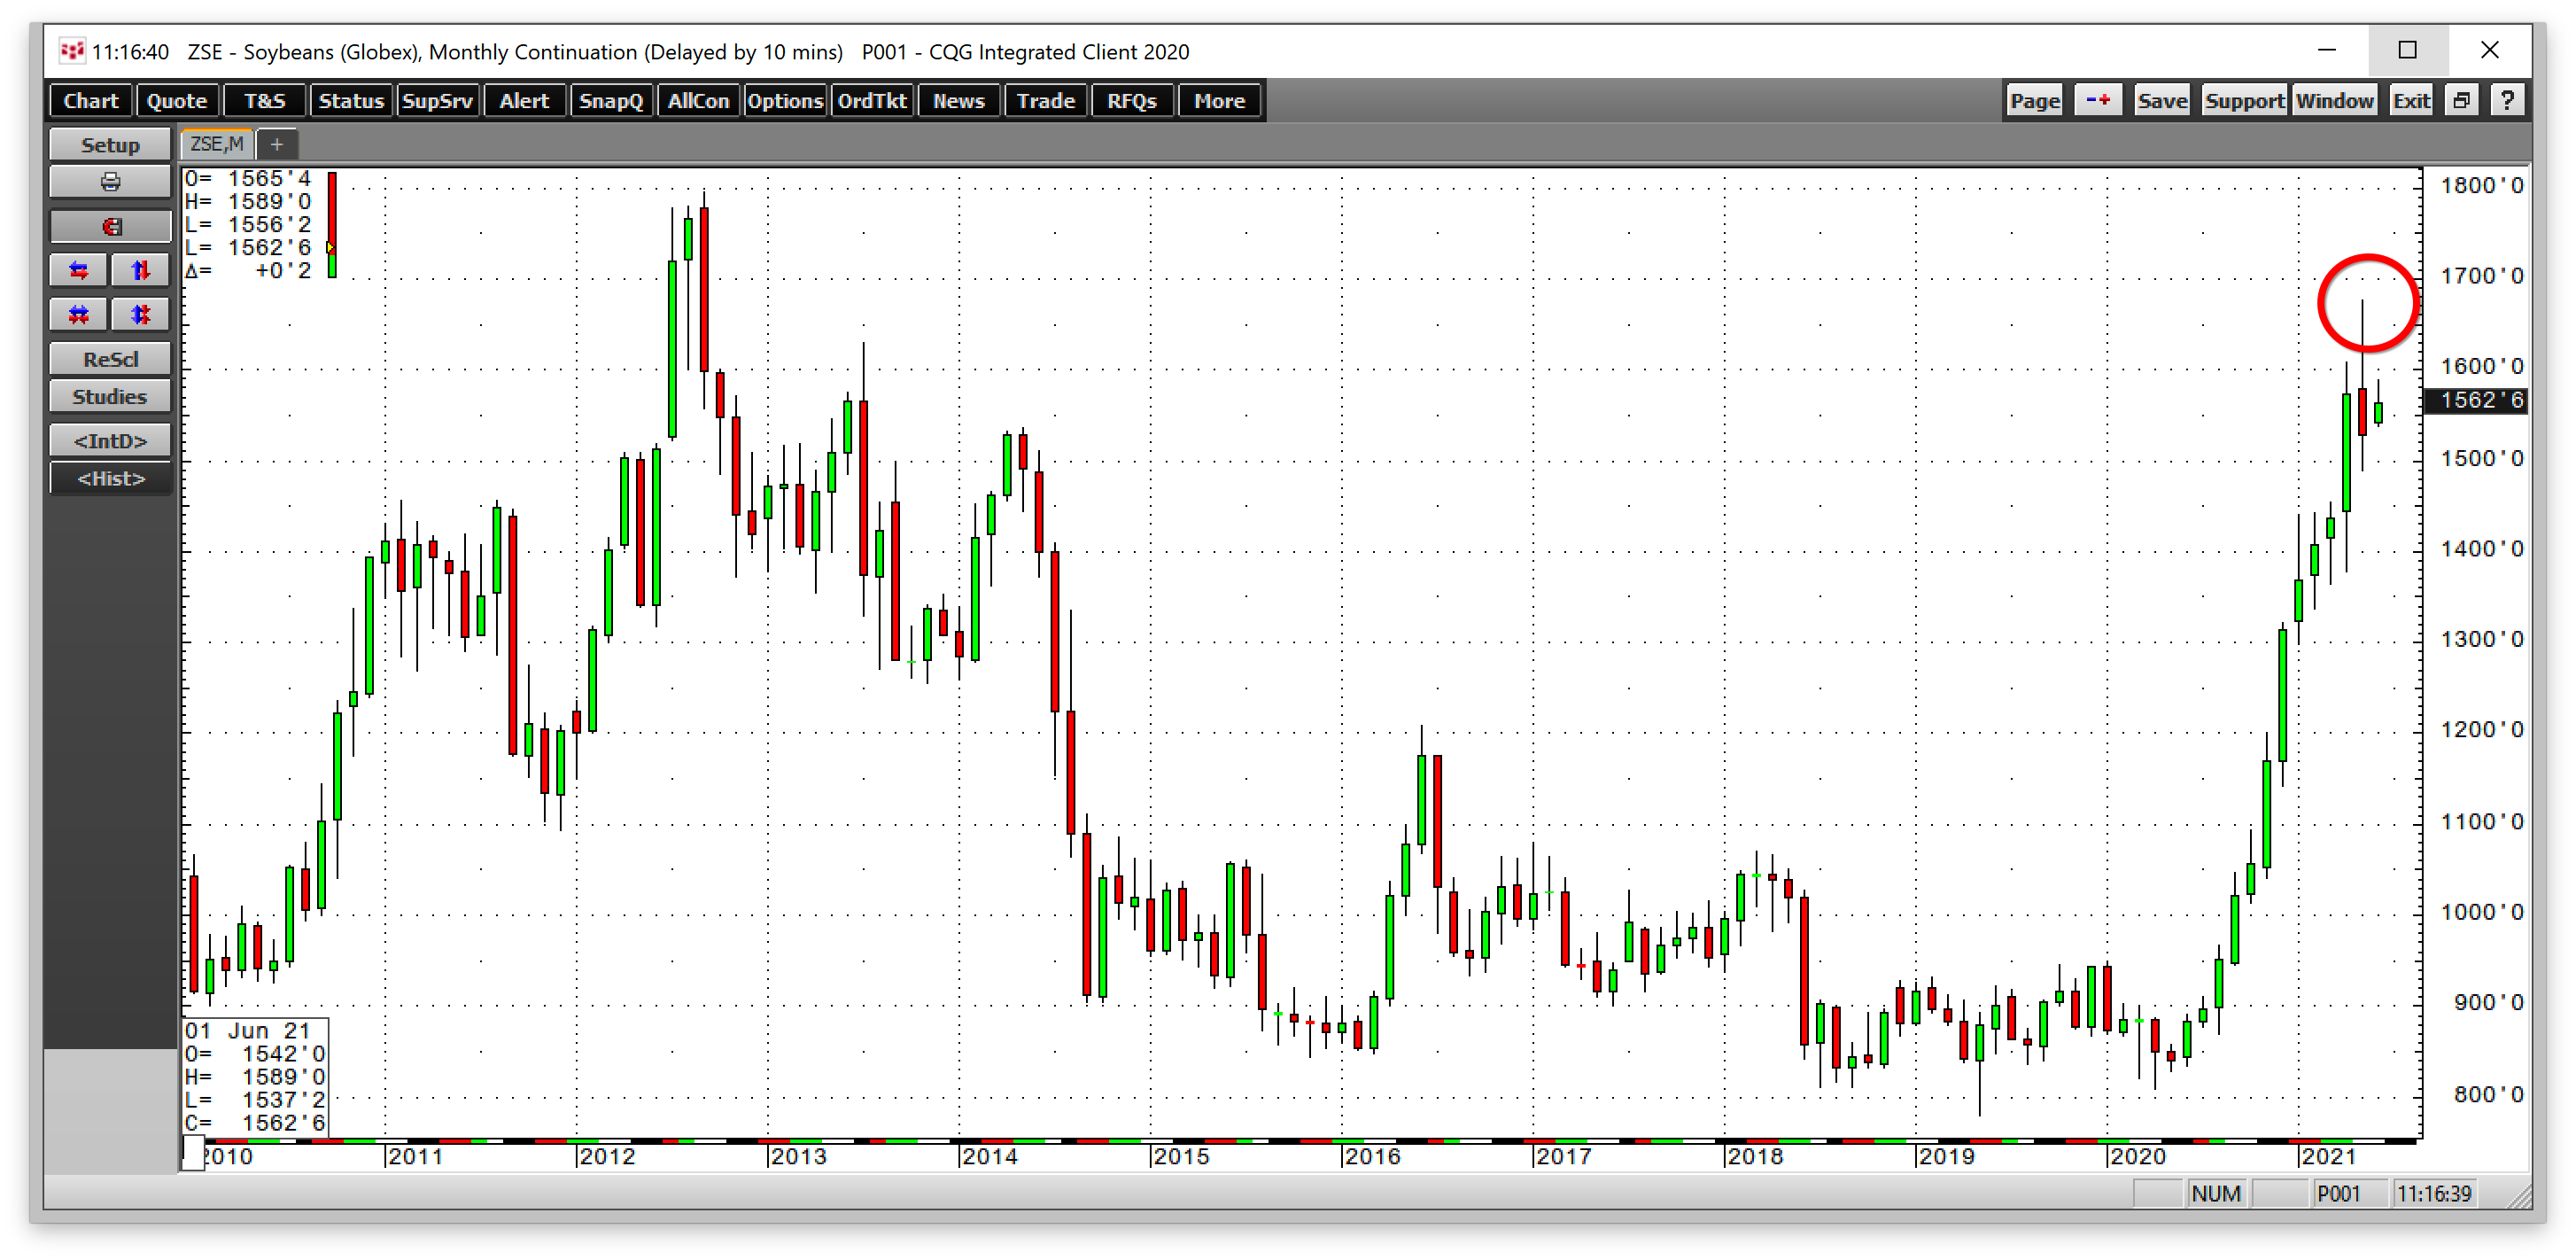
Soybeans hit $16.7725 per bushel. Many other commodity prices rallied last month as inflationary pressures continue to mount.
Crude oil has been rallying for over a year
Crude oil, the traditional energy commodity under siege in April 2020, has been moving steadily higher over the past year. After trading to a low of negative $40.32 on April 20, 2020, the price hit a new high of $69.40 on June 3, after closing May at the $66.63 level.
After a bull market correction took the price of July futures from $66.61 on March 8, 2021, the price fell to a low of $57.18 on March 23.
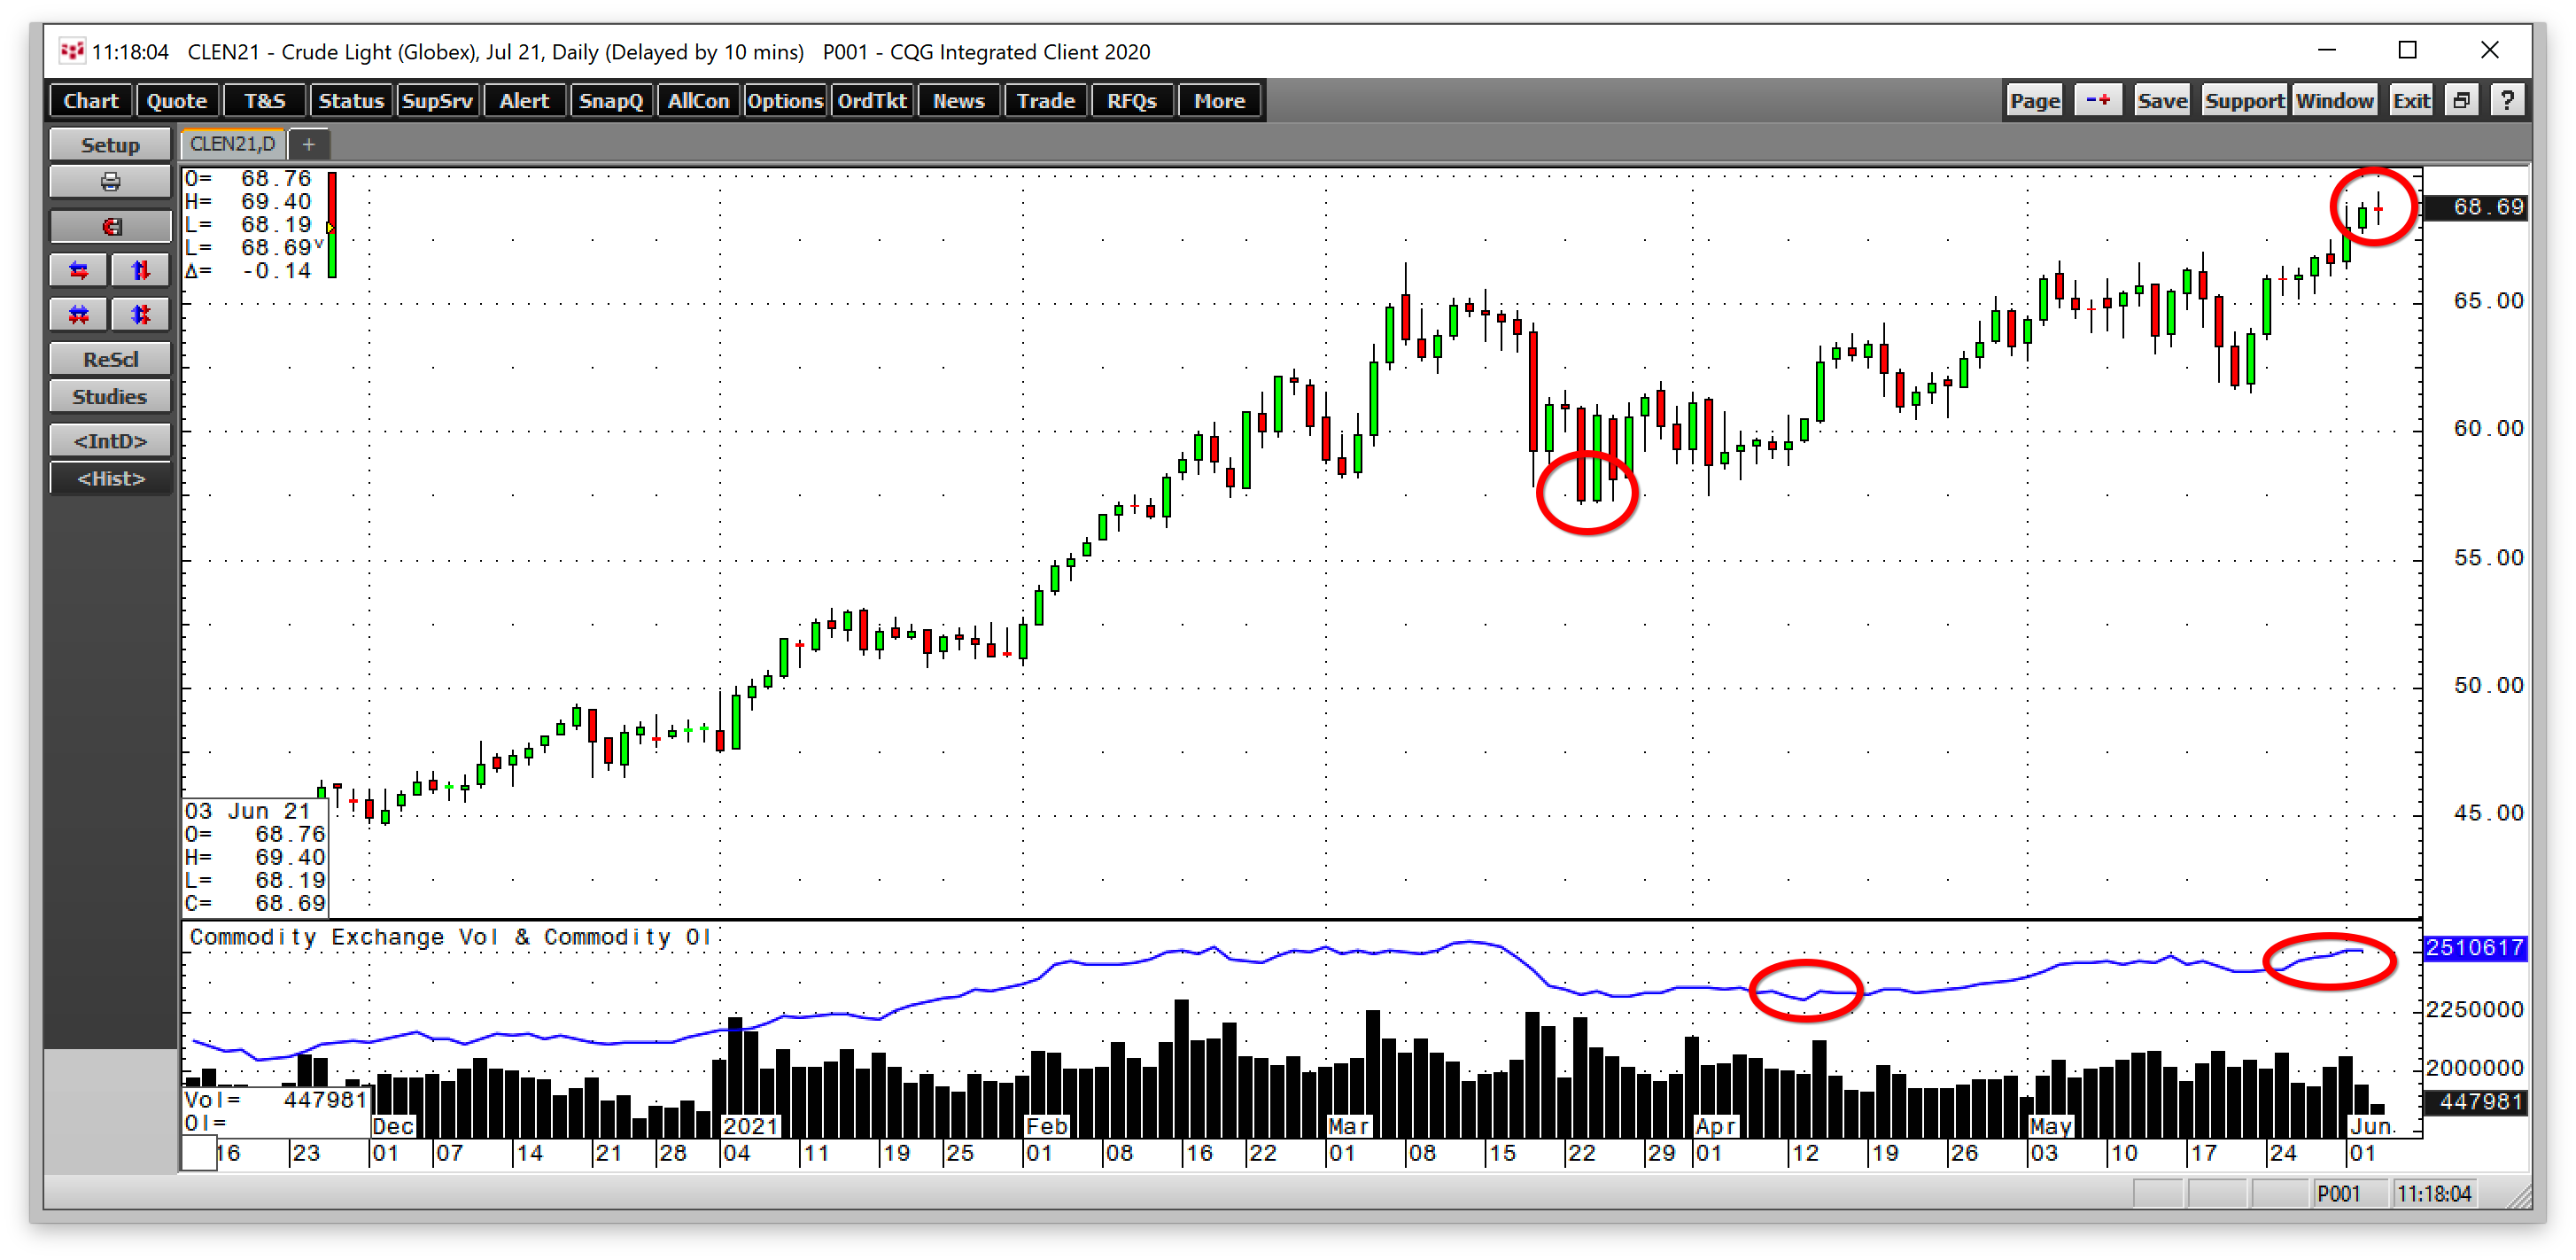
The daily chart shows that the total number of open long and short positions in the NYMEX crude oil futures market fell to a low of just over 2.3 million contracts after crude oil corrected. The metric stood at the 2.51 million contract level on June 2, with the price moving towards $70 per barrel. Increasing open interest and rising price is typically a validation of a bullish trend in a futures market.
NYMEX futures are at the highest price since 2018
NYMEX futures have already reached the highest price since 2018 at $69 per barrel.
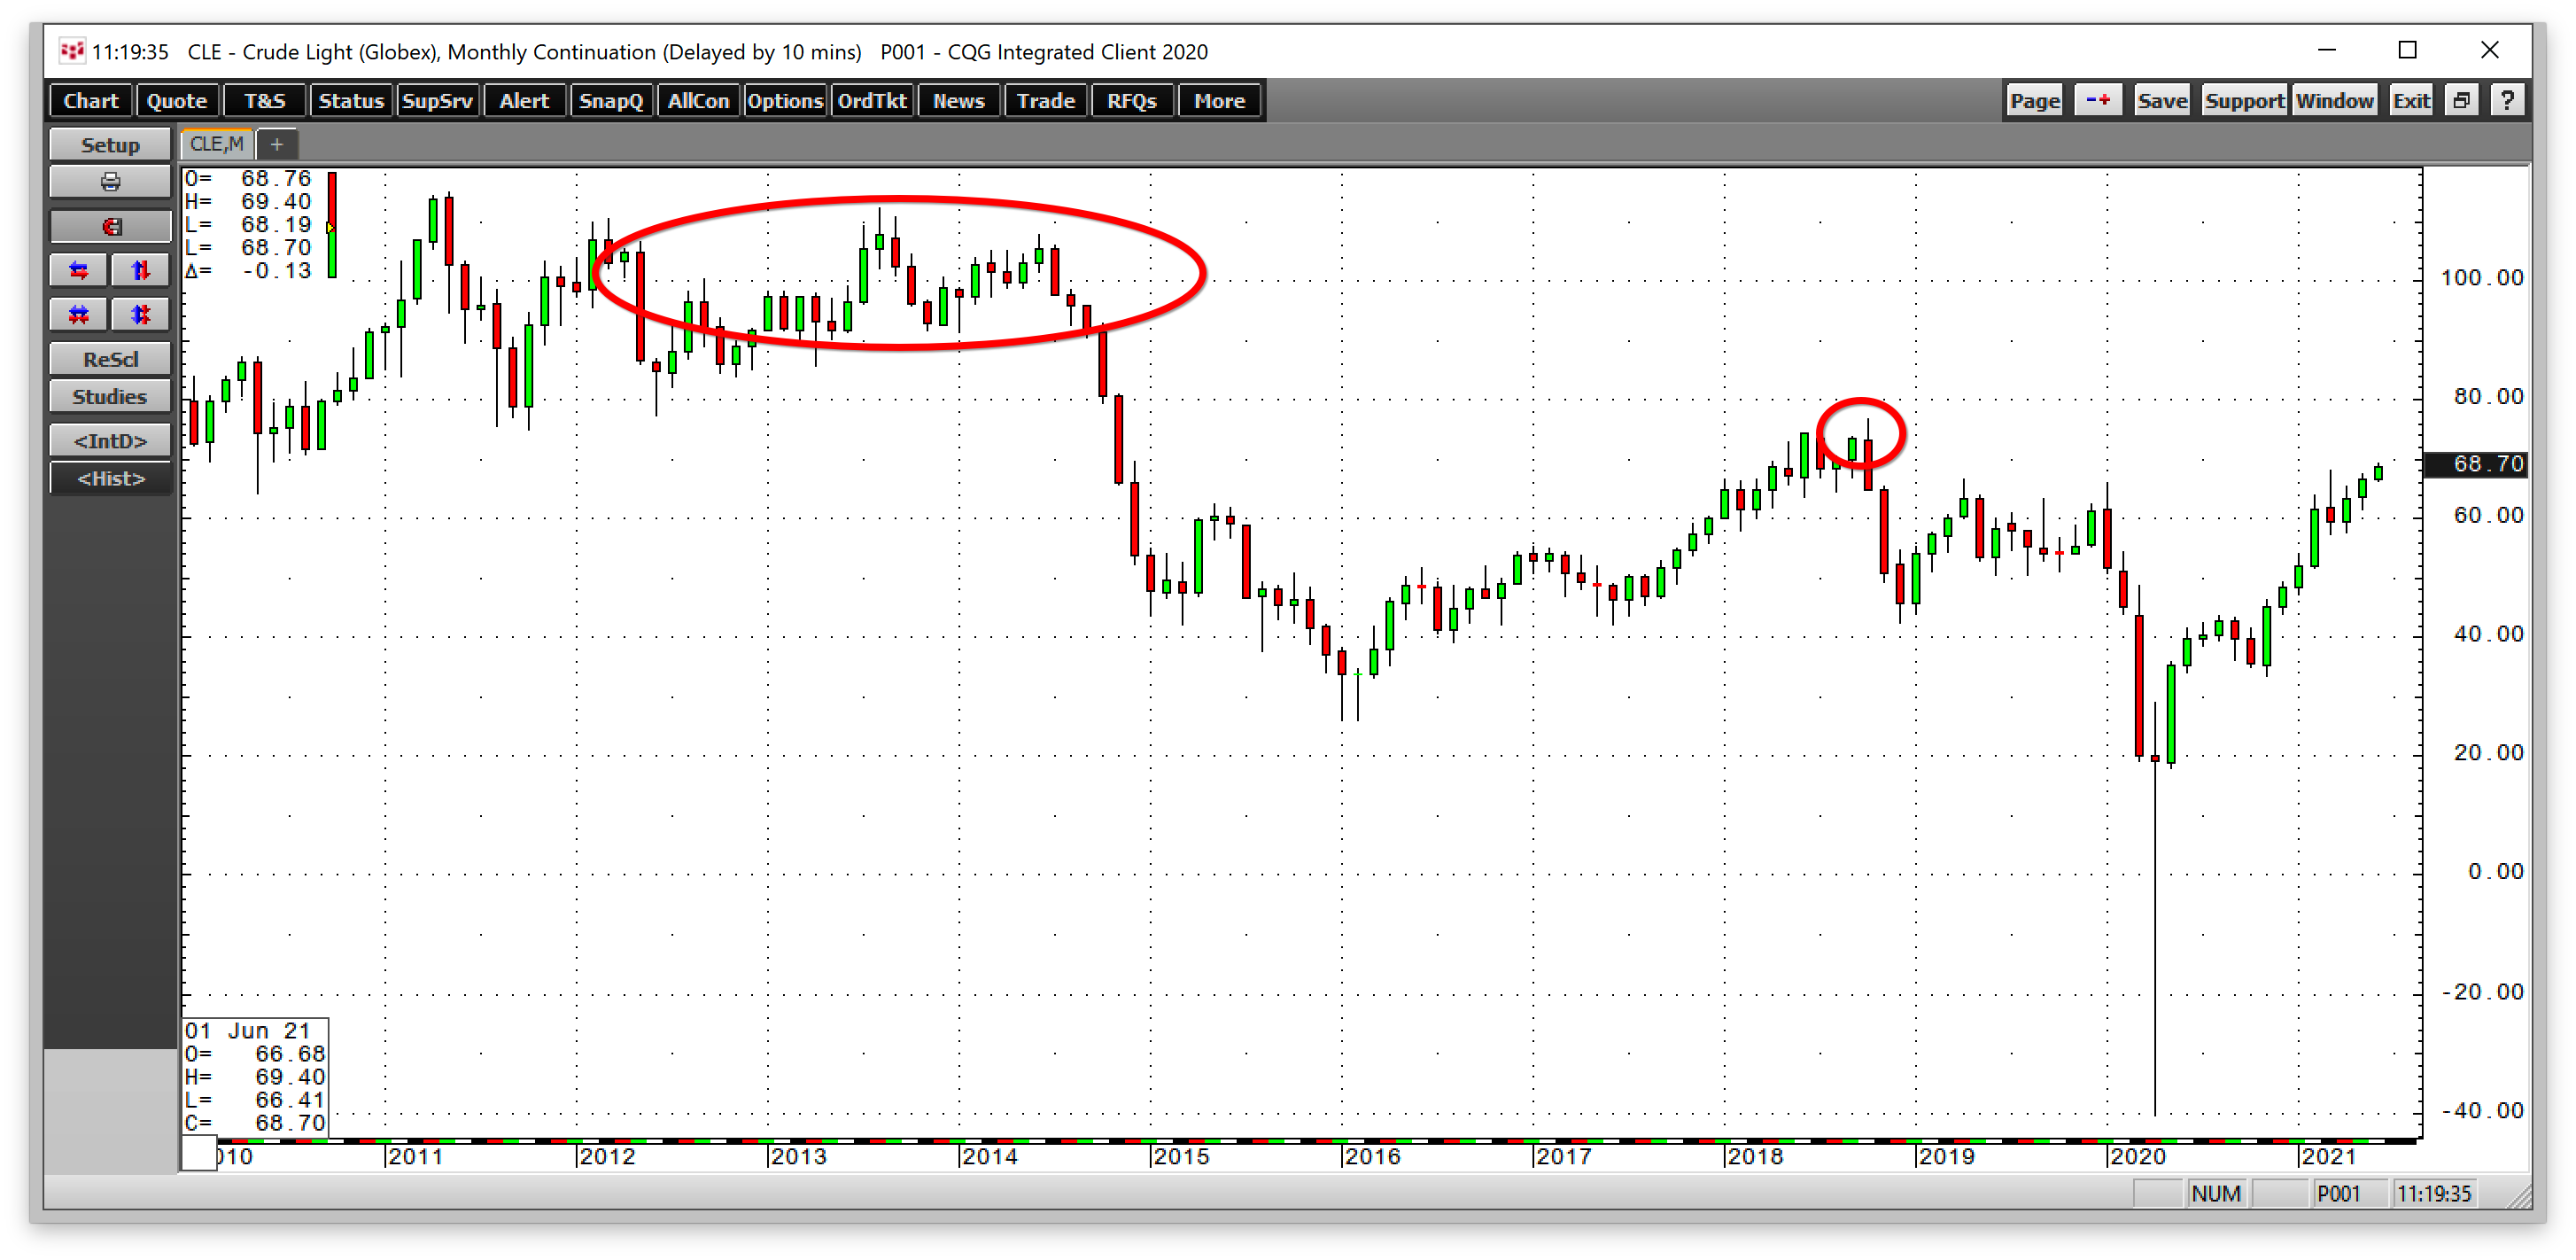
As the monthly chart highlights, the next upside target stands at $76.90 per barrel, the October 2018 peak. The technical level could be a gateway to the $100 level last seen in 2014.
Three reasons for higher crude oil - politics, crack spreads, inflation
Trend following traders are bullish for the prospects of crude oil. Goldman Sachs expects the price to reach $80 this year, but that forecast could be conservative, given the price action in other commodity markets. Three factors point to higher crude oil prices. In bull and bear markets, price action often takes markets to unreasonable, irrational, and illogical price levels. We saw the downside on April 20, 2020. The market could be on its way to an upside surprise over the coming months.
- Inflationary pressures are building as the Fed continues to purchase $120 billion in debt securities each month. The quantitative easing program and a Fed Funds rate at zero percent amount to a tidal wave of liquidity. Moreover, government spending in the trillions increases the national debt and weighs on the dollar’s value. The dollar index is back below the 90 level. Since the dollar is the world’s reserve currency, it is the benchmark pricing mechanism for all commodities, and crude oil is no exception. The bottom line is that inflation is causing all asset prices to rise, and crude oil is no exception.
- Refining or crack spreads are a real-time indicator for crude oil demand as it is the primary ingredient in gasoline and distillate products.
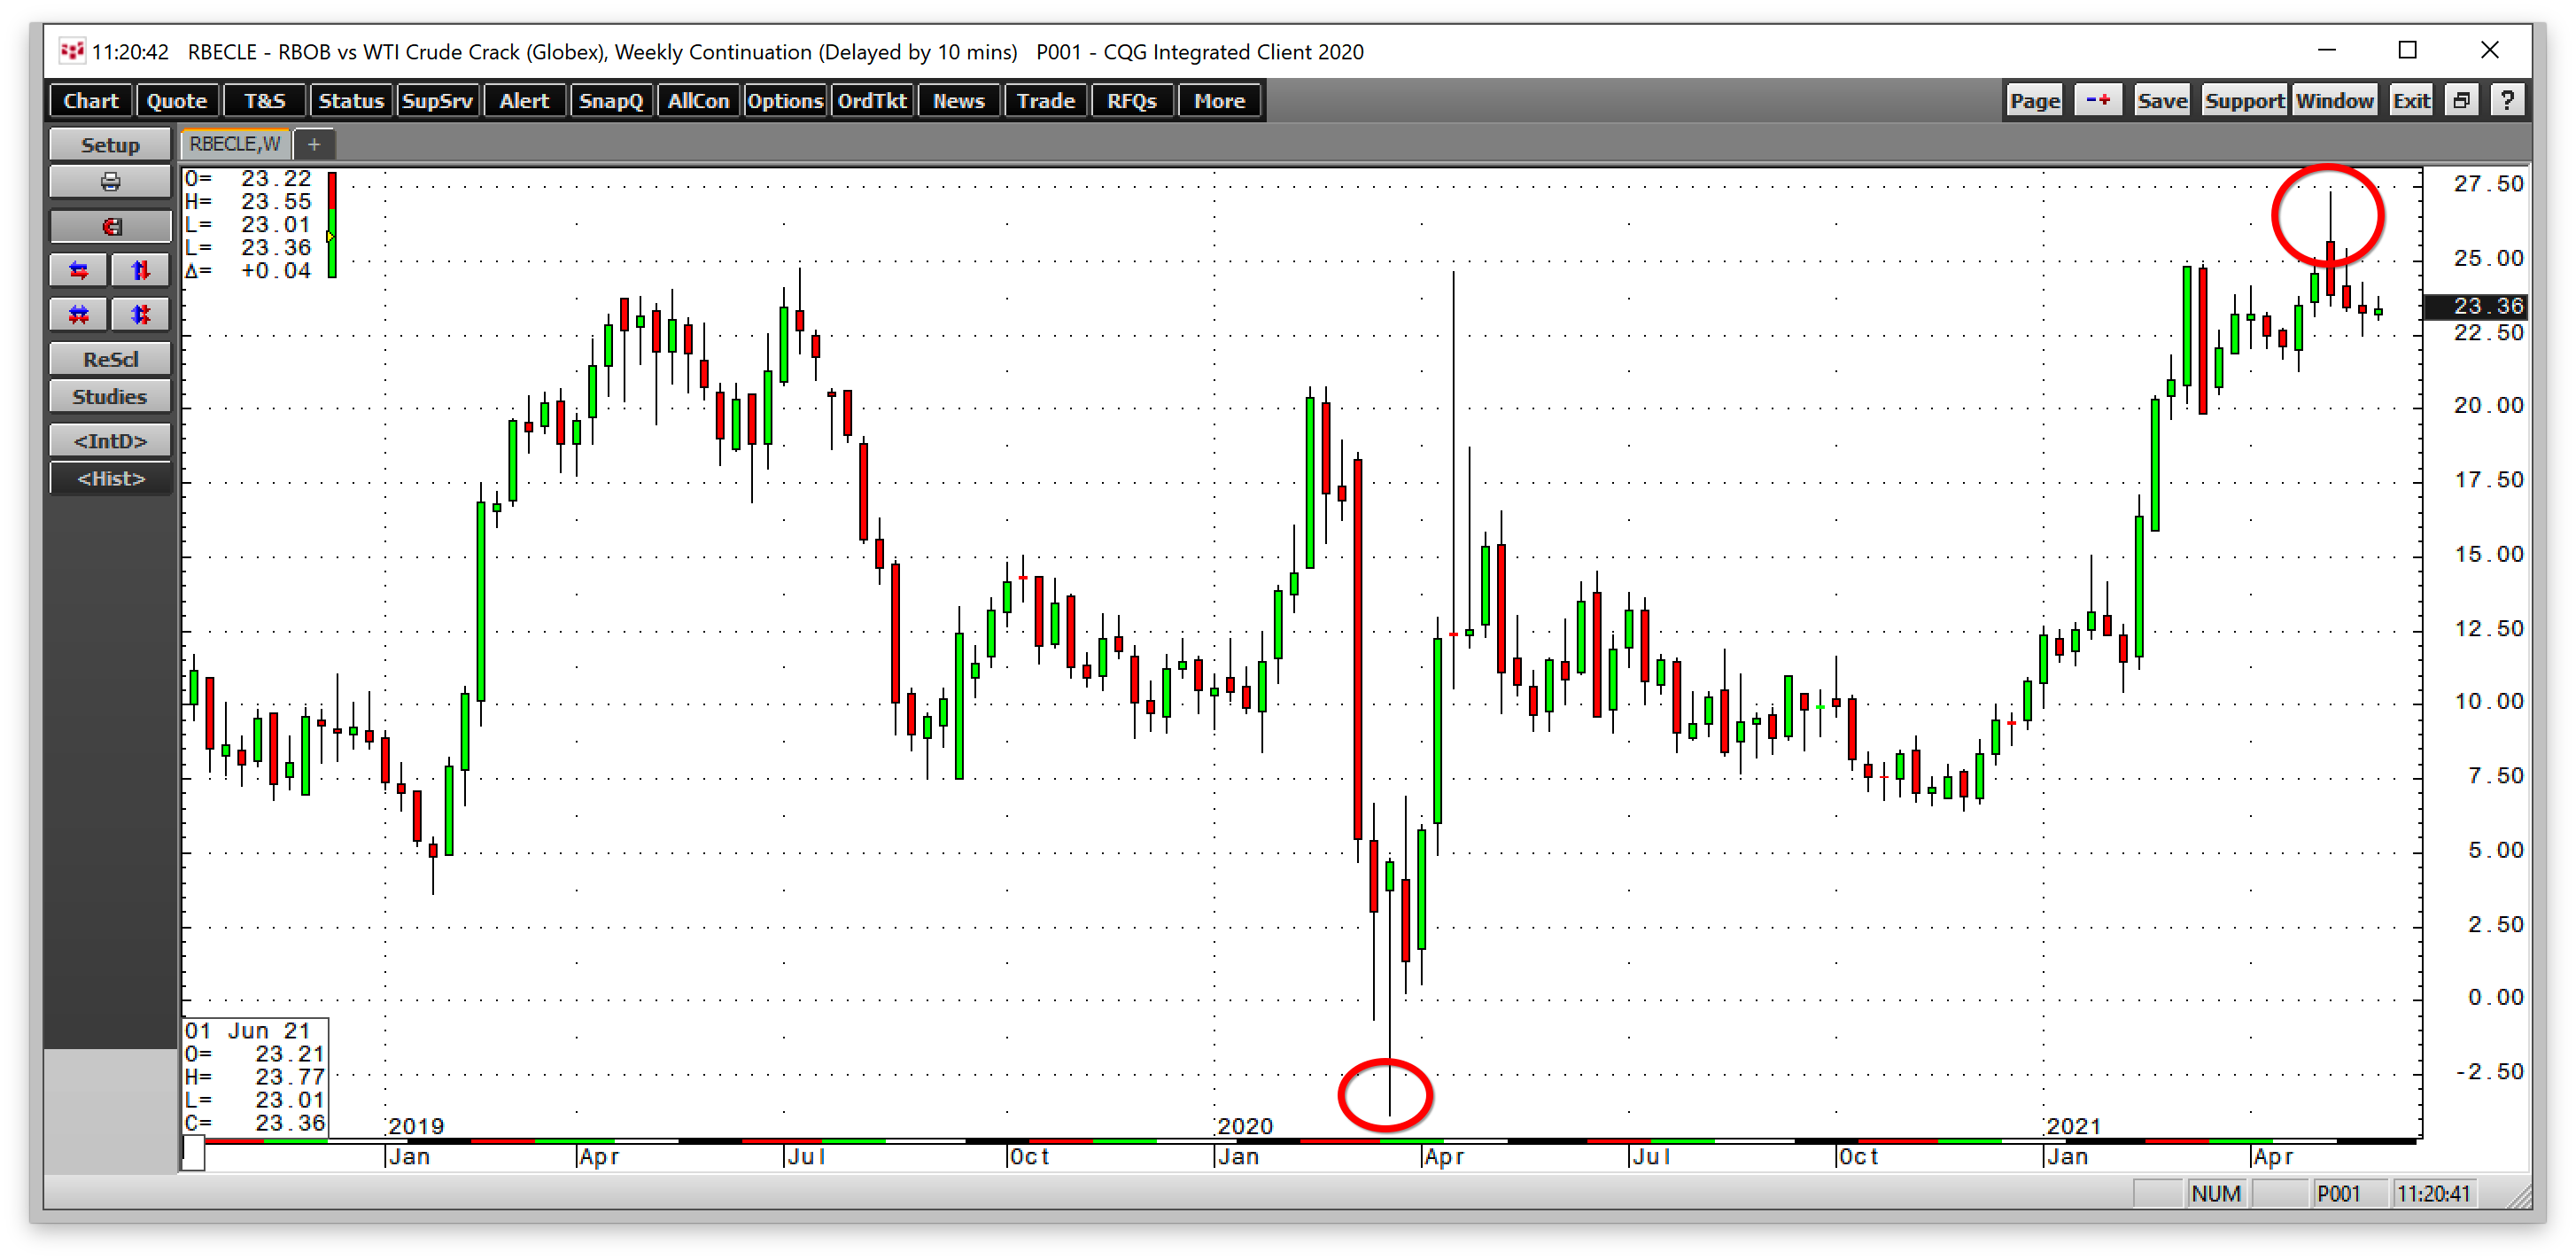
The weekly chart of the gasoline crack spread reflects the growing demand for the oil product as vaccines create herd immunity to COVID-19.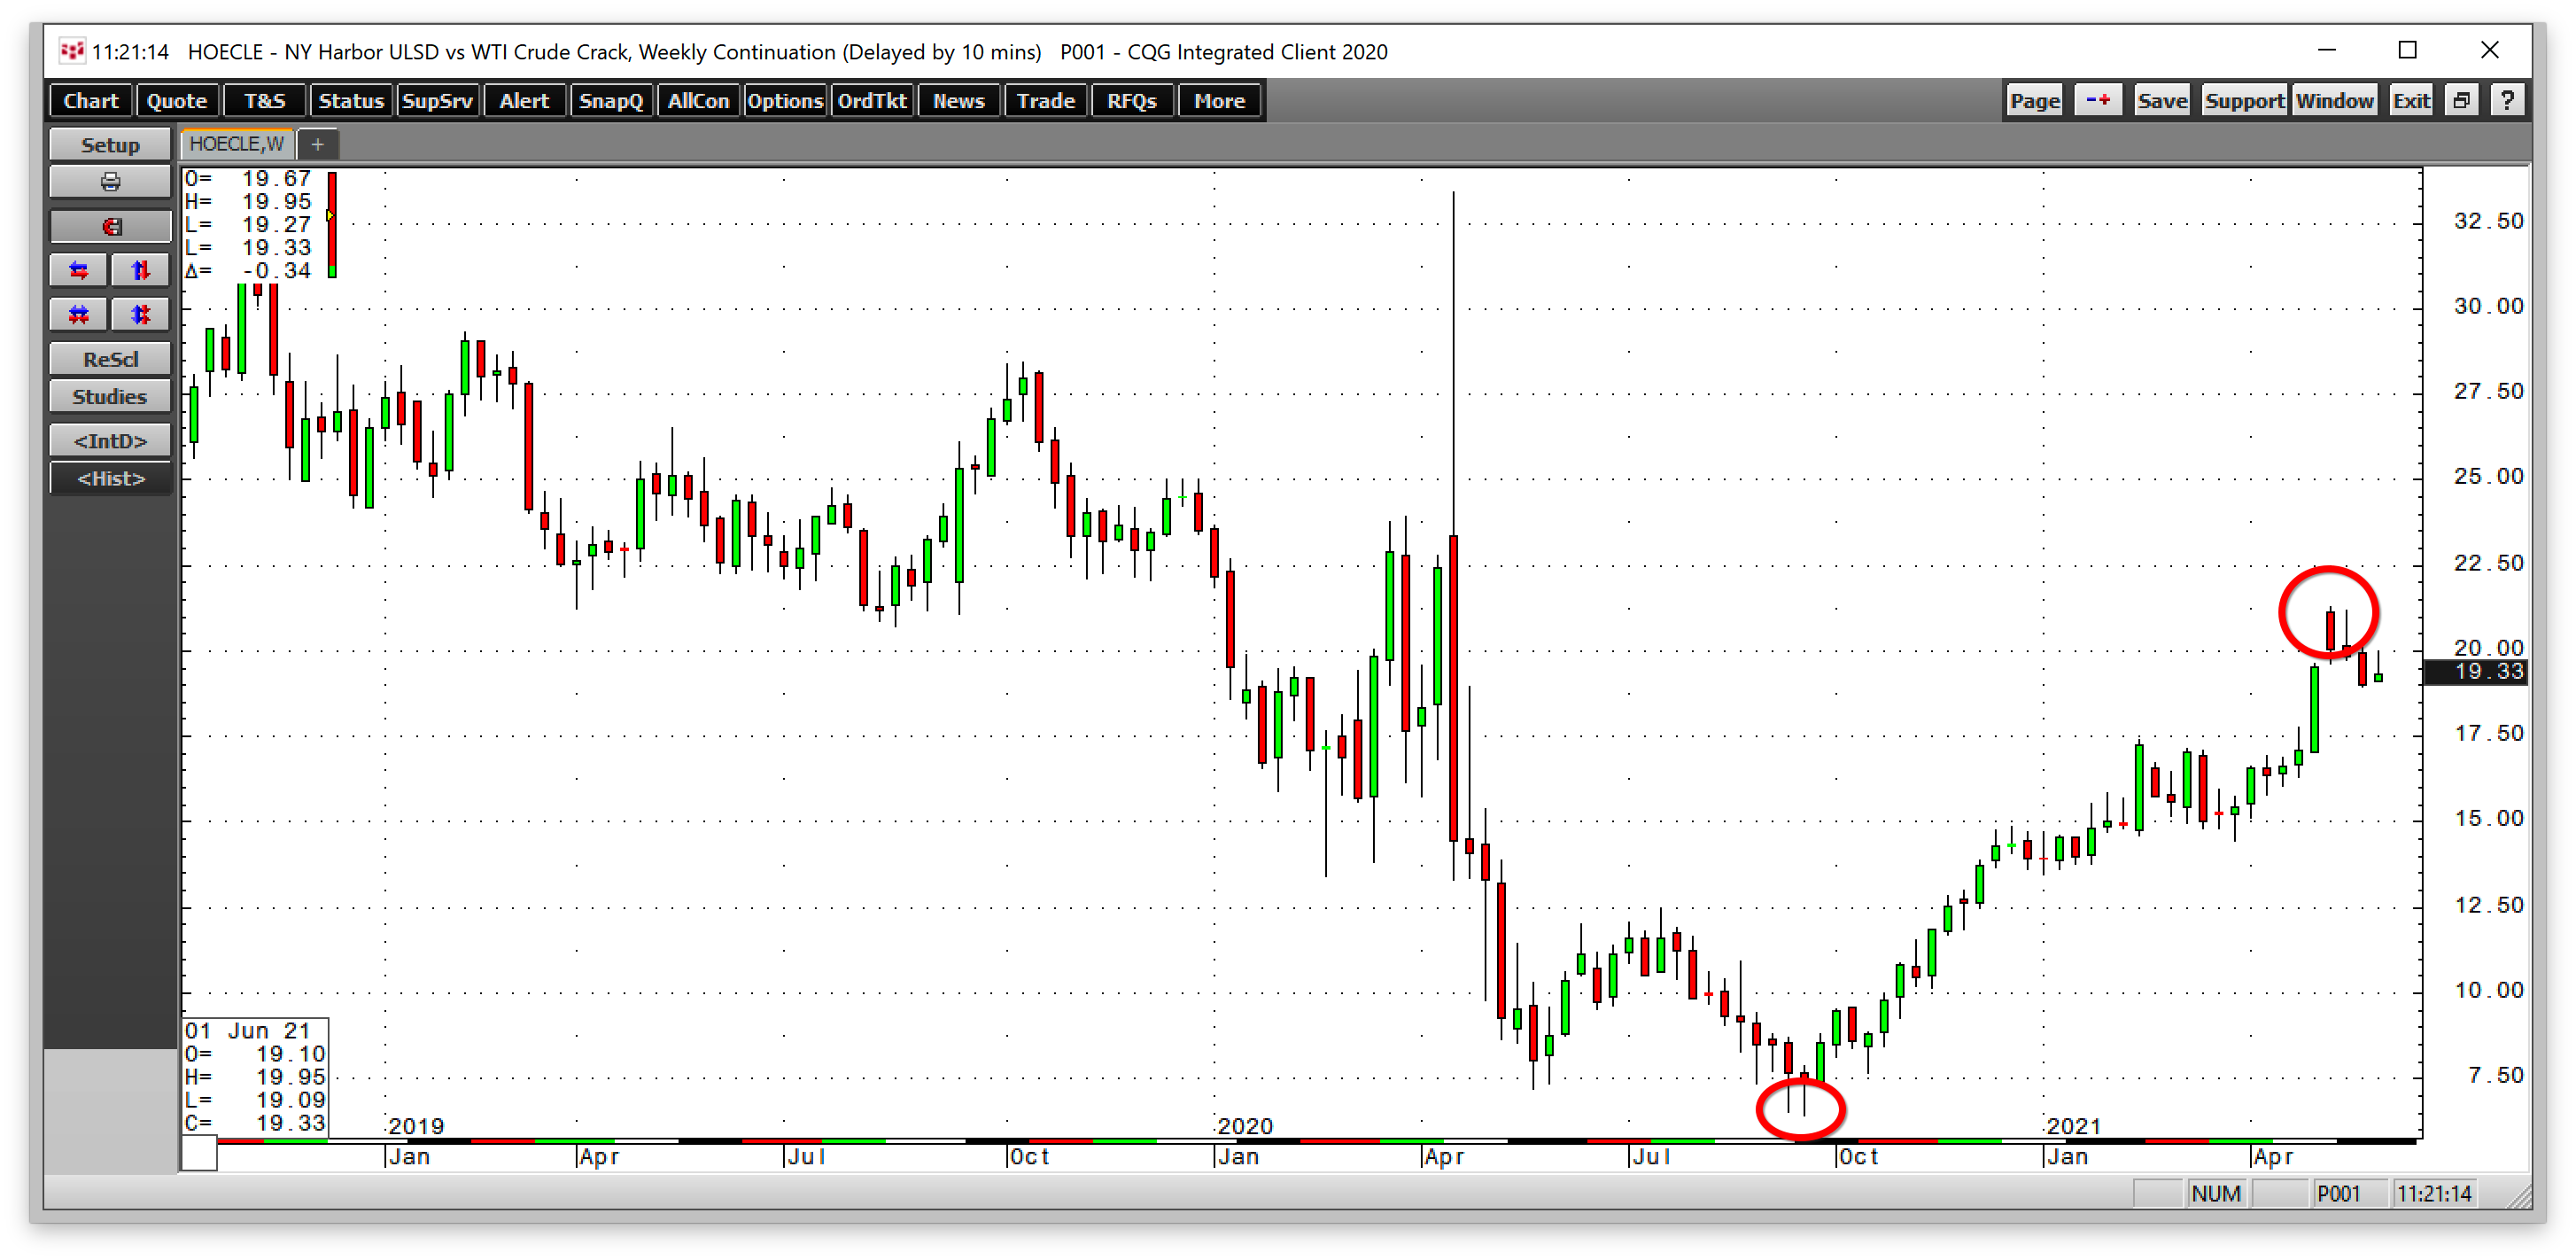
Heating oil is a proxy for all distillate products. The chart shows the ascent of distillate refining spreads, which translates to rising petroleum demand. - Finally, the US and geopolitical landscapes favor higher oil prices. In the US, the Biden administration canceled the Keystone XL pipeline project on its first day in office. The pipeline carried petroleum from the oil sands in Alberta, Canada, to Steele City, Nebraska, and beyond to the NYMEX delivery point at the pipeline network in Cushing, Oklahoma. Most recently, the administration banned drilling on federal lands in Alaska. As the administration addresses climate change, traditional oil and gas production will continue to decline as regulations increase. The move comes at a time when demand is robust. Meanwhile, OPEC+ has suffered under US shale production for years. As the pricing power passes back to the international cartel and Russia, OPEC+ can now squeeze US consumers and increase revenues.
Fundamental supply and demand analysis and the current technical trend point to much higher oil prices. Since the Middle East remains a turbulent region, with the Saudis and Iranians at each other’s throats, the potential for price spikes is now on the up instead of the downside in the wake of the global pandemic.
Is $100 per barrel in the cards?
NYMEX crude oil futures are now a stone’s throw away from $70 per barrel, with the critical technical resistance level at the 2018 $76.90 high. A move above that price puts the next technical target at the June 2014 $107.73 per barrel high.
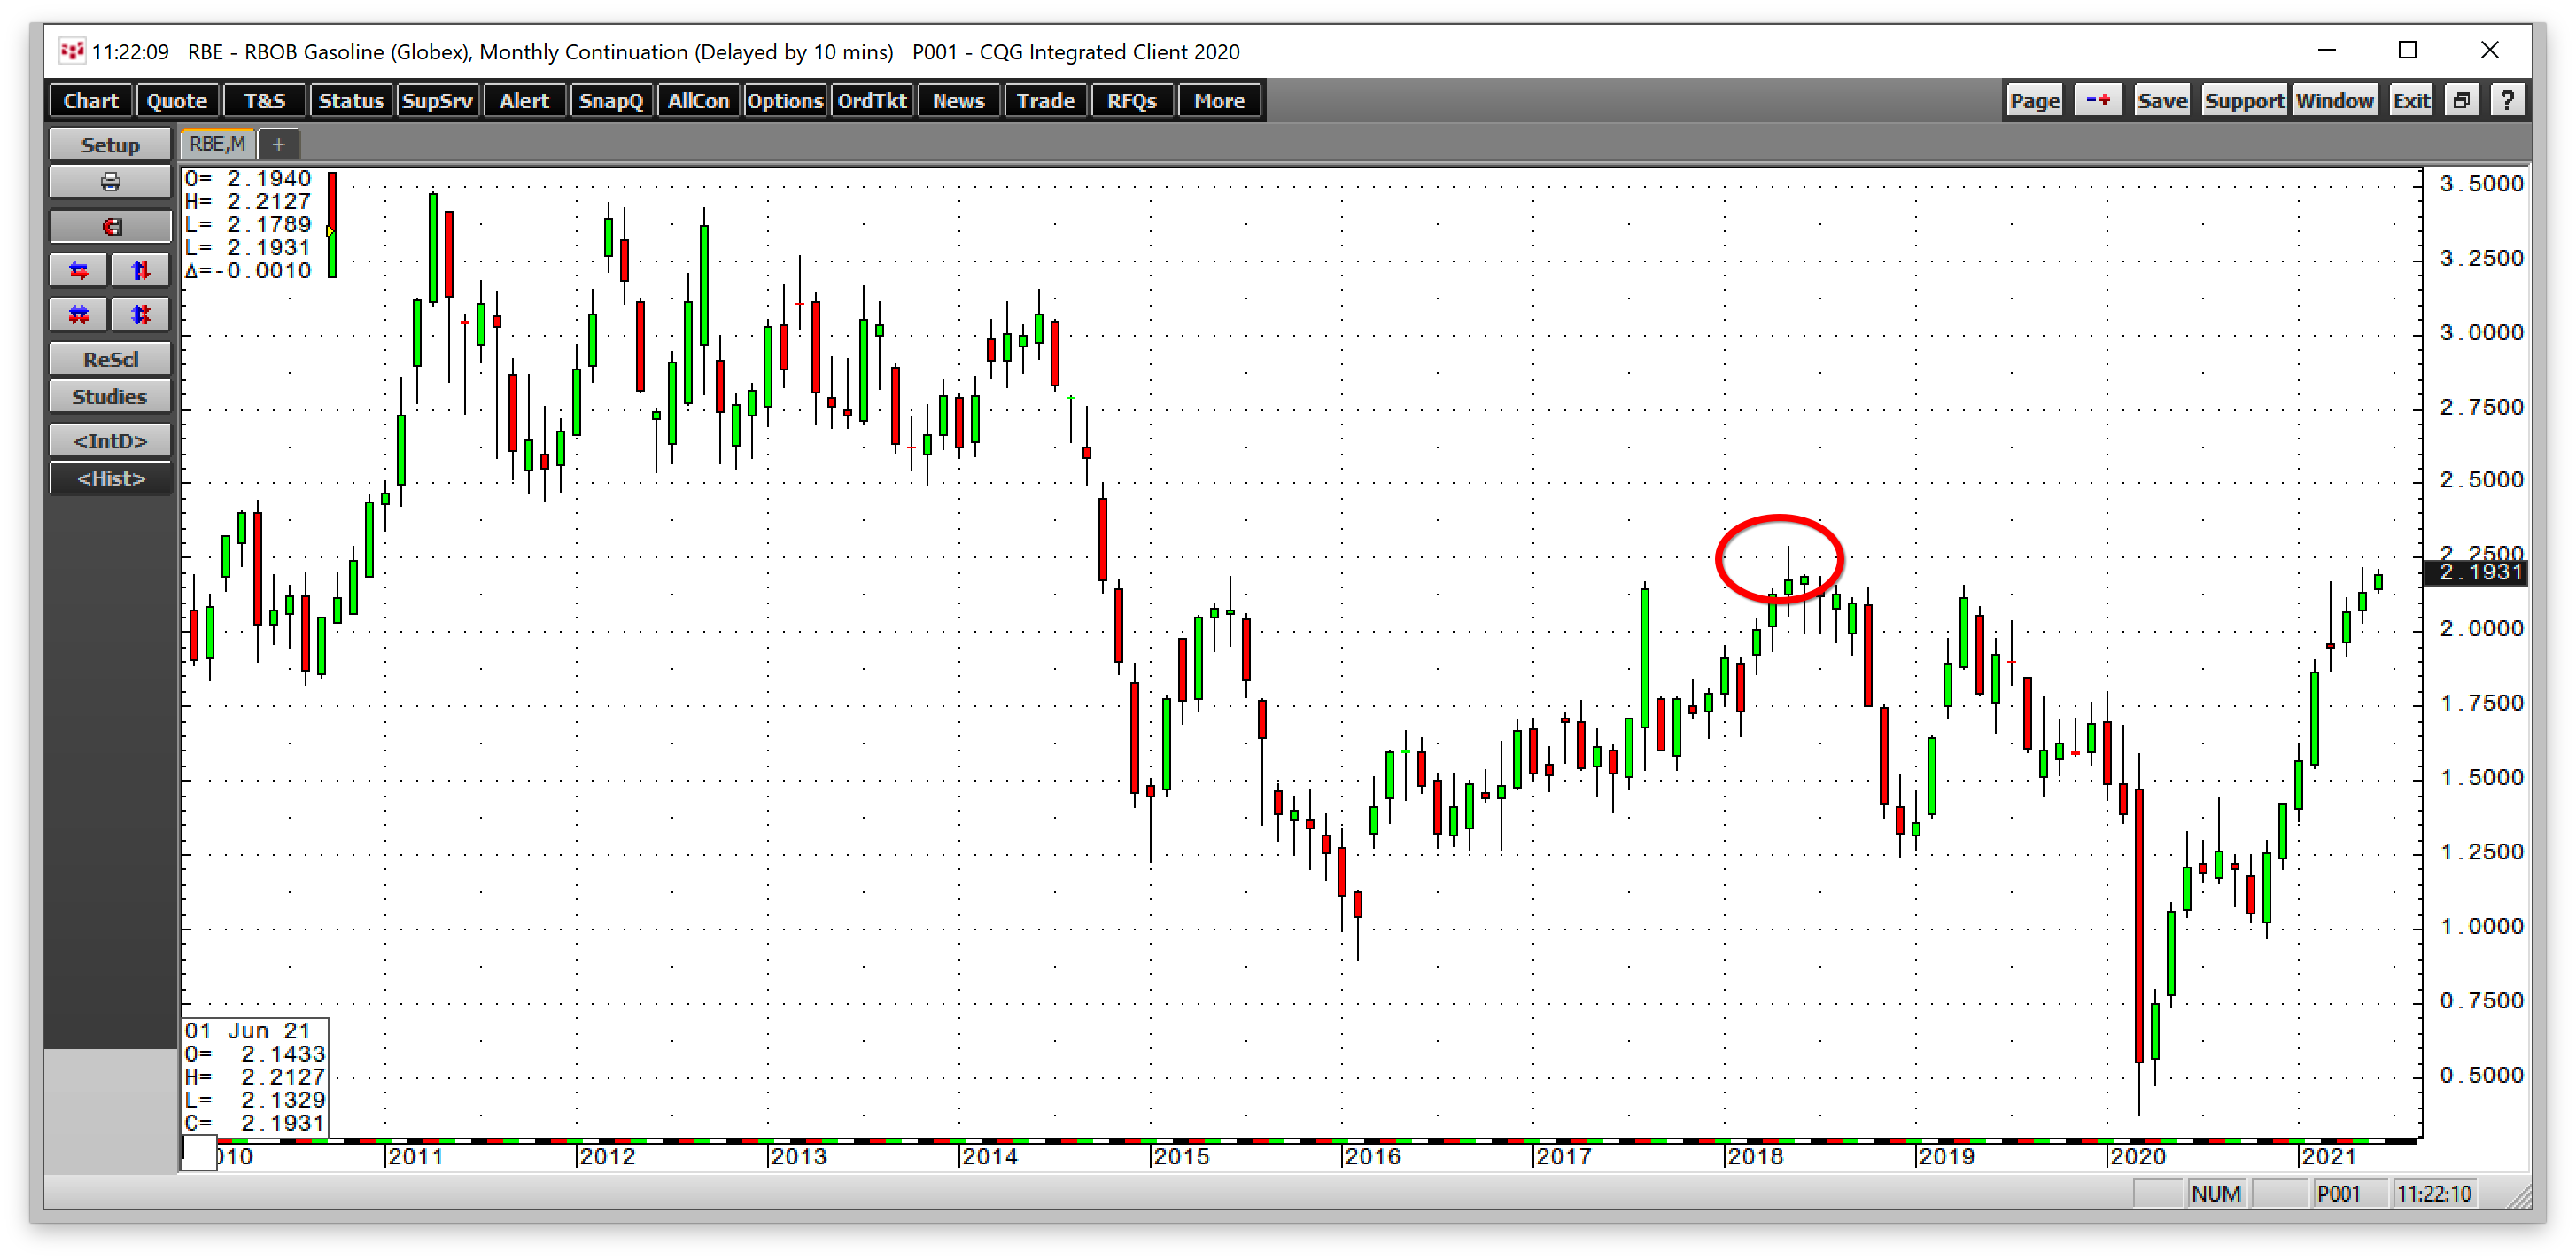
As the monthly chart of RBOB gasoline illustrates, critical technical resistance sits at $2.2855 per gallon wholesale, the May 2018 peak. The 2018 high is a technical gateway to $3 per gallon gasoline prices.
Get ready to pay a lot more for gasoline and crude oil products as US production will not keep up with booming demand under the current administration. While $100 per barrel and $3 gasoline seemed unreasonable targets in 2020, they are now becoming realistic levels for the energy commodity. Meanwhile, even the most aggressive markets rarely move in a straight line. Crude oil tends to take the stairs higher and an elevator to the downside during corrections. Buying on price weakness during selloffs is likely to be the optimal approach over the coming weeks and months as it improves the odds of success.