This midweek look shows the Nikkei 225 (Osaka), Mar 26 contract up with a loss of -3.39%. The best performer in the US market is the E-mini Dow, Mar 26 contract showing a loss of -1.21%.… more
Thom Hartle
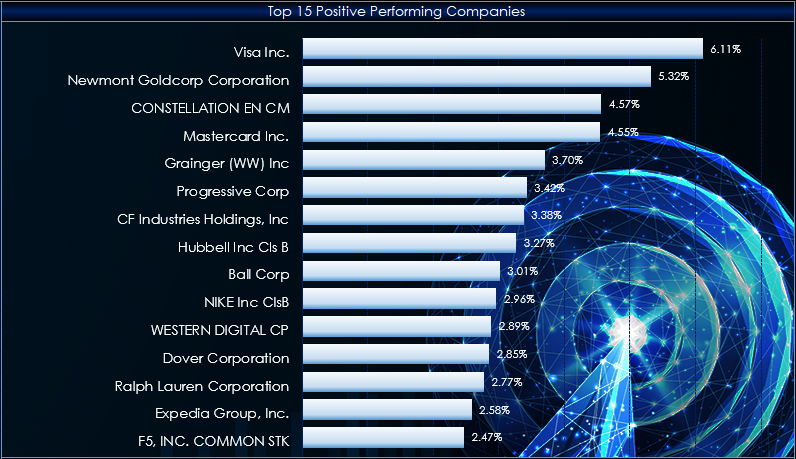
Stories are appearing in the media pointing out the possibility of an AI bubble. Alternative ETFs have been suggested that are not so "tech heavy." One suggestion is the Invesco S&P 500®… more

This midweek look shows the Nikkei 225 (Osaka), Dec 25 contract up with a gain of +0.75%. The best performer in the US market is the E-mini Midcap 400, Dec 25 contract showing a gain of +1.… more
This post detailed the Double Exponential Moving Average Study or DEMA. DEMA is helpful for technical analysis because it reduces the lag of traditional moving averages, such as the simple moving… more
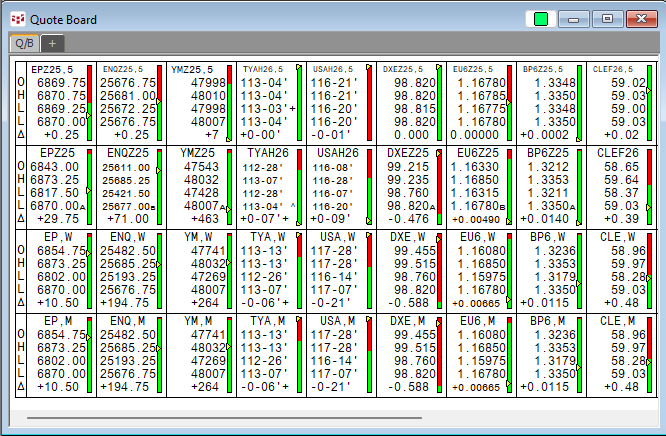
The CQG Quote Board is a classic quote display providing the open, high, low, last, and net change from the prior close.
One feature unique to the CQG Quote Board is a symbol entered… more
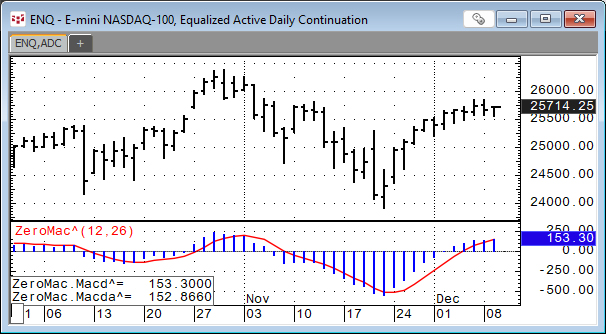
This midweek look shows the Nikkei 225 (Osaka), Dec 25 contract with a decline of -0.68%. The best performer in the US market is the E-mini NASDAQ-100, Dec 25 contract showing a gain of +0.… more
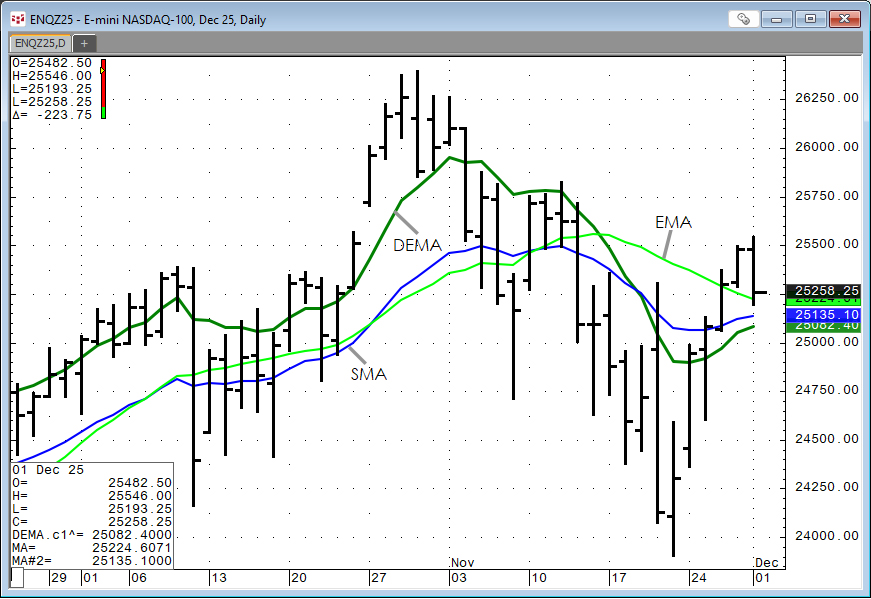
The Double Exponential Moving Average study is a moving average calculation that reduces the lag associated with other moving averages. The Double Exponential Moving average is calculated as the… more
This midweek look shows the Nikkei 225 (Osaka), Dec 25 contract with a +2.79% gain. The best performer in the US market is the E-mini NASDAQ-100, Dec 25 contract showing a gain of +4.16%.… more
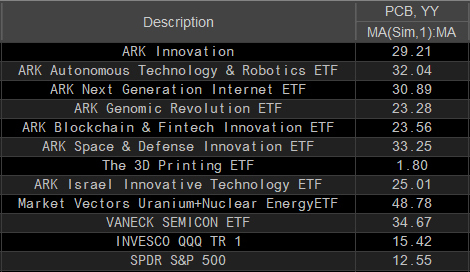
At the bottom of this post is a downloadable CQG Pac that installs a page for CQG IC and QTrader customers interested in following a section of the technology ETFs. The group of ETFs are displayed… more
From the ARK website: "Companies within ARKQ are focused on and are expected to substantially benefit from the development of new products or services, technological improvements, and advancements… more