This midweek look shows the Nikkei 225 (Osaka), Jun 26 contract, with a gain of +7.14%. The best performer in the US market is the E-mini Midcap 400, Jun 26 contract showing a gain of +4.15… more
Thom Hartle
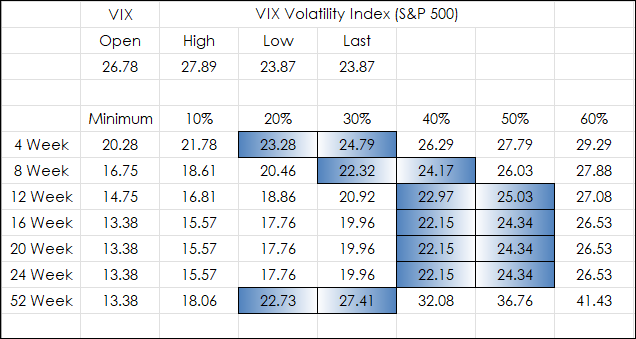
From the Google AI: "The VIX Index, or CBOE Volatility Index, is a real-time market indicator representing the market's 30-day expectation of forward-looking volatility for the S&P 500 Index.… more
This post details a Microsoft Excel dashboard that tracks the day's performance of the holdings of the Schwab U.S. Dividend Equity ETF (Symbol: SCHD)
From their website:
ObjectiveThe… more

This midweek look shows the Nikkei 225 (Osaka), Jun 26 contract, with a gain of +2.99%. The best performer in the US market is the E-mini NASDAQ 100, Jun 26 contract showing a gain of +4.03… more
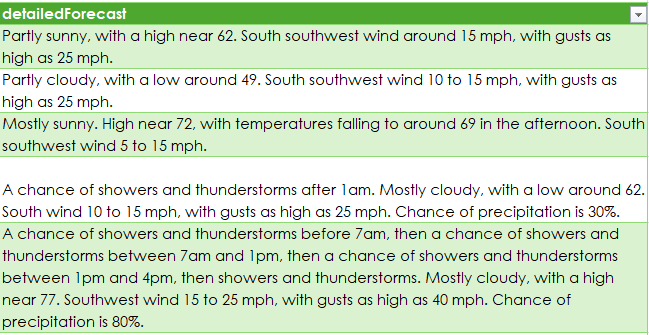
This post details the Excel sample at the bottom of the post using Excel's Power Queries to pull in weather forecasts for a city. There are four steps:
Determine the latitude and longitude of… more
This midweek look shows the Nikkei 225 (Osaka), Jun 26 contract, up with a gain of +1.37%. The best performer in the US market is the E-mini MidCap 400, Jun 26 contract showing a gain of +1… more
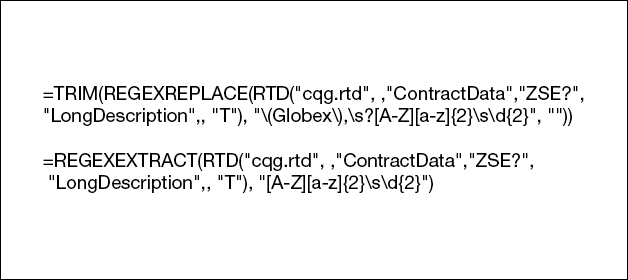
Excel's REGEXEXTRACT function enables enhanced text extraction based on patterns using regular expressions (regex) rather than fixed positions. This function enables you to pull specific data from… more
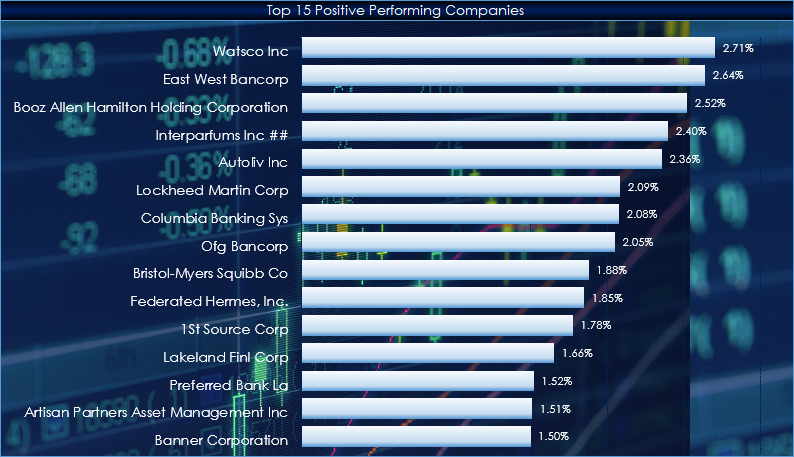
This post details a CQG PAC that can be downloaded and installed to track the day's performance of the holdings of the iShares U.S. Aerospace & Defense ETF (Symbol: ITA)
From the iShares… more
This midweek look shows the Nikkei 225 (Osaka), Jun 26 contract, up with a gain of +1.37%. The best performer in the US market is the E-mini MidCap 400, Jun 26 contract showing a gain of +1… more
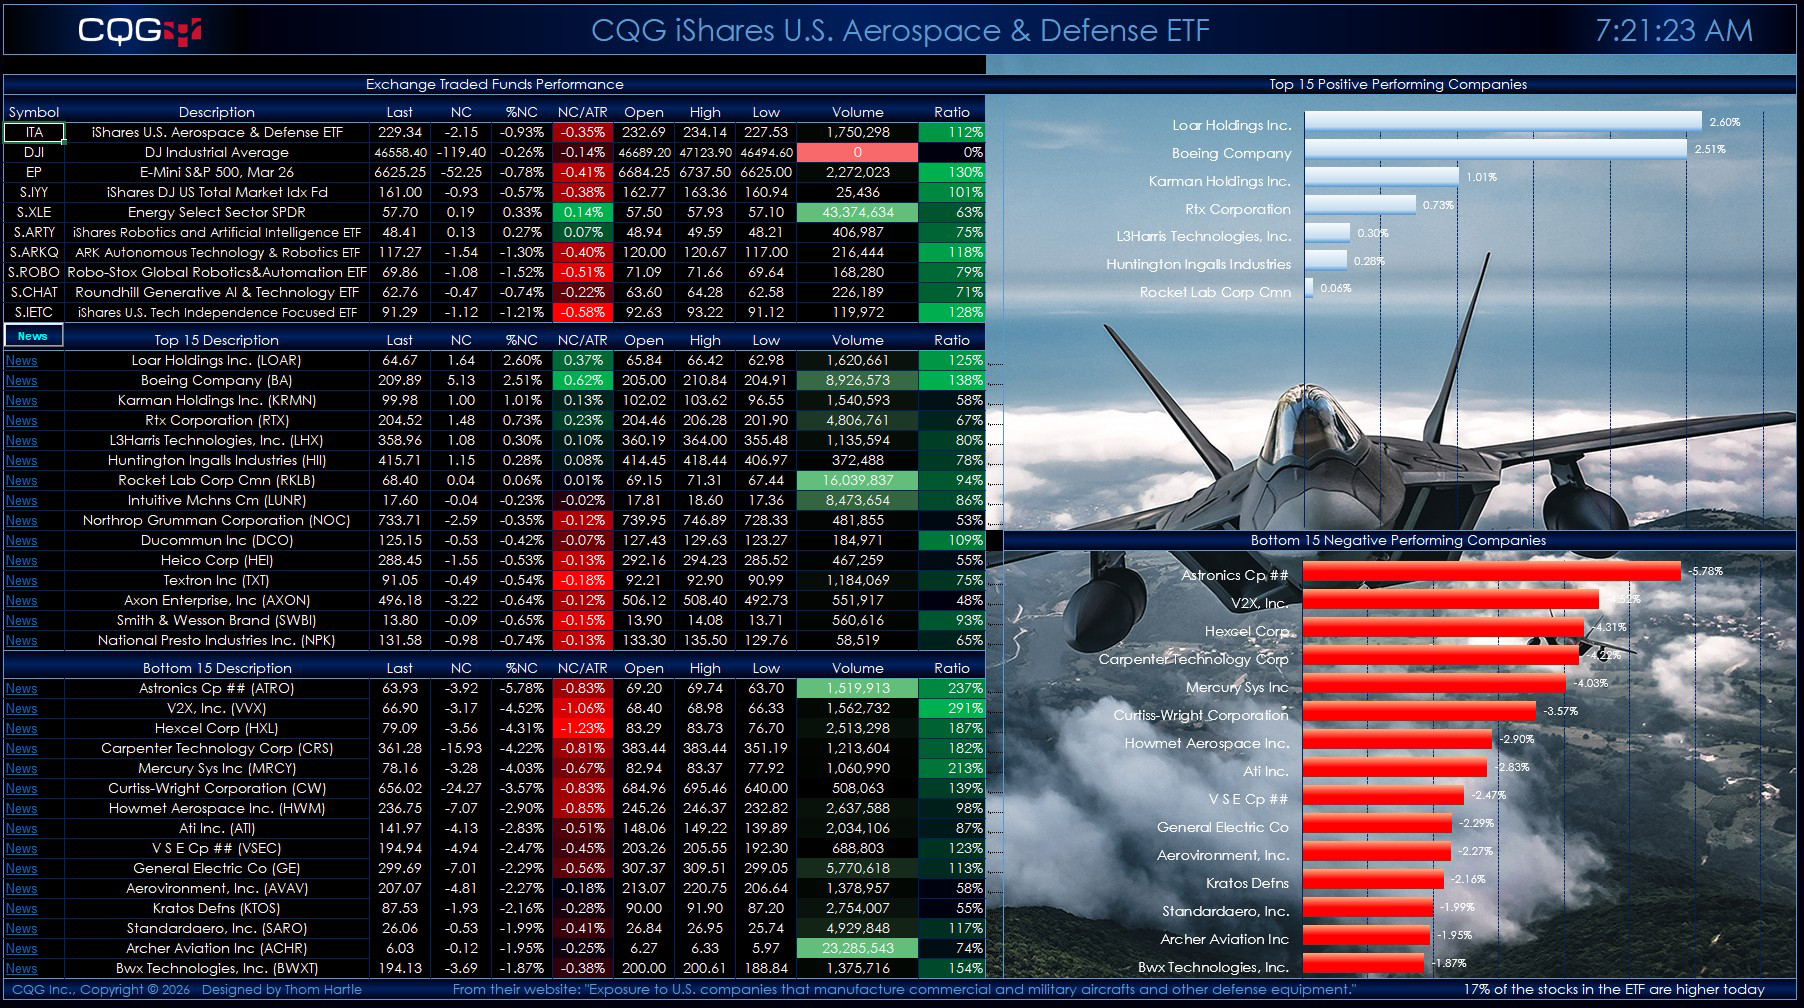
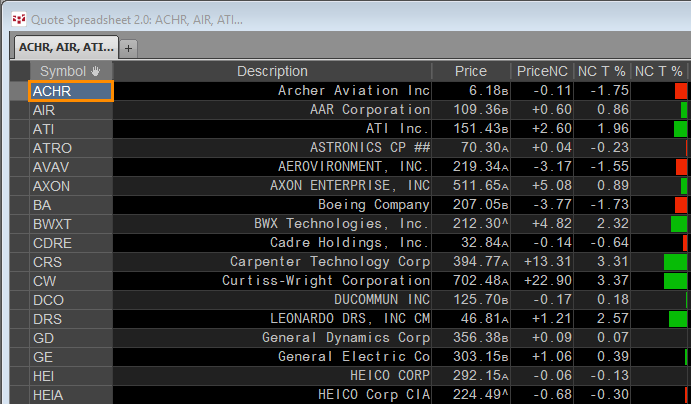
This post offers two Excel dashboards for tracking the holdings of the iShares U.S. Aerospace & Defense ETF (Symbol: ITA).
The iShares U.S. Aerospace & Defense ETF seeks to track the… more