
This midweek look shows the Nikkei 225 (Osaka), Dec 25 contract with a -0.55% loss. The best performer in the US market is the E-mini NASDAQ-100, Dec 25 contract showing a gain of +1.11%.… more
Thom Hartle
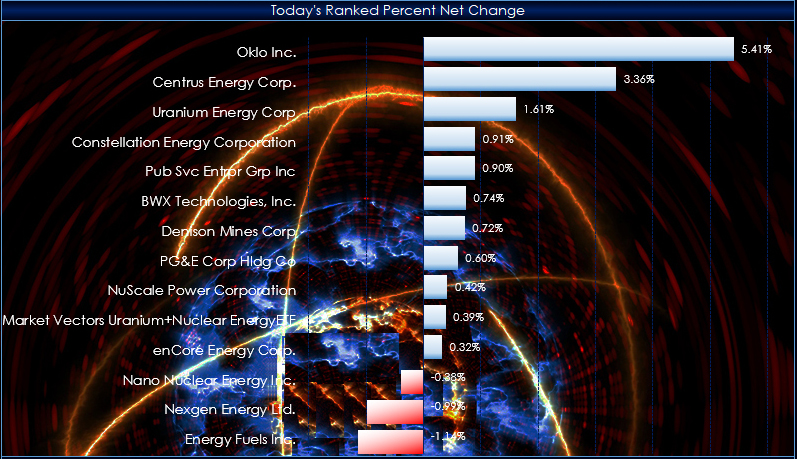
This post details an Excel dashboard for tracking the performance of the US stock holdings of the VanEck Uranium + Nuclear Energy ETF (symbol: NLR).
NLR invests in companies building nuclear… more

Most of the media is focused on artificial intelligence, which makes sense with all the positive predictions. There is another renaissance occurring: The administration's emphasis on reducing… more

This midweek look shows the Nikkei 225 (Osaka), Dec 25 contract with a +1.43% gain. The best performer in the US market is the E-mini Dow, Dec 25 contract showing a loss of -0.43%. The best… more
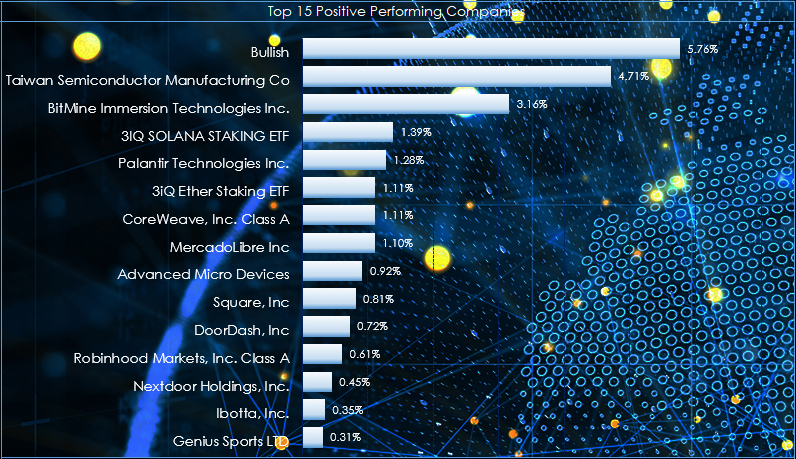
From the ARK website: "Companies within the ARKW are focused on and expected to benefit from shifting the bases of technology infrastructure to the cloud, enabling mobile, new and local services,… more
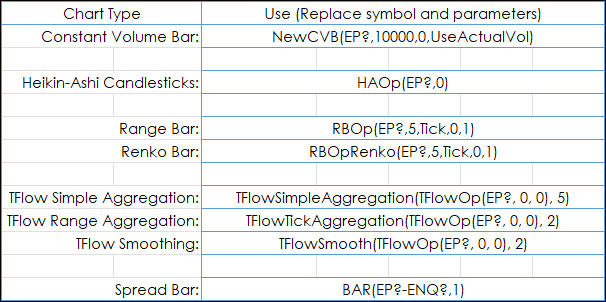
Excel RTD formulas are available for pulling in Trade System Statistics. Below is an image of a Constant Volume chart with the cqg.AMASamp Trade system applied to the chart.
The next… more
This midweek look shows the Nikkei 225 (Osaka), Dec 25 contract with a +0.27% gain. The best performer in the US market is the E-mini NASDAQ-100, Dec 25 contract showing a gain of +0.55%.… more
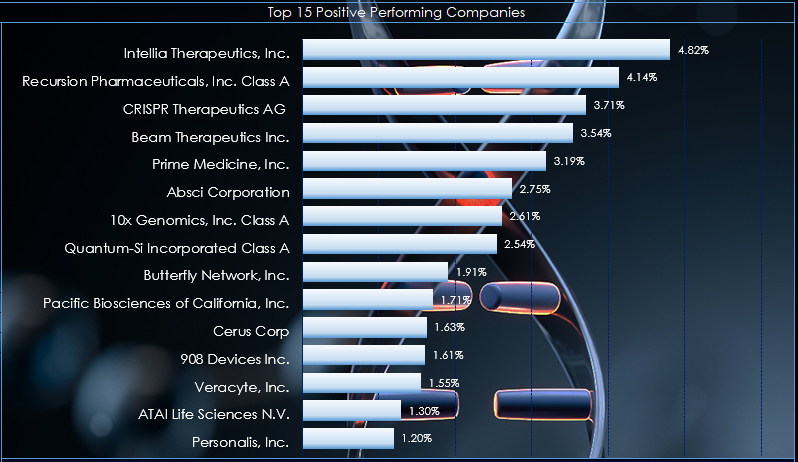
From the ARK website: "Companies within ARKG are focused on and are expected to substantially benefit from extending and enhancing the quality of human and other life by incorporating… more
This midweek look shows the Nikkei 225 (Osaka), Sep 25 contract with a +1.90% gain. The best performer in the US market is the E-mini NASDAQ-100, Sep 25 contract showing a gain of +0.74%.… more
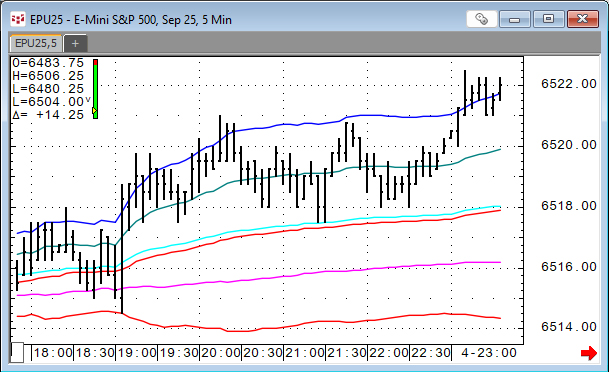
VWAP is the volume weighted average price for a futures contract plotted as a line on the price chart. The calculation is the sum of traded volume times the price divided by the sum of the traded… more