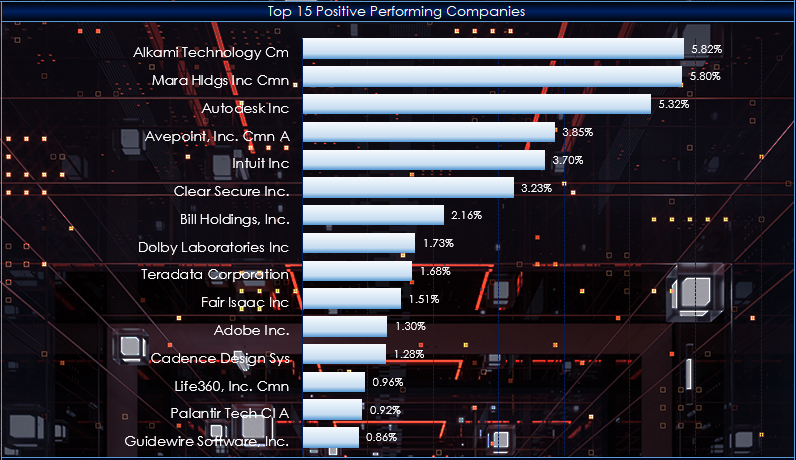
This post details a Microsoft Excel dashboard that tracks the day's performance of the holdings of the iShares Expanded Tech-Software Sector ETF (Symbol: IGV).
From the iShares website… more
This post details a Microsoft Excel dashboard that tracks the day's performance of the holdings of the iShares Expanded Tech-Software Sector ETF (Symbol: IGV).
From the iShares website… more

This video, presented by CQG Product Specialist Helmut Mueller, walks you through using his Super Template for developing and testing a trading system.
The Super Template is installed in CQG… more

This midweek look shows the Nikkei 225 (Osaka), Mar 26 contract, up with a gain of +4.91%. The best performer in the US market is the E-mini NASDAQ 100, Mar 26 contract showing a gain of +1… more
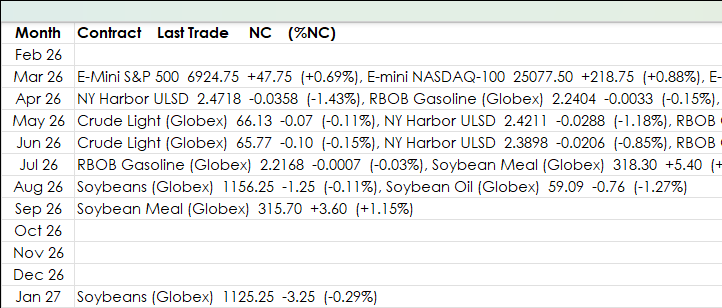
The previous post: "Excel 365 REDUCE and LAMBDA Functions" detailed using Excel's REDUCE and LAMBDA functions to display a table of markets that are sorted by the contract month from a table of a… more
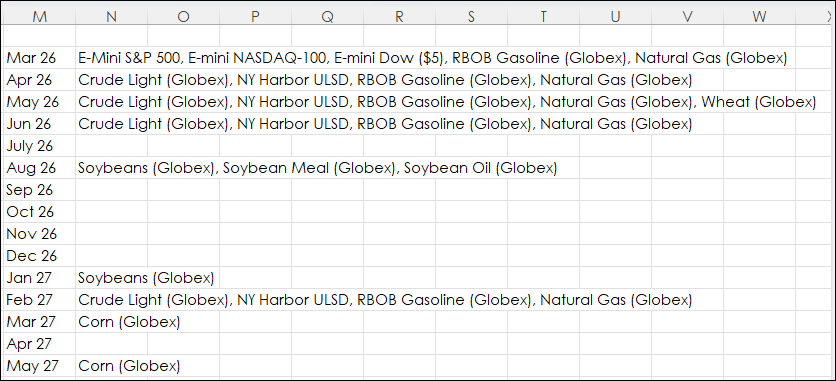
This post details using Excel's REDUCE and LAMBDA function to extract particular data from an Excel dashboard tracking many different markets. For example, the image below displays market data for… more
This midweek look shows the Nikkei 225 (Osaka), Mar 26 contract, up with a gain of +1.00%. The best performer in the US market is the E-mini NASDAQ 100, Mar 26 contract showing a gain of +0… more

This video, presented by CQG Product Specialist Helmut Mueller, walks you through applying the CQG Trade System Optimizer (TSO) to a basic system programmed in CQG IC. This video is a follow up to… more

This video walks you through setting up your pages in CQG One or CQG Desktop. For best viewing, click "Watch on YouTube" and then full screen. Topics in this video include:
Introduction to the… more
This midweek look shows the Nikkei 225 (Osaka), Mar 26 contract, up with a gain of +6.78%. The best performer in the US market is the E-mini NASDAQ 100, Mar 26 contract showing a gain of +0… more
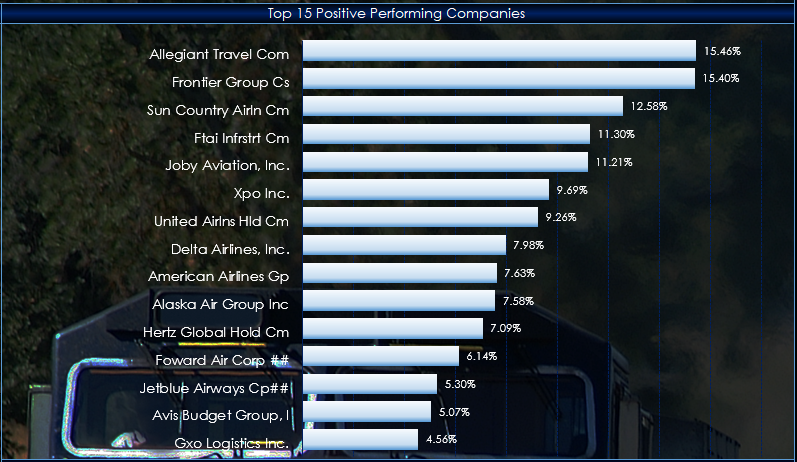
This post details a Microsoft Excel dashboard that tracks the day's performance of the holdings of the iShares Transportation Average ETF (Symbol: IYT).
The stock market media has been… more