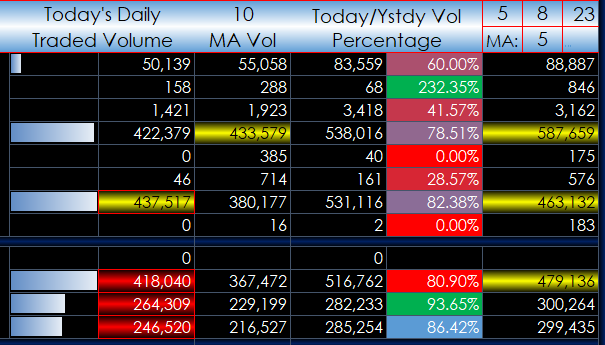
This Microsoft Excel® dashboard displays all of the Globex-traded Three-Month SOFR contracts including volume and open interest data.
The first three columns detail the contract… more
This Microsoft Excel® dashboard displays all of the Globex-traded Three-Month SOFR contracts including volume and open interest data.
The first three columns detail the contract… more
CQG products such as CQG IC, QTrader and CQG One come with a collection of price-based studies which can be applied to charts to facilitate analysis. This post offers insight into the collection… more
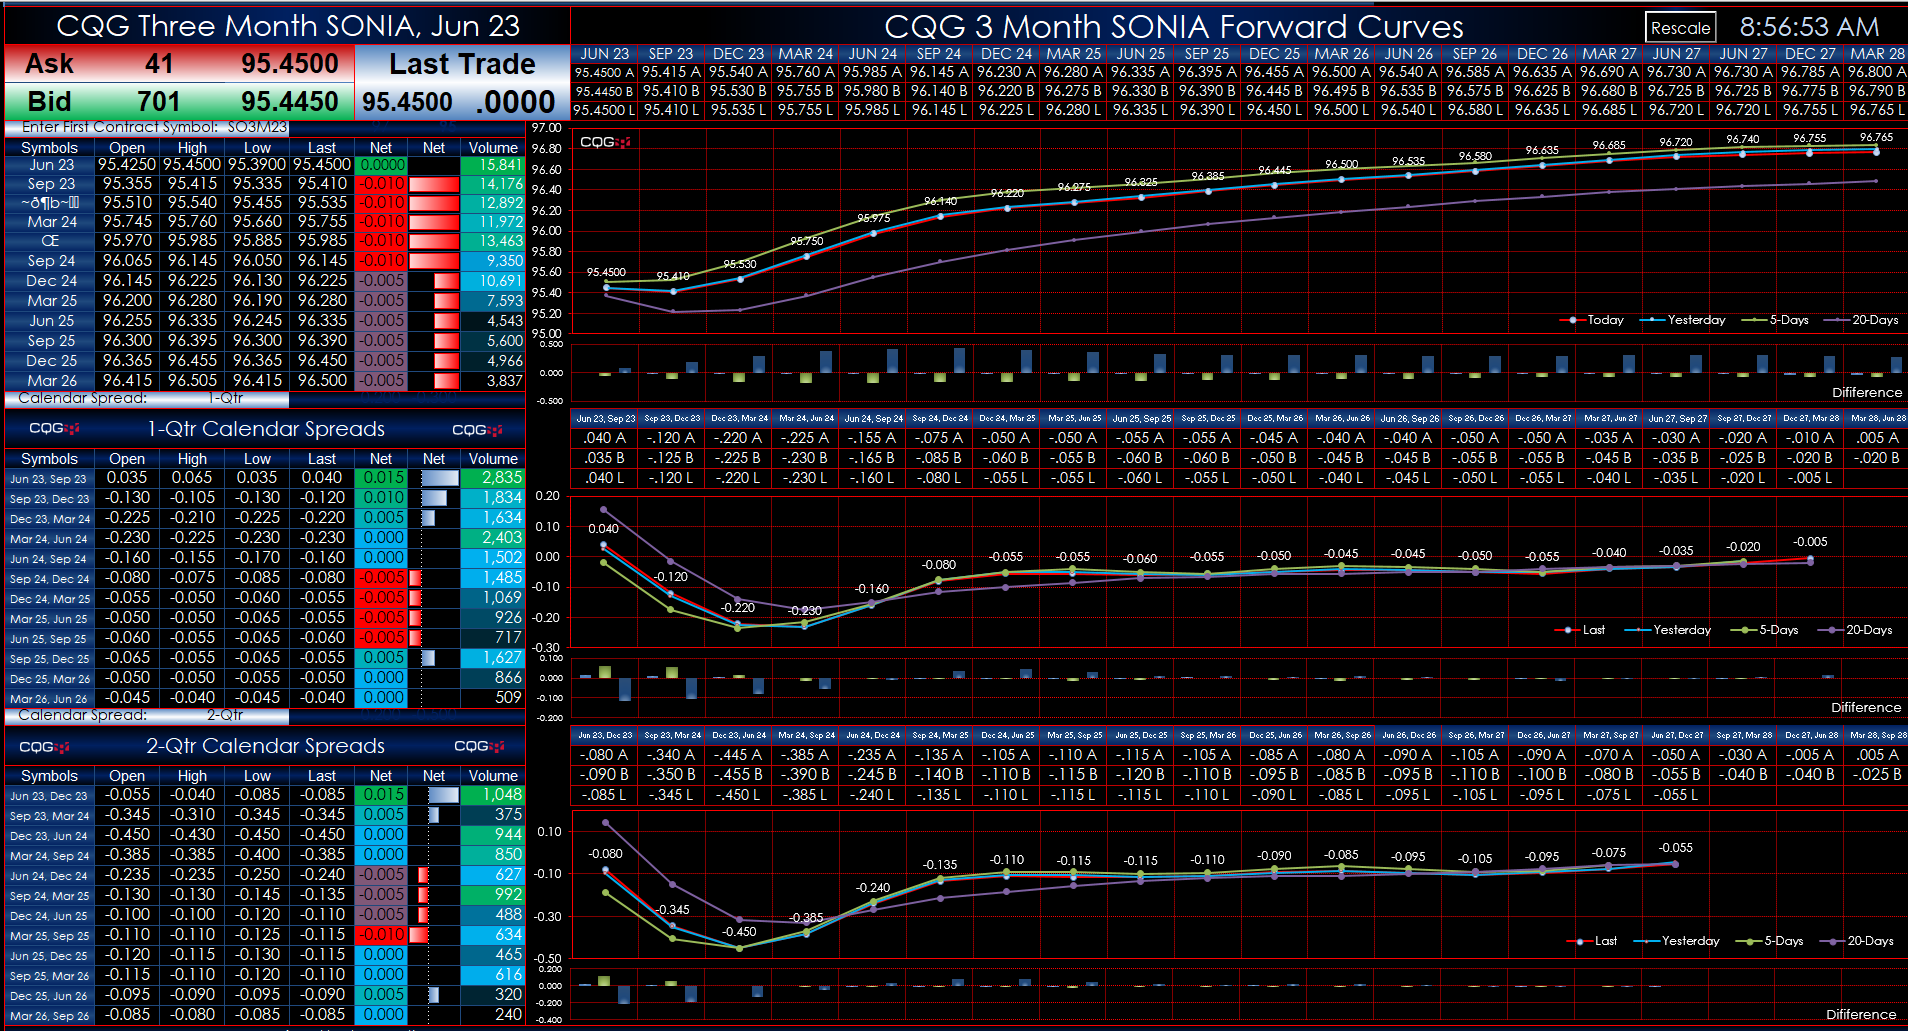
This Microsoft Excel® macro enabled dashboard pulls in the Three Month SONIA Index Futures Contract which is a cash settled future based on the interest rate on a three month sterling deposit.… more
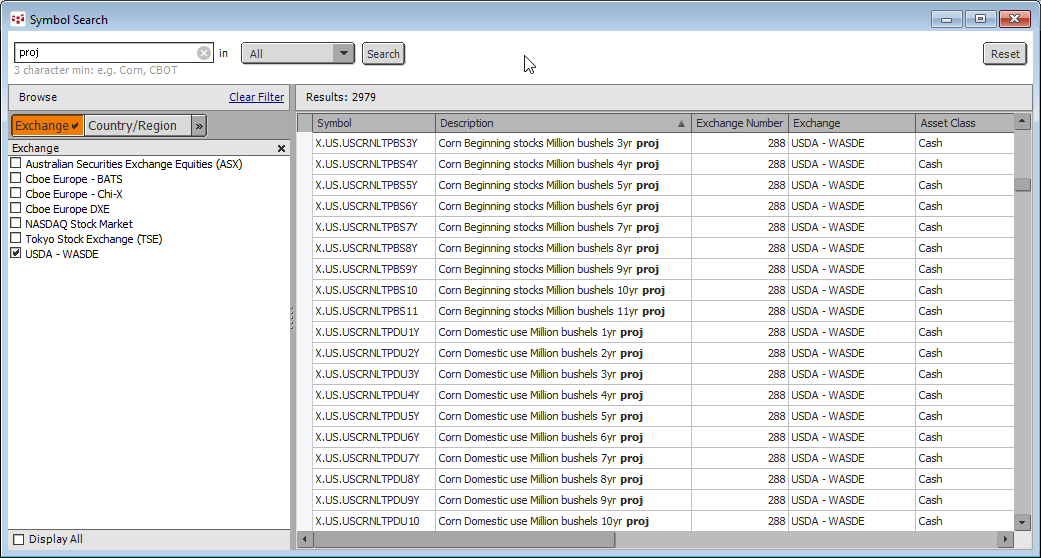
CQG's Data Quality team has added USDA WASDE Long-Term Projections to the data base. This data is published each February and the report provides projections for the agricultural sector out eleven… more
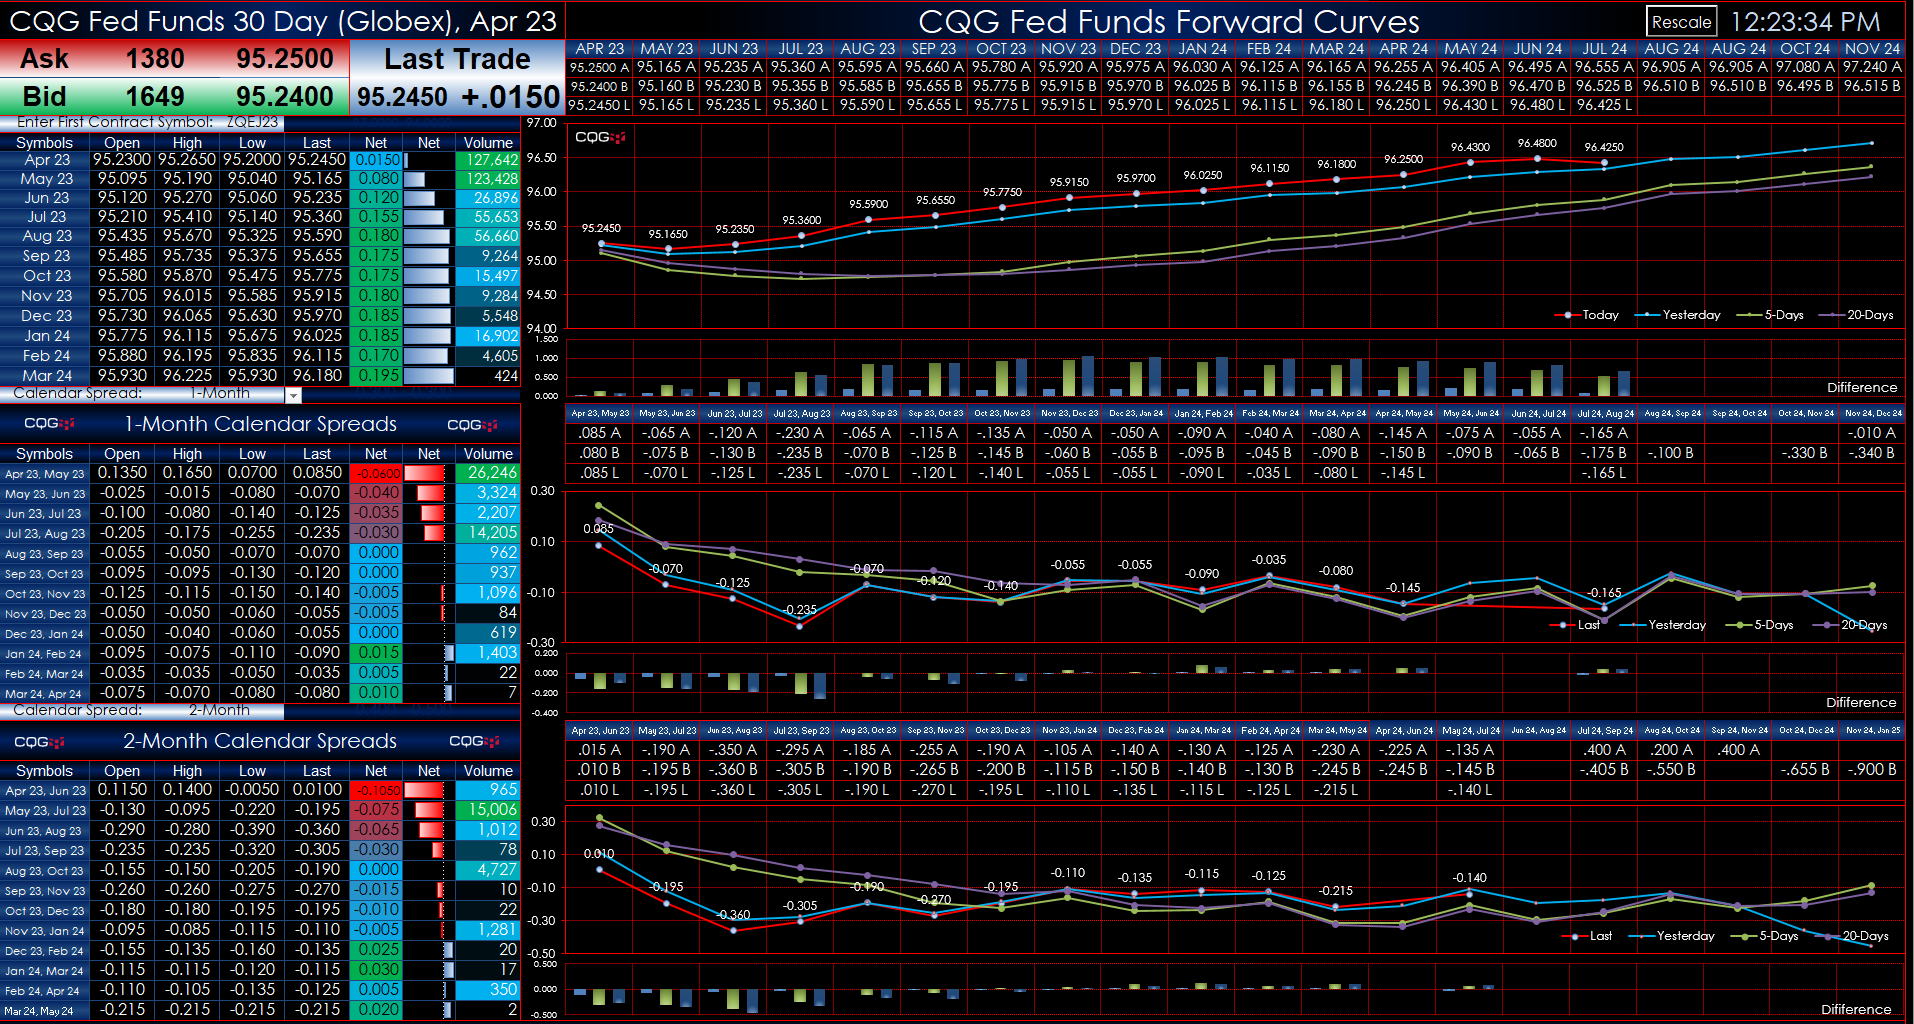
This Microsoft Excel® macro enabled dashboard pulls in the 30-Day Fed Funds market data traded on the CME Globex platform.
The Dashboard enables the user to enter in the symbol for the… more
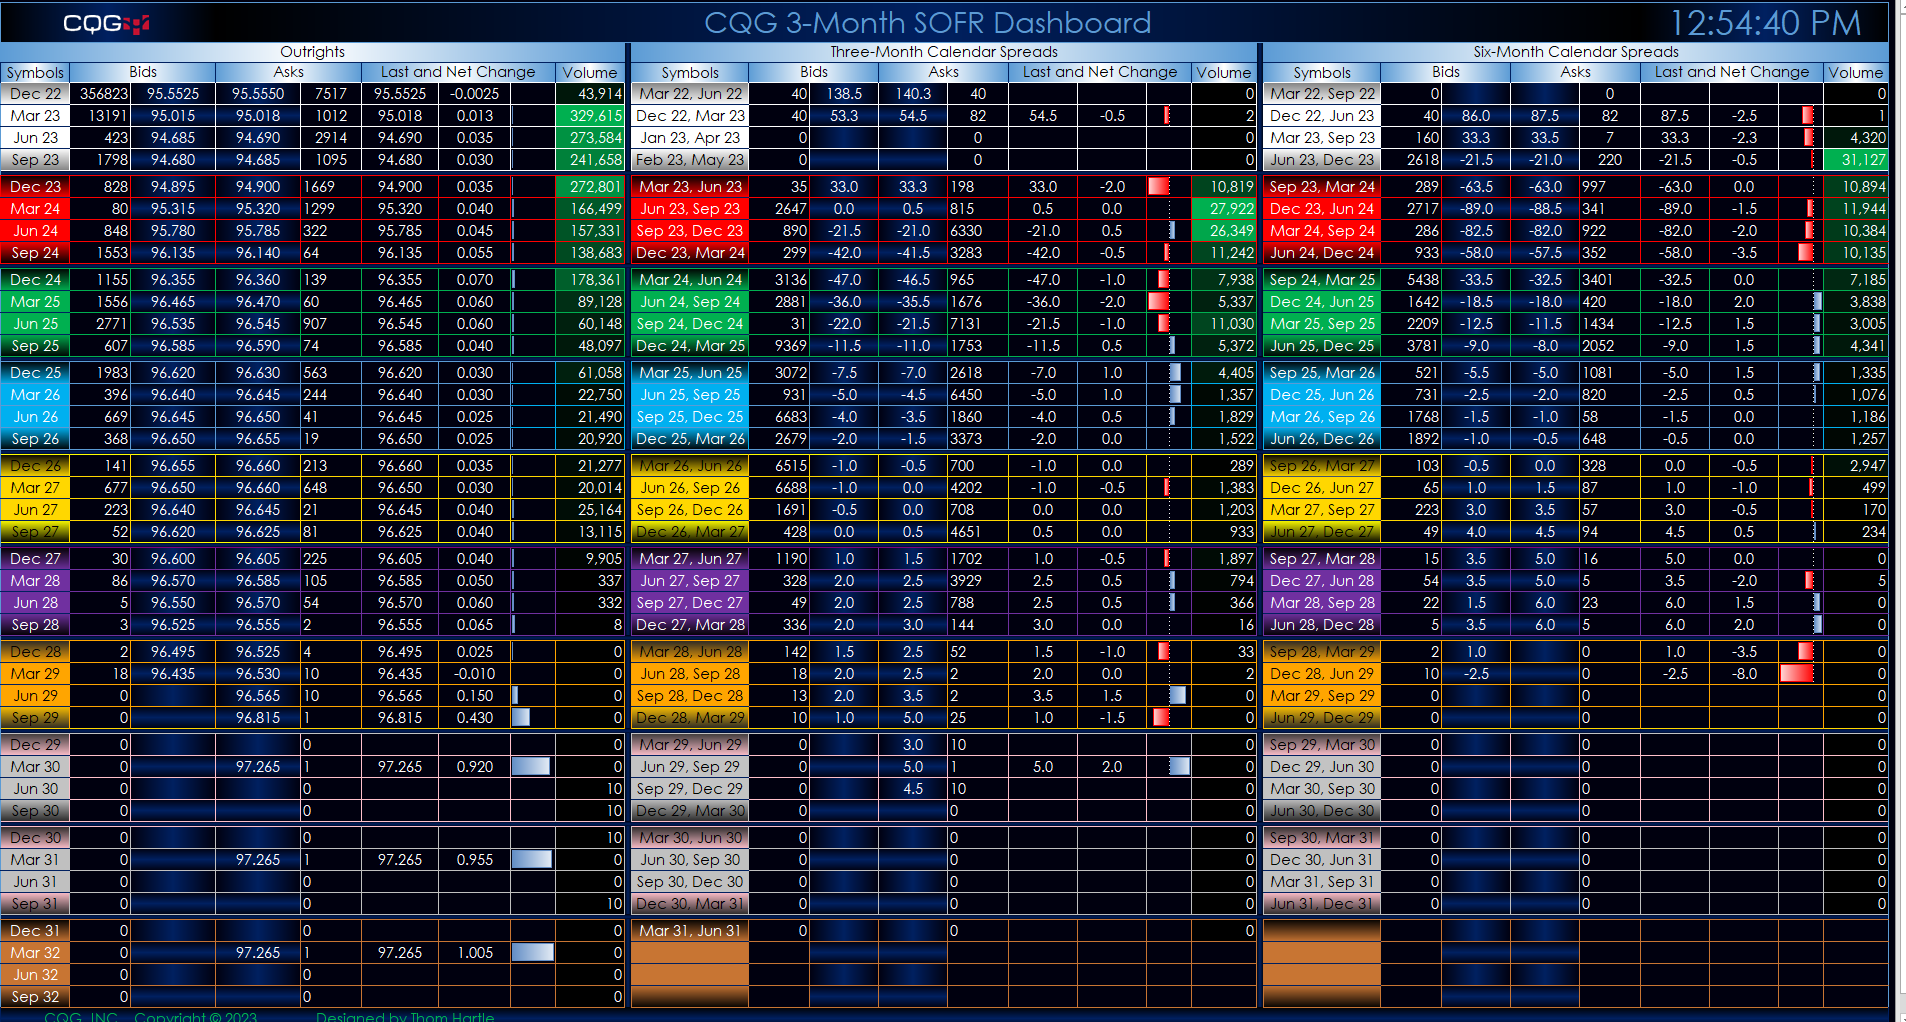
This Microsoft Excel® spreadsheet presents 3-Month SOFR market data. The data includes nearly ten years of quarterly contracts for outrights and exchange-traded three-month and six-month calendar… more
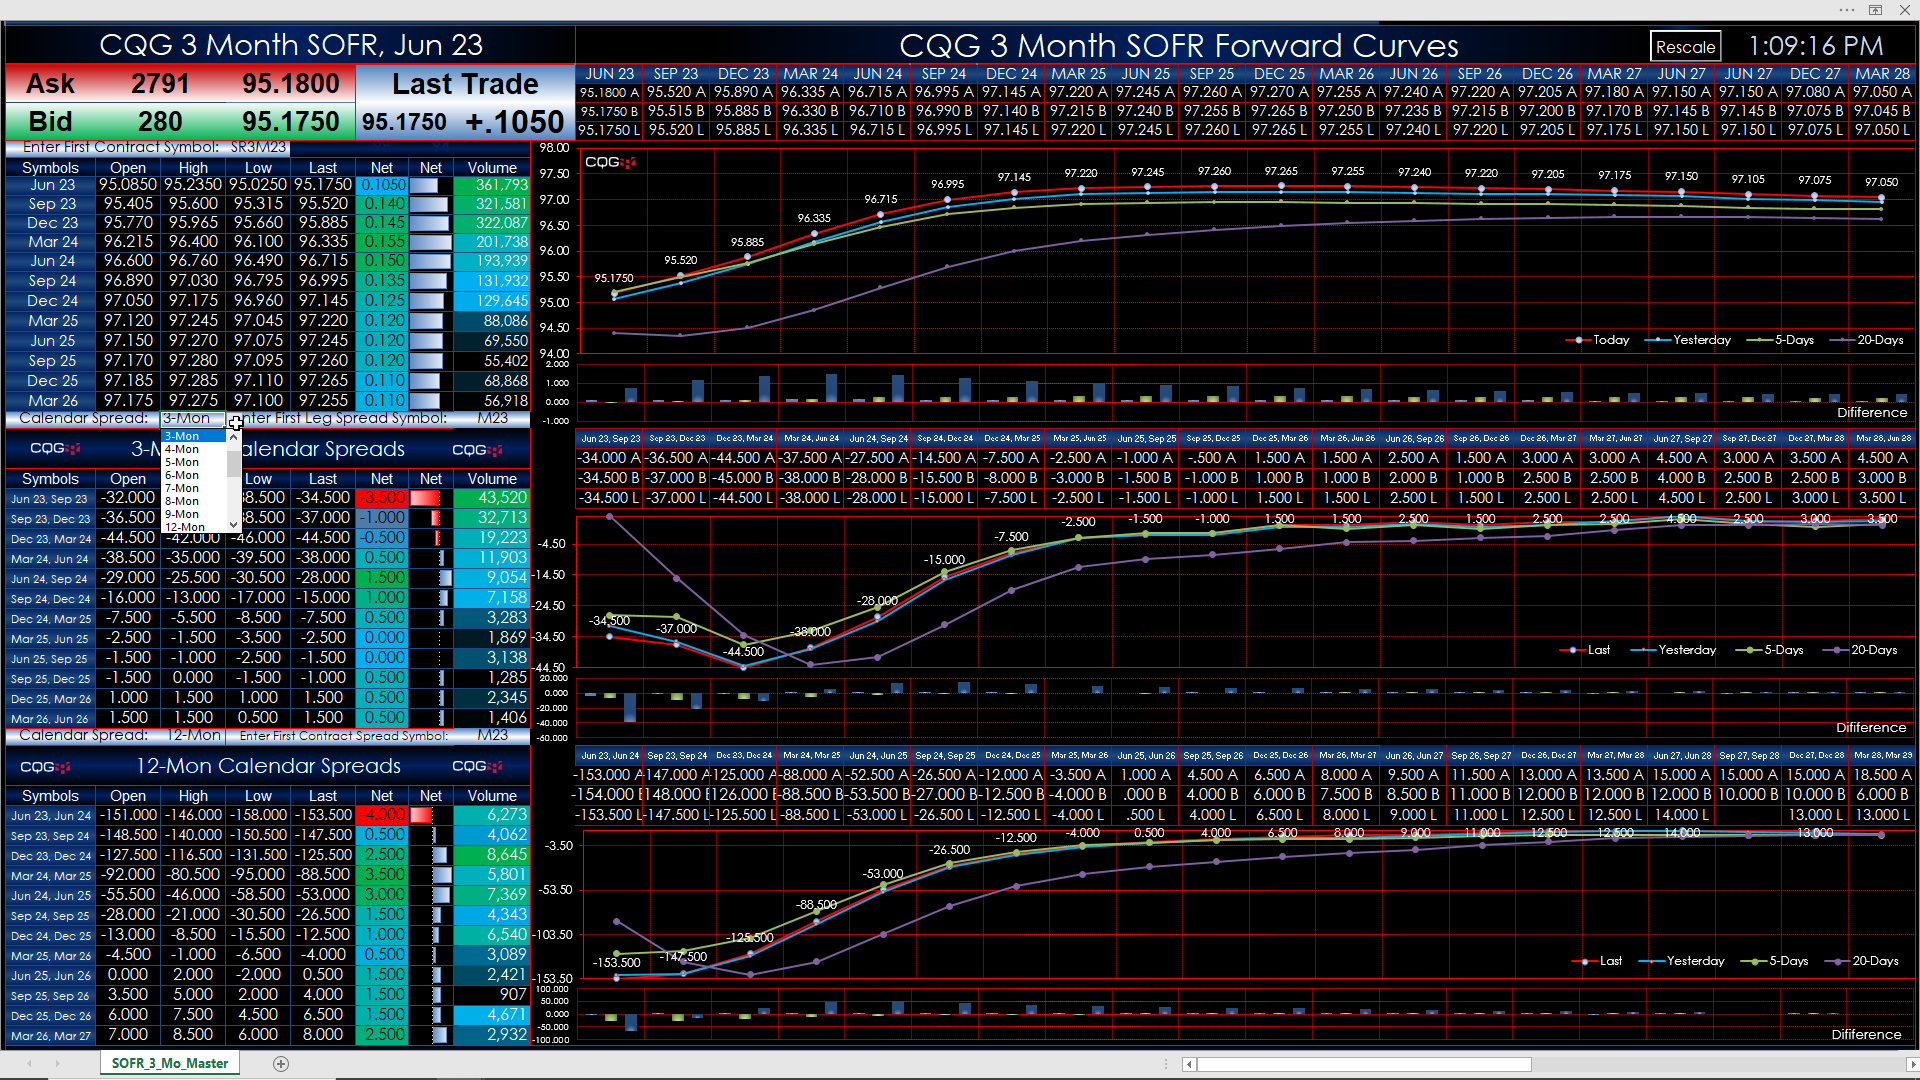
This Microsoft Excel® dashboard pulls in the 3-month SOFR market data traded on the CME Globex platform.
The Dashboard was updated to enable the user to enter in the symbol for the first… more
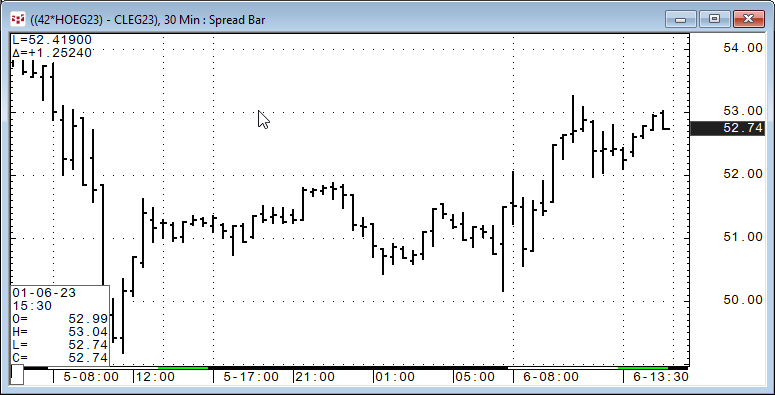
The Spread Bar chart displays spread bar values based on a user set parameter for snap shots at certain intervals.
This is a superior method to simply plotting the spread prices. For… more
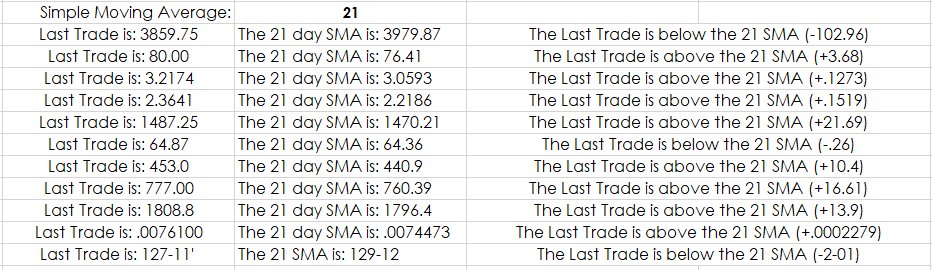
Microsoft® Excel has a Text function which is useful for combining text with market data. For example, you may want to have your Excel dashboard display in the same cell the percent net change… more
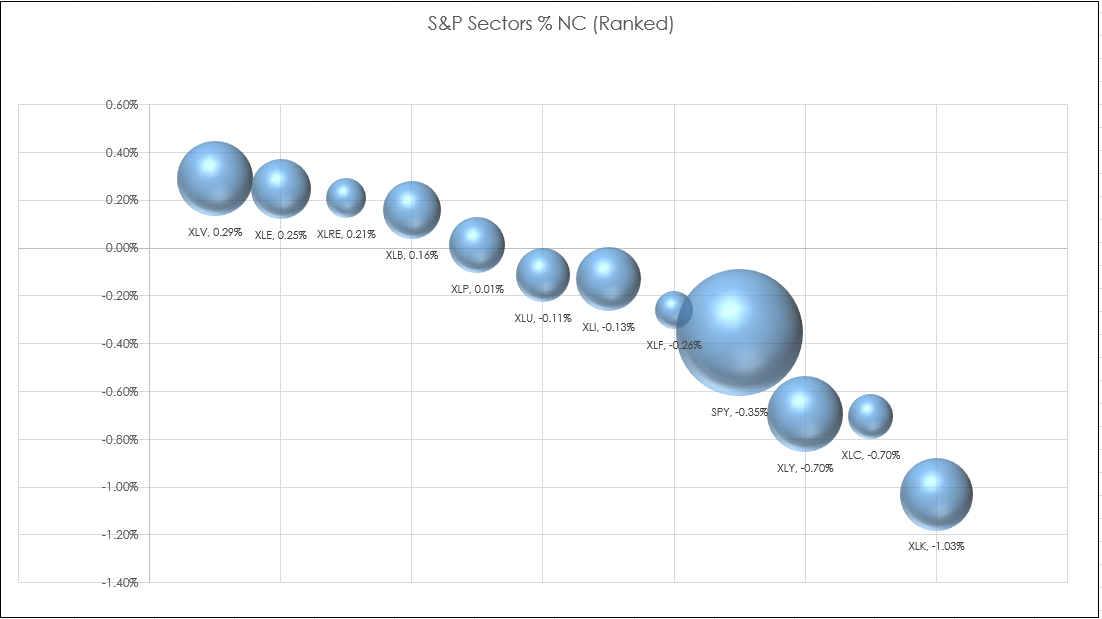
The Microsoft® Excel 3-D chart is different from the Excel Scatter Plot chart. The Scatter chart uses a fixed size for the chart data points. The 3-D chart accesses an additional column to set the… more