This post builds upon the previous post: Excel 365 TRIMRANGE Function.
That post detailed how to build a quote display using the TRIMRANGE function to automatically manage working with various lists of symbols.
This post offers at the end a downloadable Excel spreadsheet that utilizes that feature, too. This dashboard tracks the performance of the eleven sectors in the stock market in the top portion of the quote display. And the bottom portion of the display offers the ability to select a sector and see the current performance of the holdings of that sector.
The original Excel dashboard had a Symbols tab, Calculations tab, and a Display tab. This dashboard has a Symbols tab, individual tabs for each sector, a Calculations tab using the Symbols tab, a Sectors tab (set to use just the Sector symbols), and a Display tab. The Display tab combines the Sectors tab and the Calculations tab.

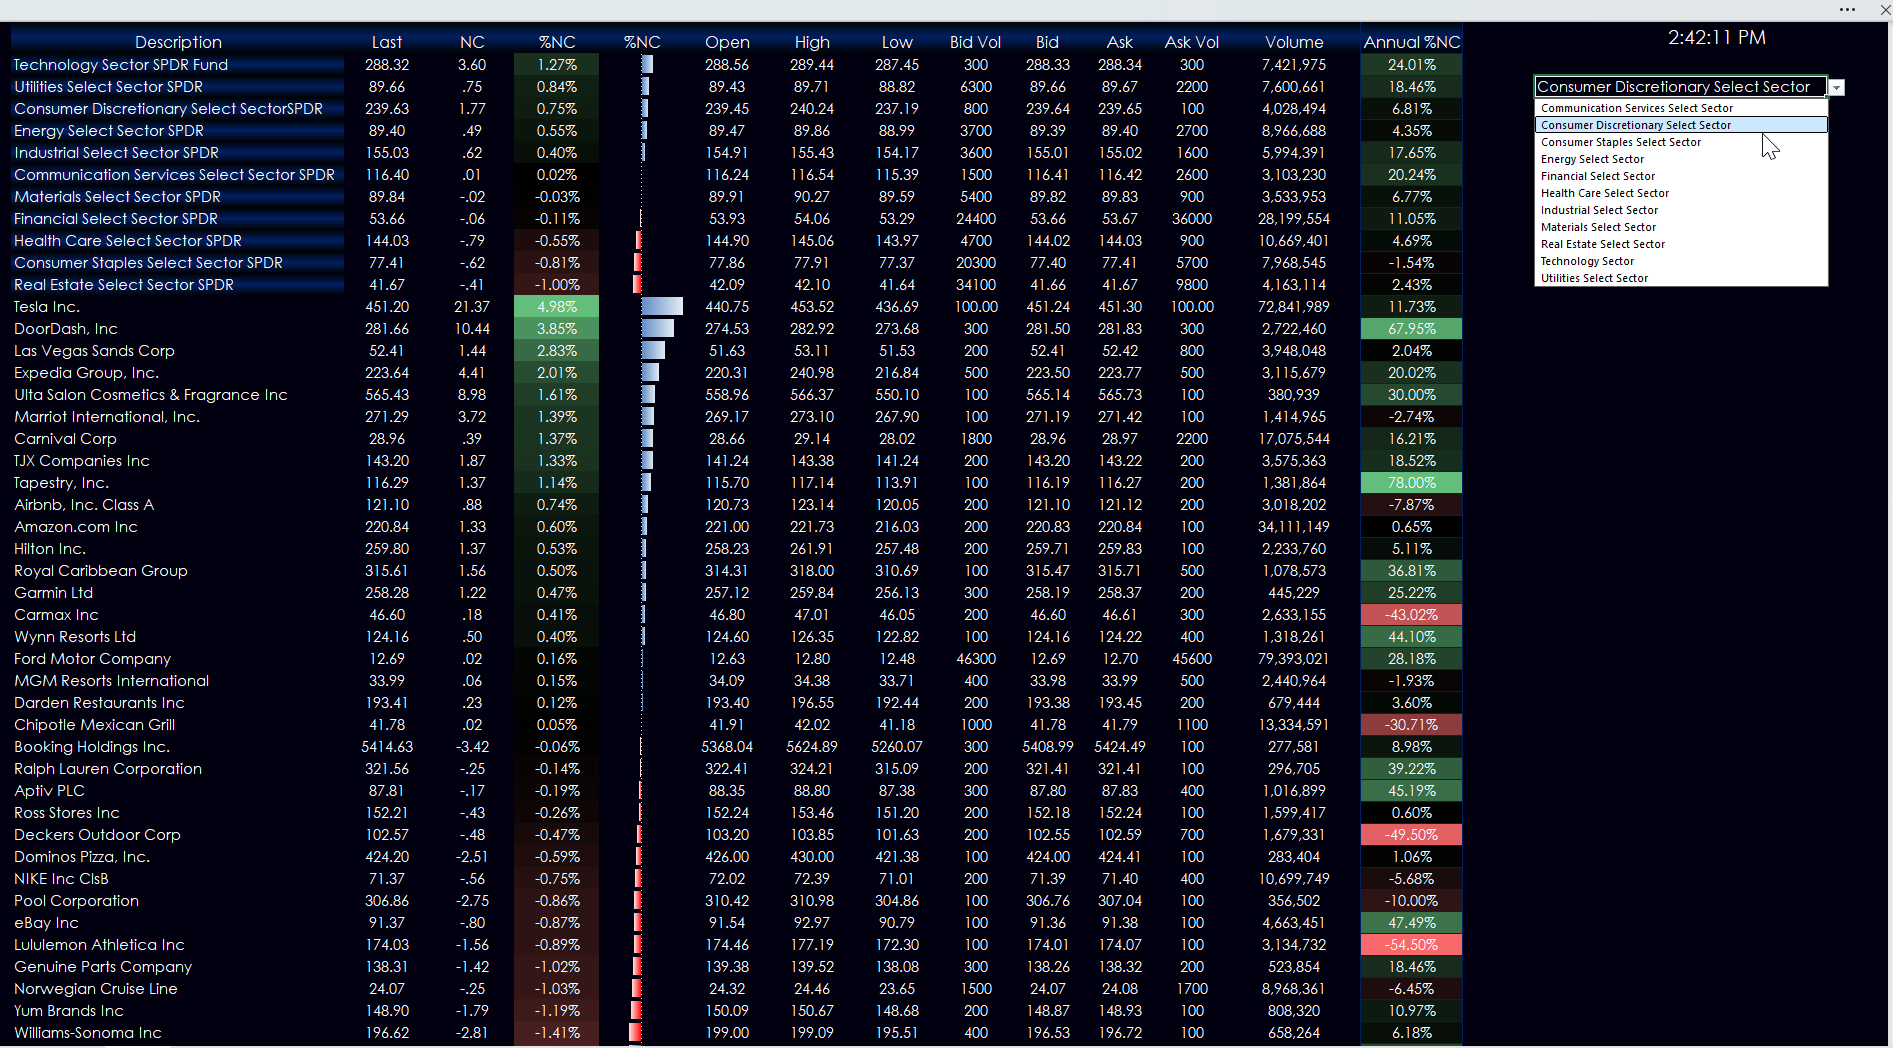
The image displayed below shows the today's performance of the eleven sectors and a portion of the Consumer Discretionary Select Sector.
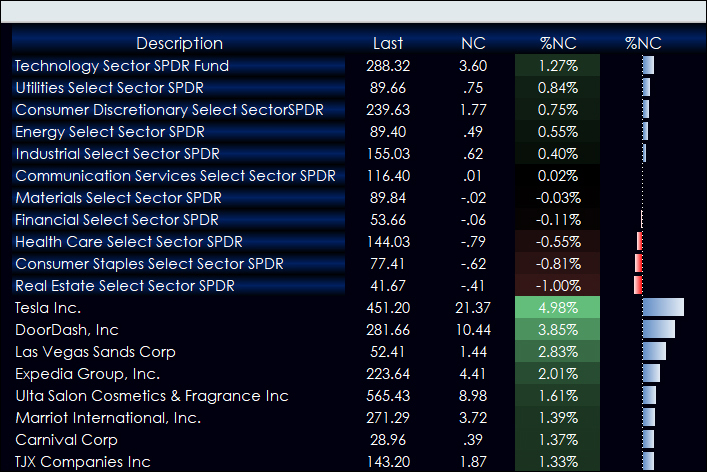
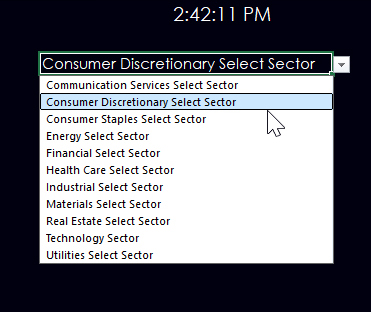
To the right of the Quote Display is a drop down menu to select the Sector.
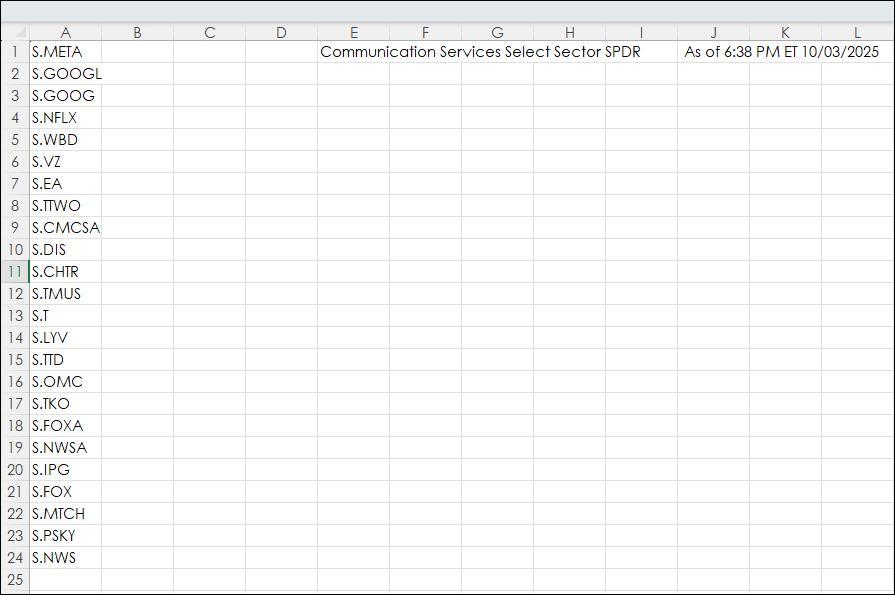
Each sector tab has symbols added from this web site: https://www.ssga.com/us/en/individual/capabilities/equities/sector-investing/select-sector-etfs
The “S.” needs to be manually added to the symbols.
The Symbols tab has this Excel formula in cell A2:
=IFS(Display!Q3="Communication Services Select Sector",XLC!A.:.A,Display!Q3="Consumer Discretionary Select Sector",XLY!A.:.A,Display!Q3="Consumer Staples Select Sector",XLP!A.:.A,Display!Q3="Energy Select Sector",XLE!A.:.A,Display!Q3="Financial Select Sector",XLF!A.:.A,Display!Q3="Health Care Select Sector",XLV!A.:.A,Display!Q3="Industrial Select Sector",XLI!A.:.A,Display!Q3="Materials Select Sector",XLB!A.:.A,Display!Q3="Real Estate Select Sector",XLRE!A.:.A,Display!Q3="Technology Sector",XLK!A.:.A,Display!Q3="Utilities Select Sector",XLU!A.:.A)
The formula checks for the sector selected from the dropdown list on the Display tab and returns the symbols for that sector. These symbols are used in Calculations tab.
The Display tab displays the Sectors' performance ranked and sorted by performance and the selected holding for the sector is ranked and sorted by performance.
The dashboard is not locked. The RTD formulas can be replaced.
Requires CQG Integrated Client or CQG QTrader, data enablements for the NYSE and Nasdaq stocks. Excel 365 or more recent locally installed, not in the cloud.