This post offers a downloadable CQG PAC for IC and QTrader and Excel dashboard that includes two custom studies that track a market's performance by measuring the price difference between the price and the 52 weeks high and the price difference between the 52 weeks low for the year.
The image below displays the performance DJIA with the two studies.
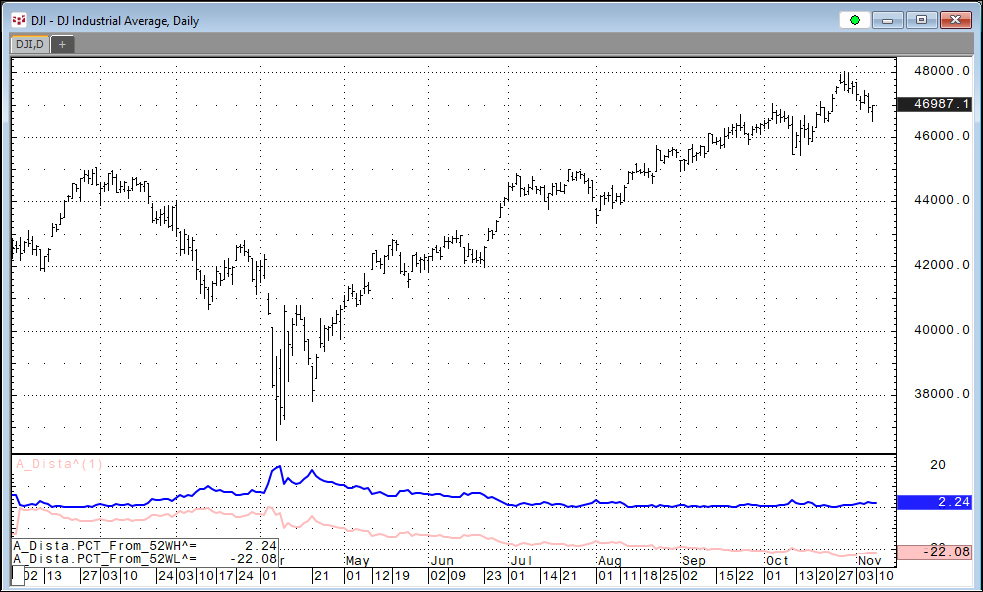
The maximum difference between the price and the 52-week high (the blue line) peaked in April and as the market rose to new highs the blue line dropped to near zero and the red line trended lower for the year (as of this writing).
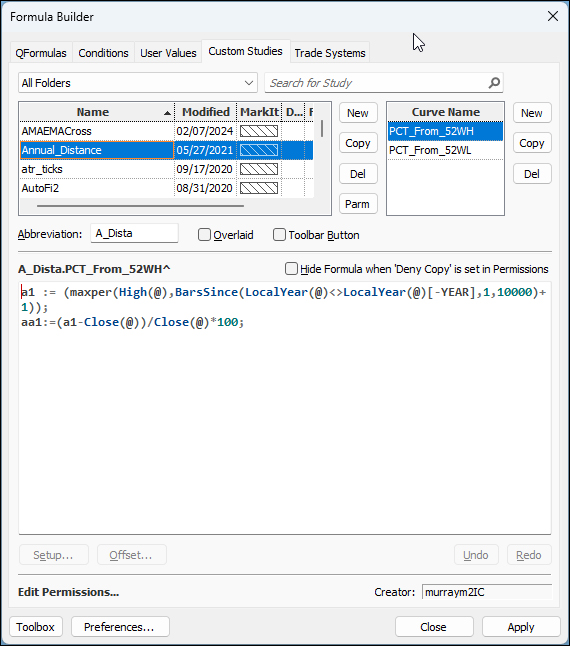
This image below is the custom study installed by the PAC.
The page installed in IC or QTrader displays a Quote Spreadsheet V2 with from the PAC is displayed below. The two custom studies are to the right in the QSS and the final column is the annual percentage net change. There are three main stock indices, the 30 stocks comprising the DJIA, and a miscellaneous section.
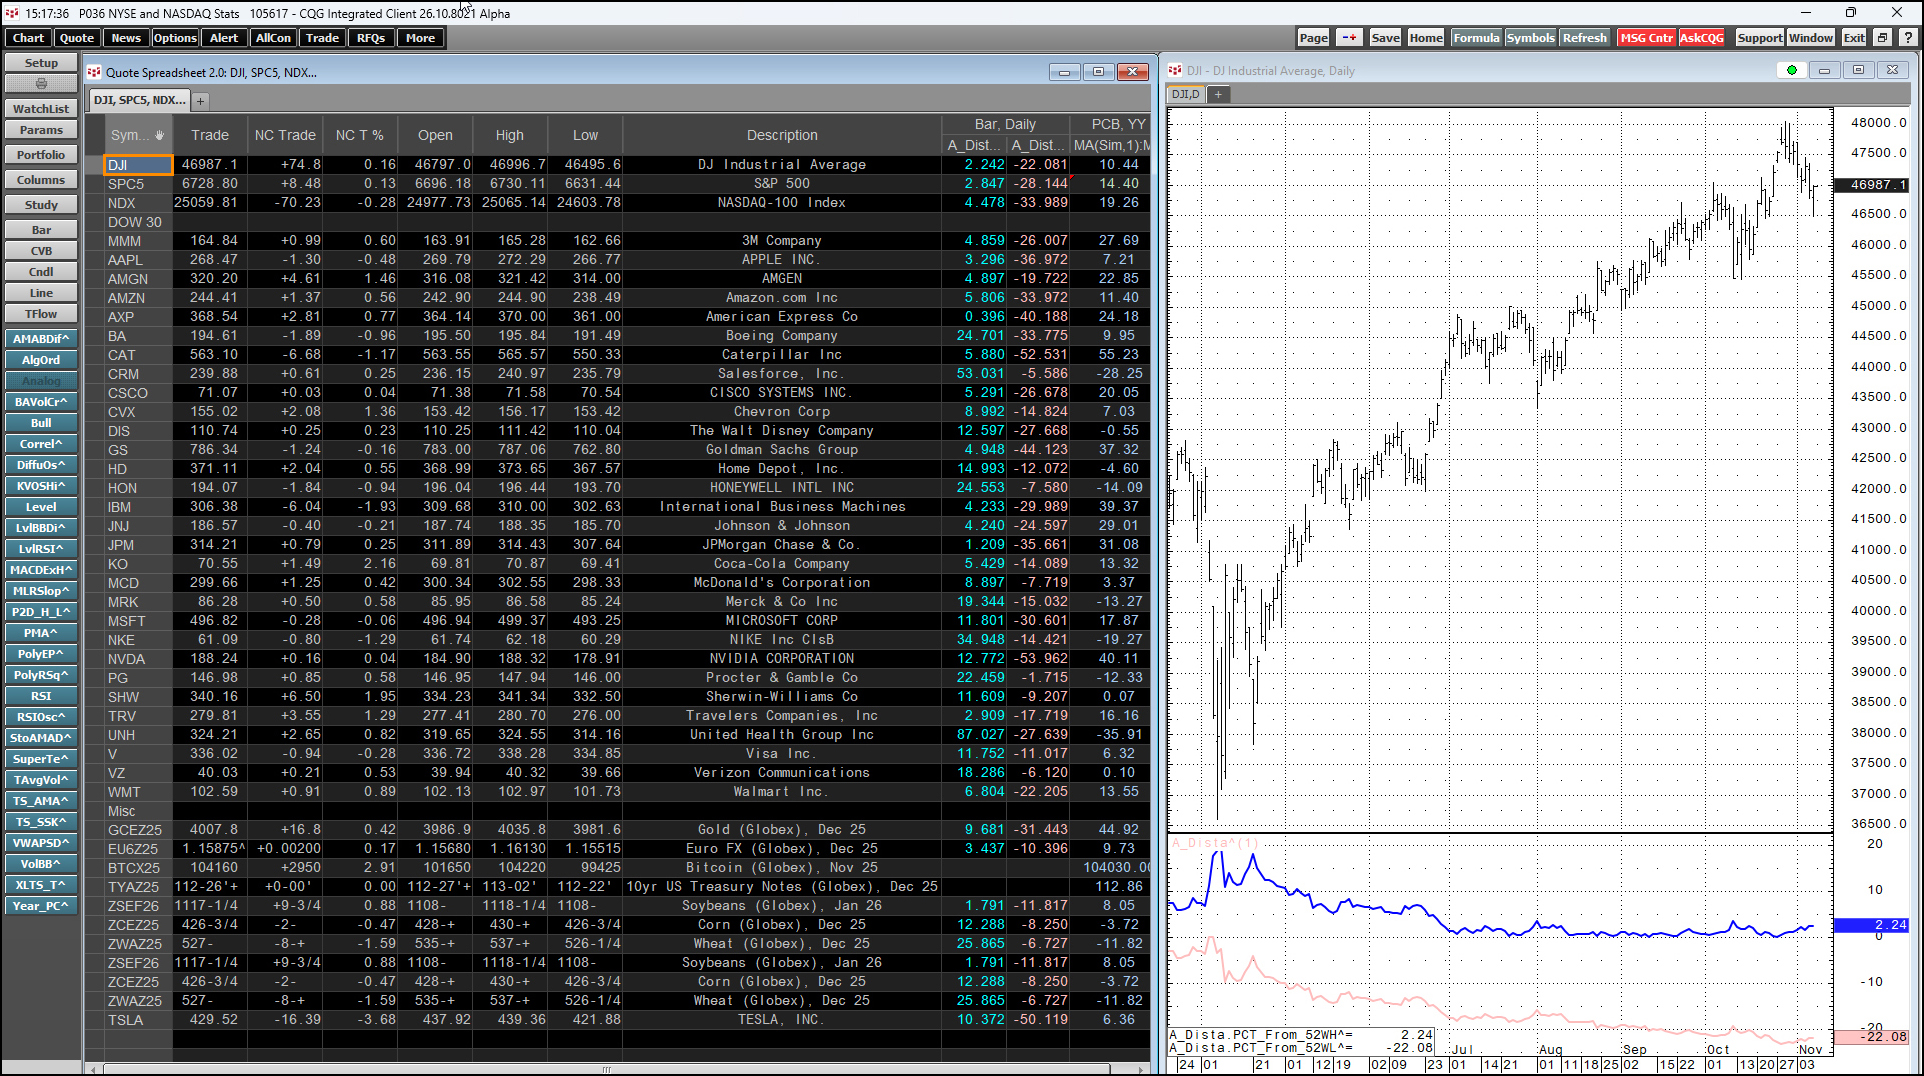
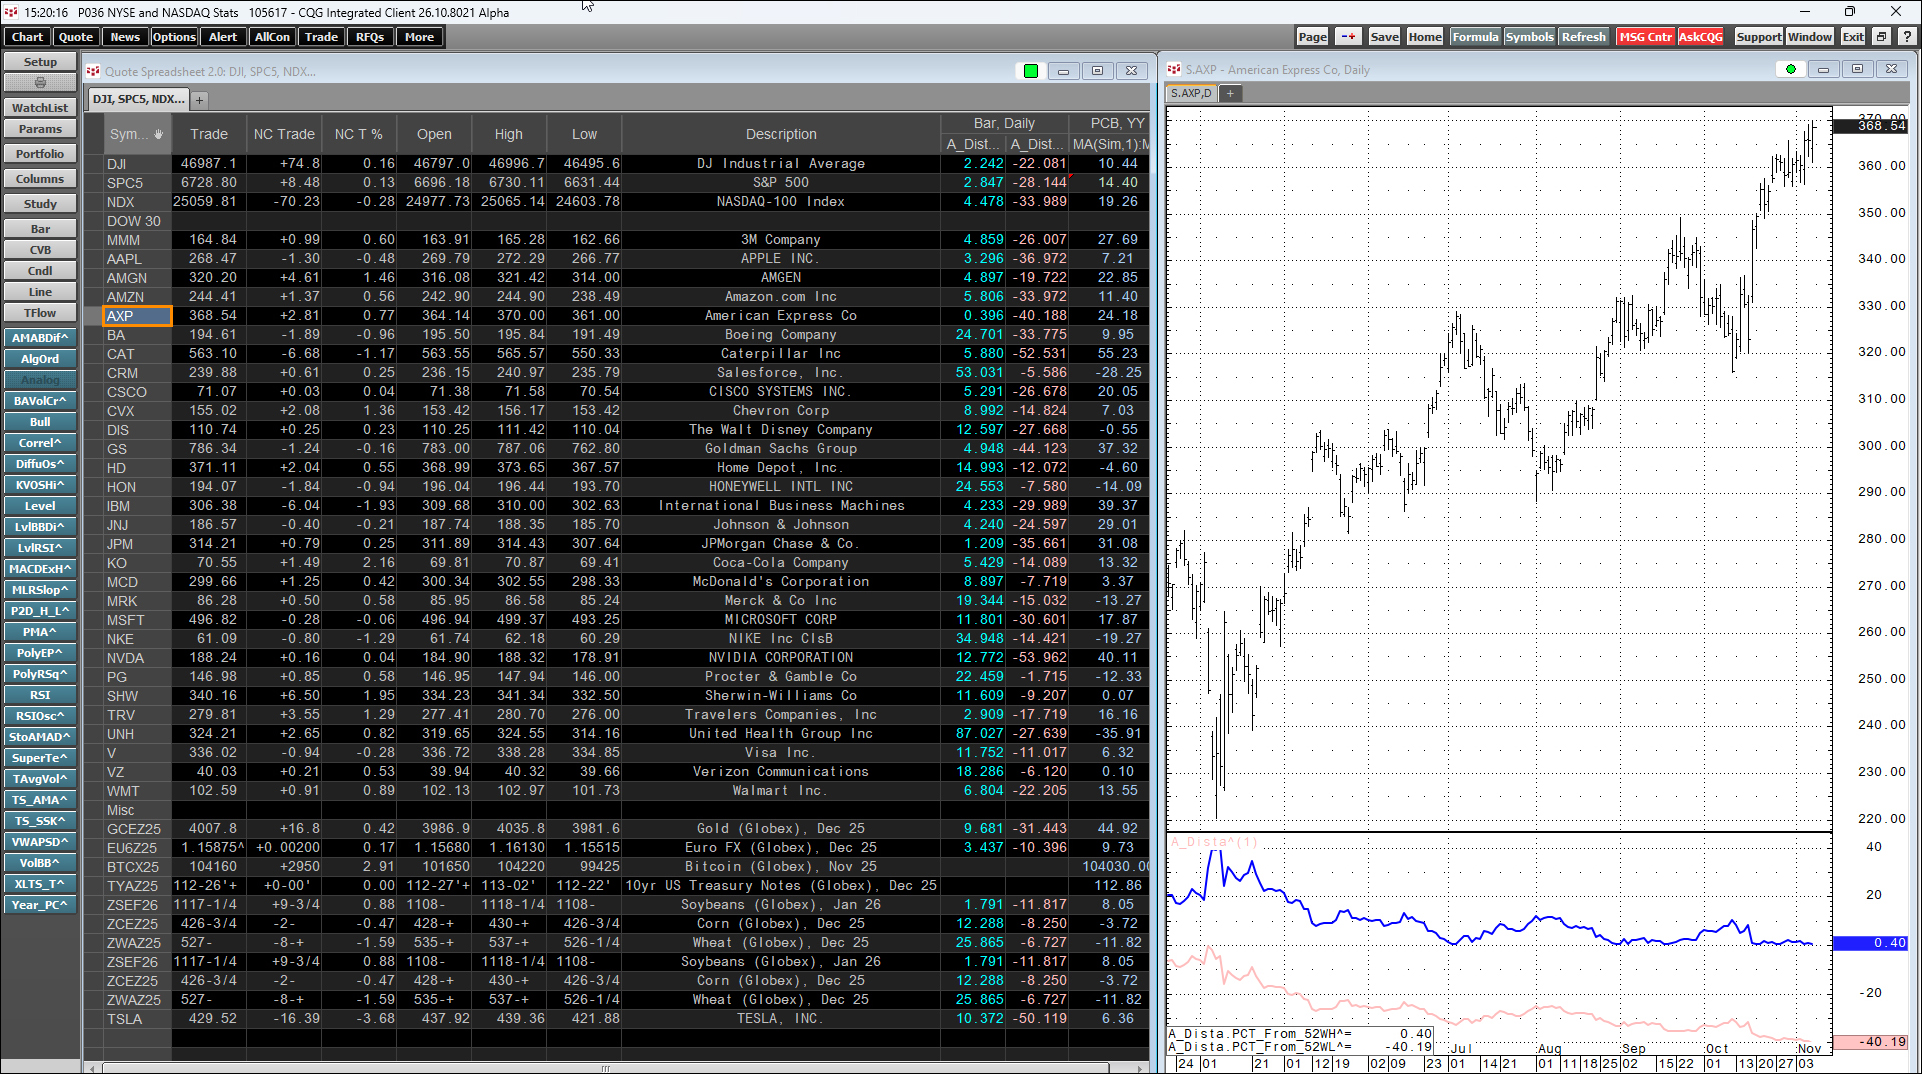
In comparing the DJIA performance (currently 2.24% below its 52-week high) to the 30 stocks we see that American Express (currently 0.396% below its 52-week high) is closer to its 52-week high.
Next is JP Morgan Chase which is currently 1.21% below its 52-week high.
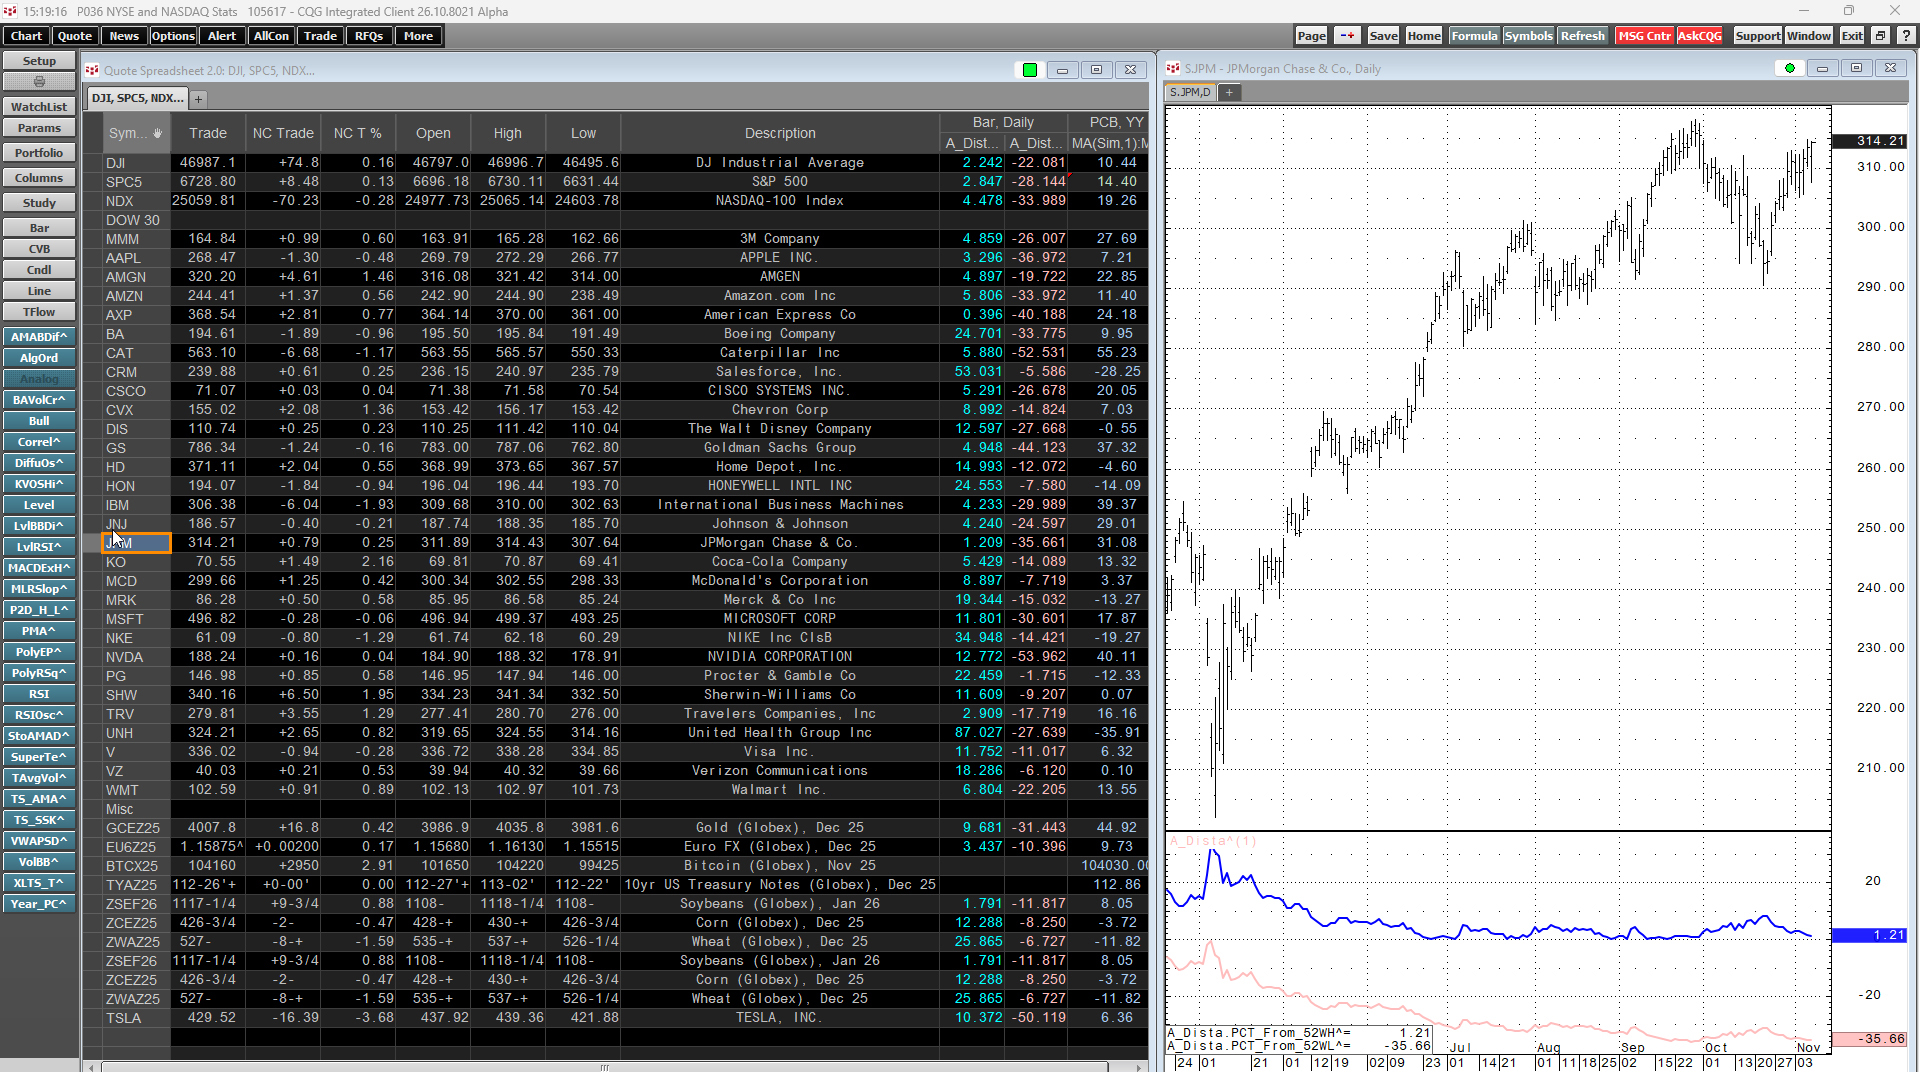
These two stocks are the leaders within the group.
These two custom study values can be pulled into Excel using these two RTD formulas:
=RTD("cqg.rtd",,"StudyData","JPM", "A_Dista^",,"PCT_From_52WH","D",,,,,,"T")/100=RTD("cqg.rtd",,"StudyData","JPM","A_Dista^",,"PCT_From_52WL","D",,,,,,"T")/100A downloadable Excel sample is at the bottom of the post.

Requires CQG Integrated Client or CQG QTrader, and Excel 2016 or more recent locally installed.