The Accumulation/Distribution Study and the Chaikin Oscillator were introduced in the post titled CQG Primer: The Chaikin Oscillator.
The Chaikin Oscillator is the difference between two exponential moving averages of the Accumulation/Distribution (A_D) Study. The default settings for the oscillator are 3- and 10-day EMAs.
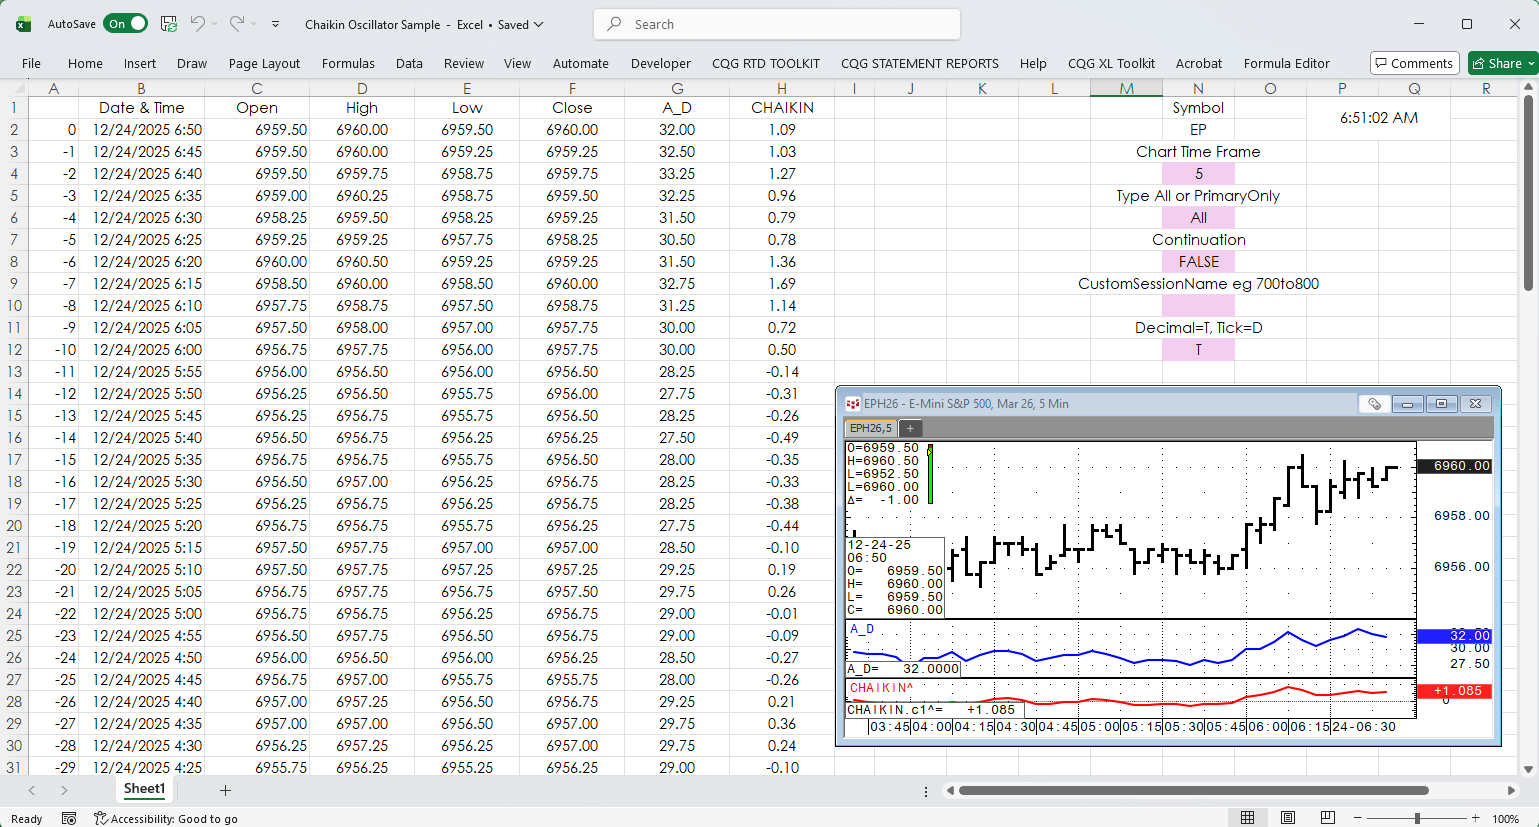
These two RTD formulas pull in the values from CQG:
=RTD("cqg.rtd",,"StudyData",$N$2, "A_D","", "A_D", $N$4, $A2, $N$6,$N$10,,$N$8,$N$12)=RTD("cqg.rtd",,"StudyData",$N$2, "CHAIKIN^","", "c1", $N$4, $A2, $N$6,$N$10,,$N$8,$N$12)The symbol is in cell $N$2 and the time frame is in cell $N$4 in the downloadable sample at the bottom of the post.
The Chaikin Oscillator uses the parameters applied to the study CQG IC or QTrader.
Requires CQG Integrated Client or CQG QTrader, and Excel 365 or more recent locally installed, not in the cloud.