The ability to merge Profiles was a quantum leap in my understanding of Price, Time and Volume and I had the fortune to be able to use Stedlmeyers Capflow software which allowed the creation. However, whilst the software had the ability to automatically merge how it saw fit, I was conscious of the need to devise my own structure. Up to that point my ability to merge was limited to the 5-day theory, but it was a logical step to simply duplicate that to another Profile and then add each day as it came in. Once again this presented a problem as to whether the start point was correct.
Already armed with some of my early Divergence based creations which looked to signal significant turning pints, if a pattern appeared that potentially indicated this, this would be the start point of the new Profile. The previous Profile acted as a reference point to where important supports and resistance lie, that the new trend would need to overcome. Therefore I had the analysis of the current new trend weighed up against the previous. The second point of reference was if price respected one of my Weekly or Monthly Peak Range or Expansion levels.
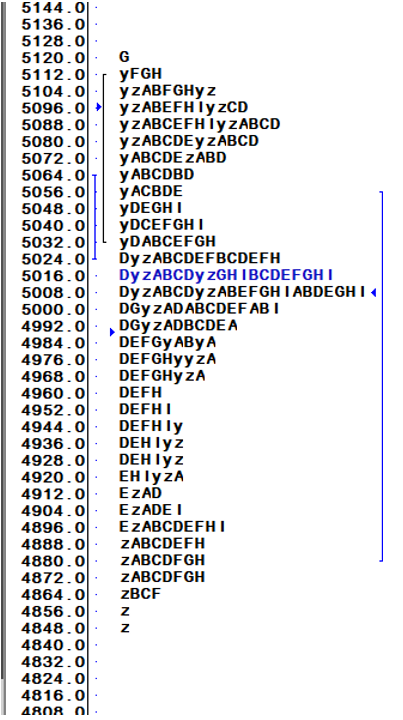
I had long ago abandoned TPO counts as white noise and no longer took much notice of a single days Profile pattern. My focus was on the Original Pit Hours, the relationship between Today's Opening and Yesterdays Close and Gaps, The Point of Most Time (Control Point or Fair Value) of the current and previous trend, Ledges of Time that normally formed either side of the POMT, Vacuum Points which were zones or areas where there was no time (Single Letters Prints on Short-Term Profiles and Zones of relatively little time on longer-term ones).
In contrast to historical and intraday charts where I use Equalised active contracts so that supports and resistance change with each rollover, on Profile I do not equalise but simply use active. The reason for this is if back adjust history on Profile you lose the sub-conscious knowledge that the market has, the most important being the Point of Most Time which is the most felt happy to trade.
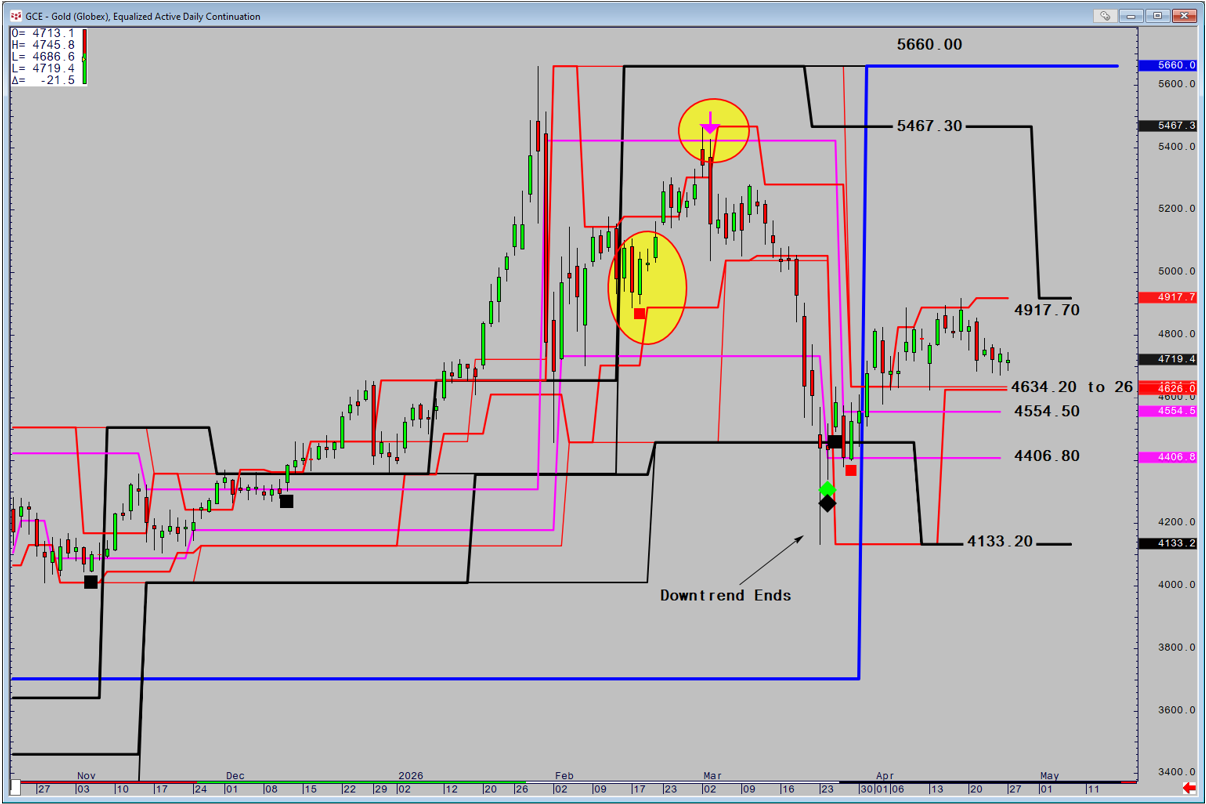
Using Gold as case study we begin on February 2nd where the previous day had seen price collapse before creating a large spike lower that respected the weekly support (black line) on a closing basis. I did not receive a pattern on that day.
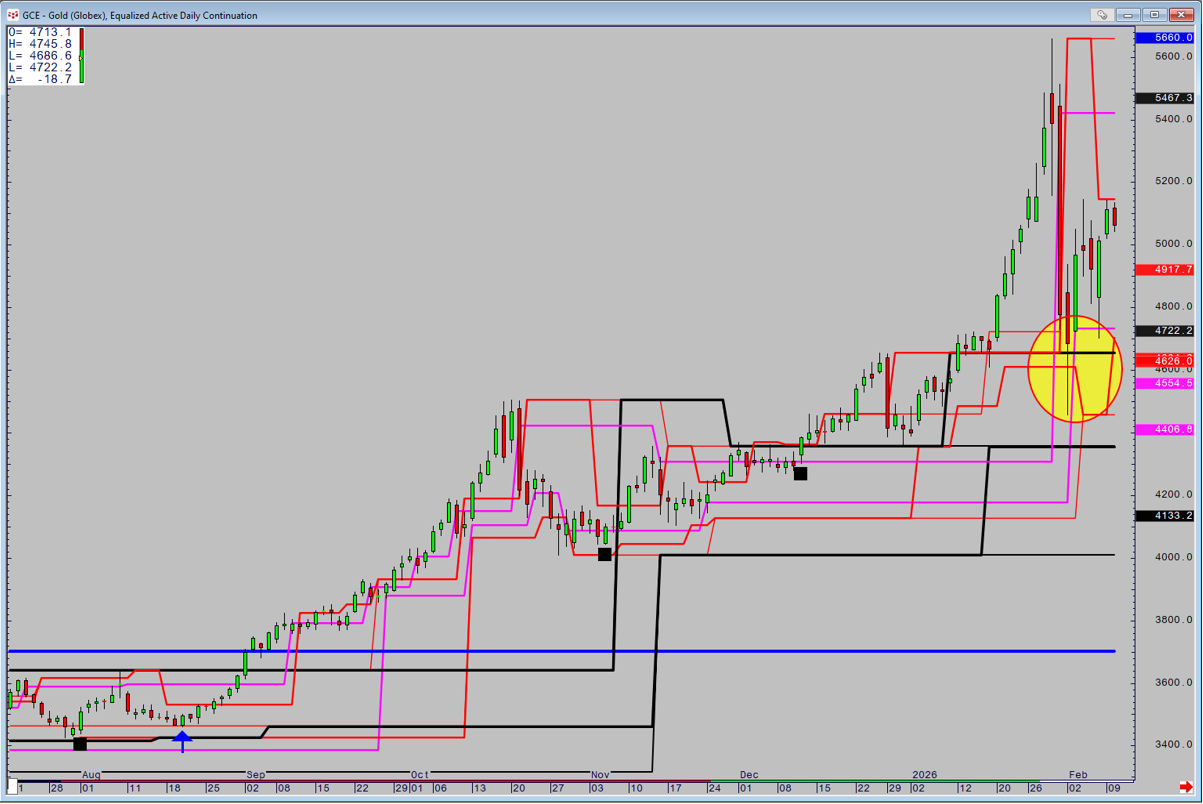
The next sign that a low is in place is 3 days later on the 5th when the low is directly at the bottom of the Gap created on the 2nd/3rd.
This means that I can begin building a new Profile from that low.
Price does rally but in a very choppy fashion before a positive pattern appears on the 18th.
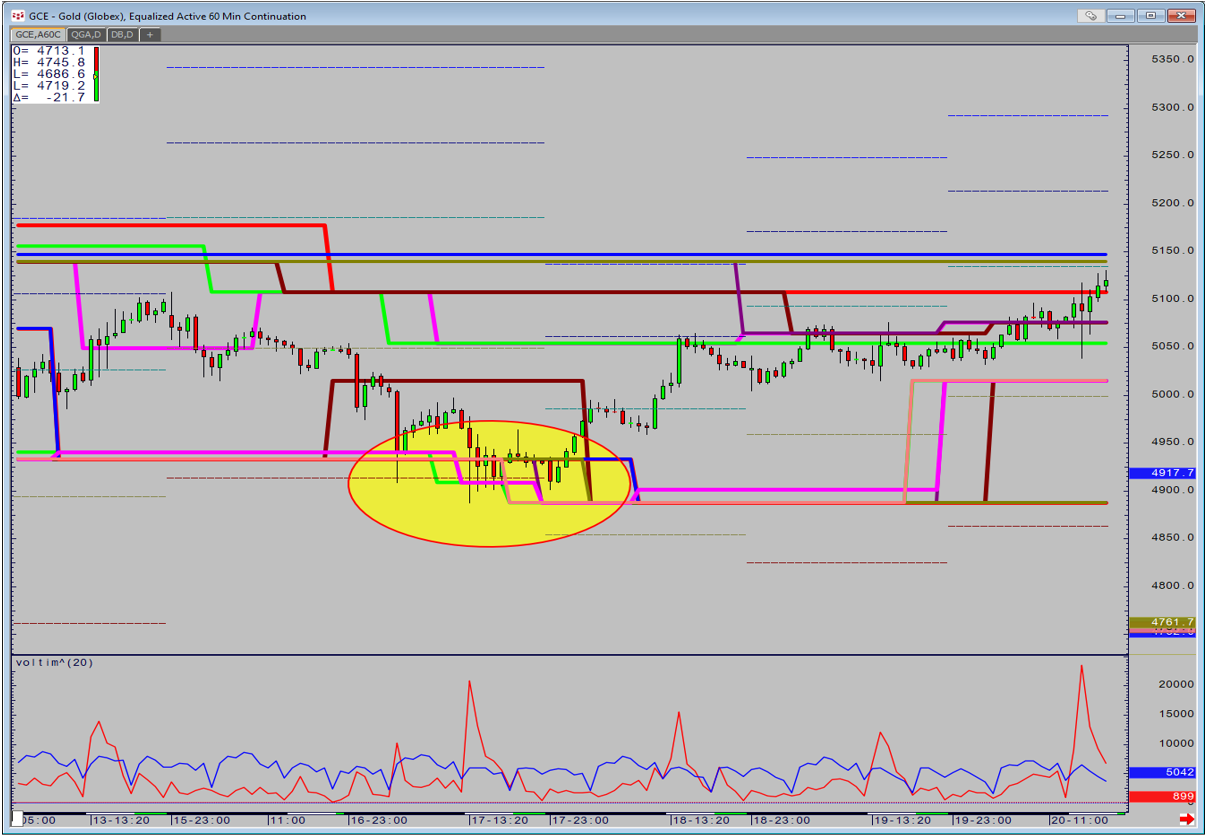
Analysis of the short-term chart shows that it held support the previous day.
However on the Merged Profile the picture is less rosy as price is below the Pomt, whilst the 5 Day Pit Only is almost perfectly balanced as it closed at the POMT and the midpoint of the 5-day trend is almost at the same price. The conclusion is that we are in a sideways market with a positive bias, but it has still to prove itself.
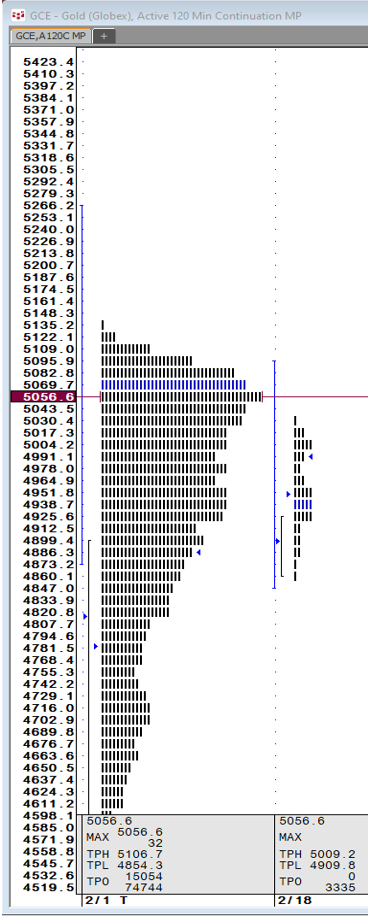
2 days later the bias shifts to up as the 5 -day profile Pomt is respected and the merged has relieved the previous top-heavy nature and the low is the Pomt. Finally on the short-term chart we close above the final zone above.
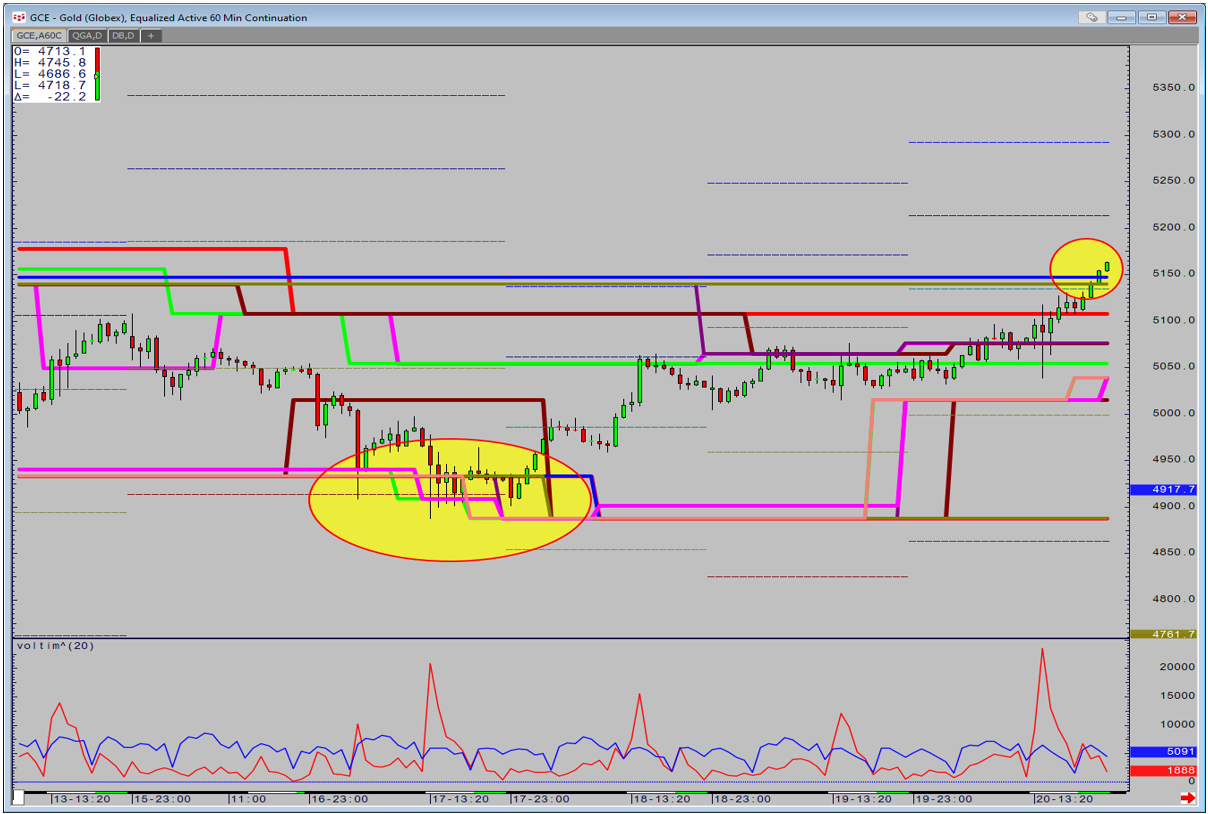
In the coming days progress is slow, but price does hold the original breakout point with volume 3 times the average for the time of day before extending higher.
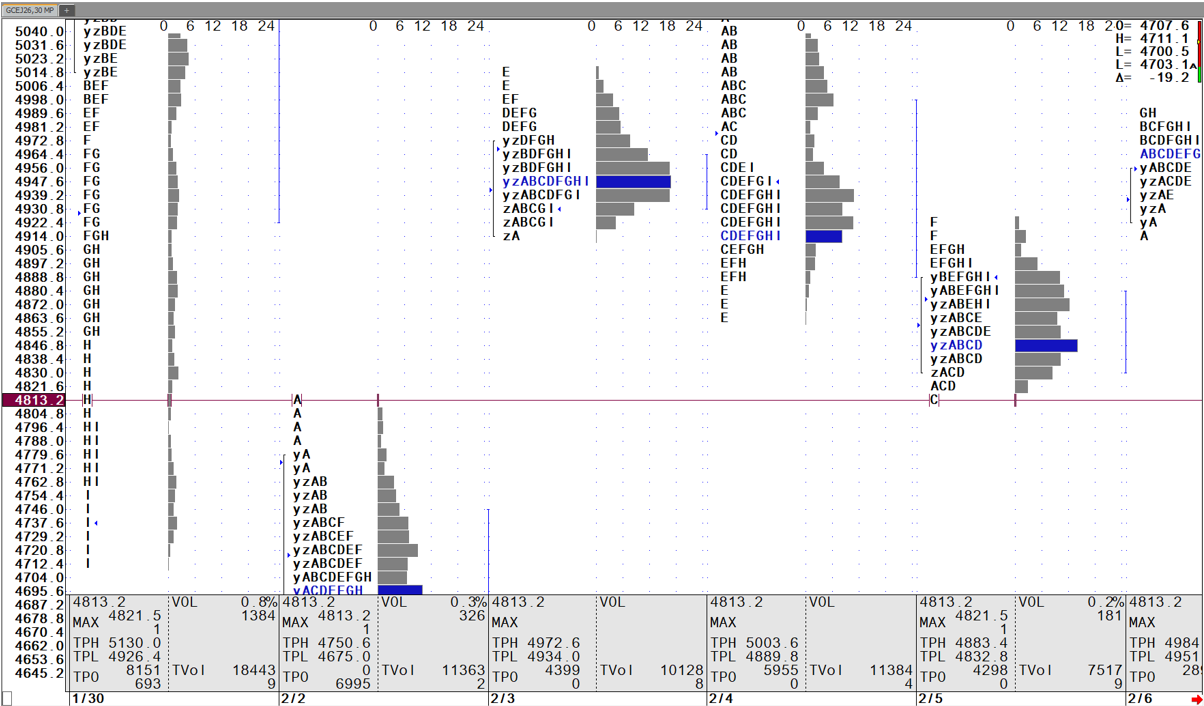
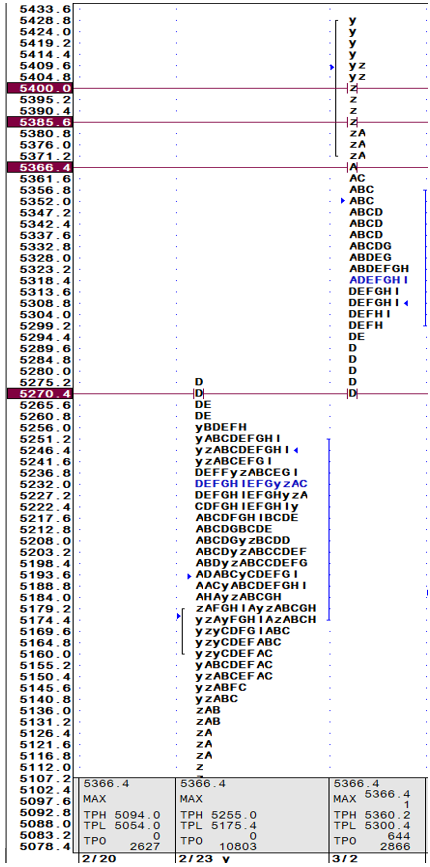
The first signs of trouble appear on March 2nd. Price gapped higher on Sunday on War developments, but by the time of the Pit Opening a multitude of negatives appear. The Opening drive in Y is rejected and by the end of A, a negative vacuum has appeared between 5400 and 5385. Another negative appears after B with a Single A indicating initiative selling at 3 sperate occasions. The obvious downside target is the Gap which it reaches quickly by D but the close is uninspiring. A classic case of Good News Bad Action.
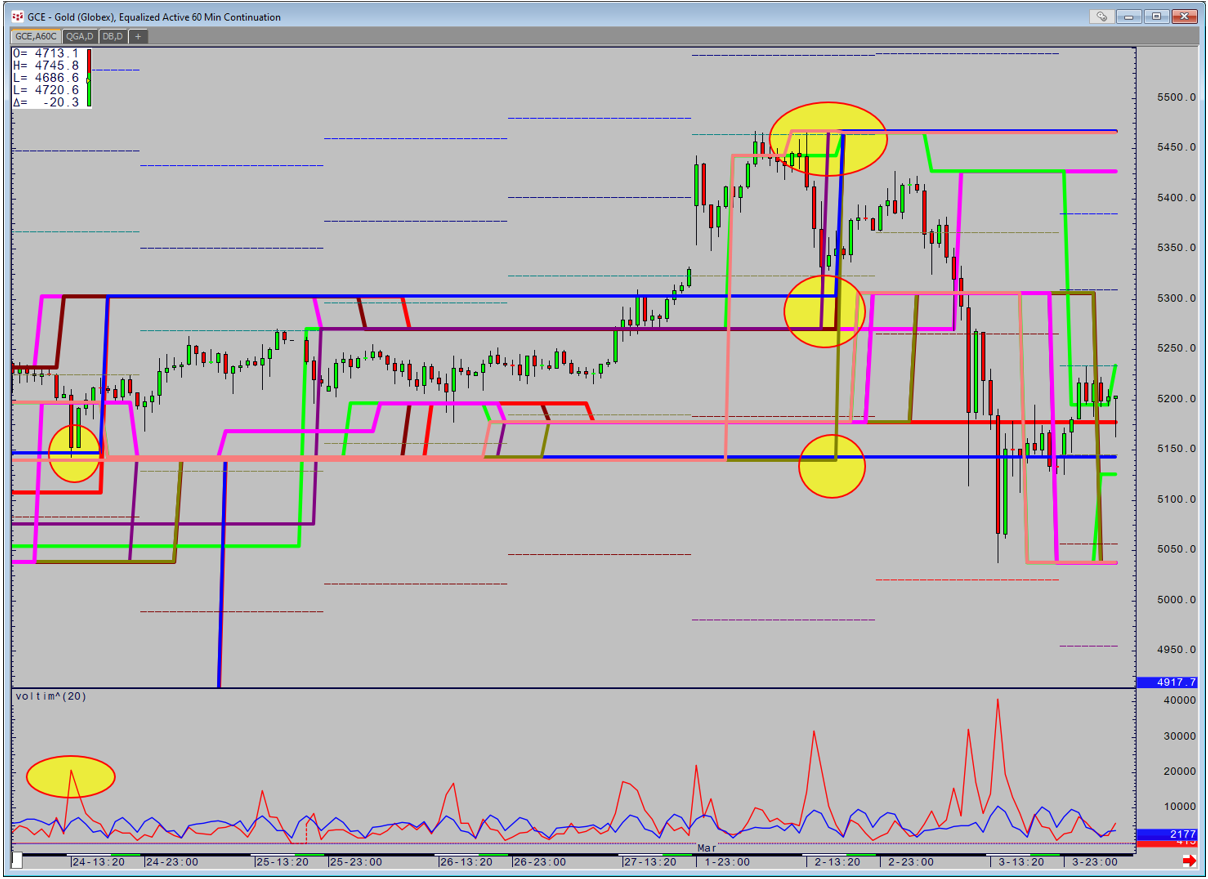
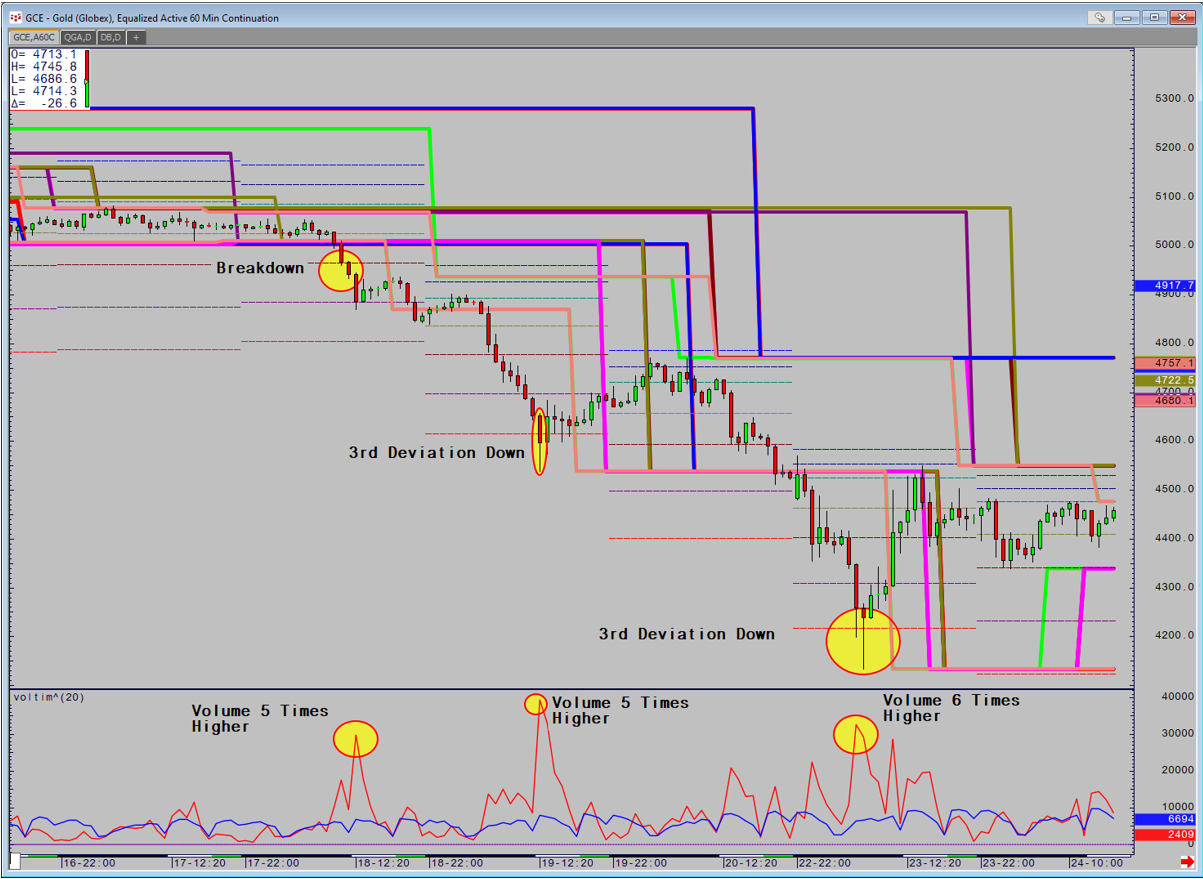
By the close there is also significant damage on the short-term chart as supports as circled move to the top and create resistance.
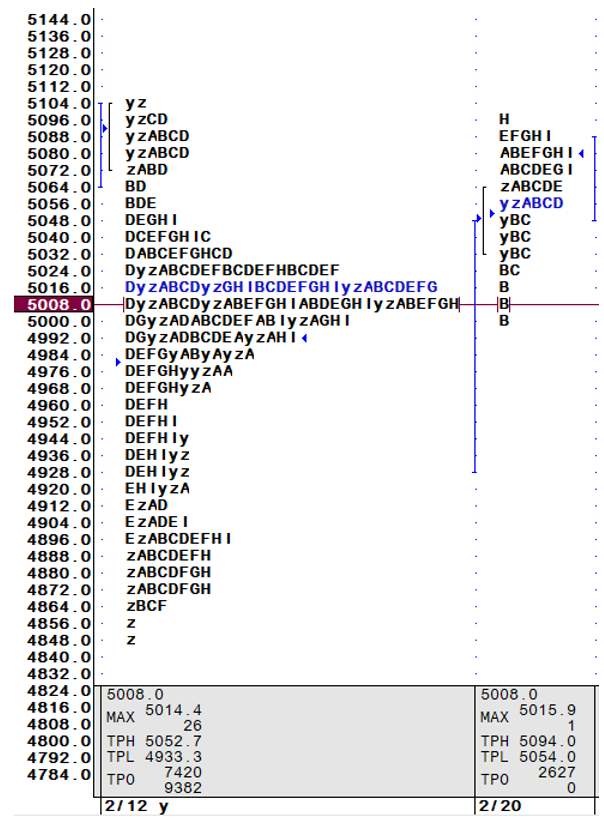
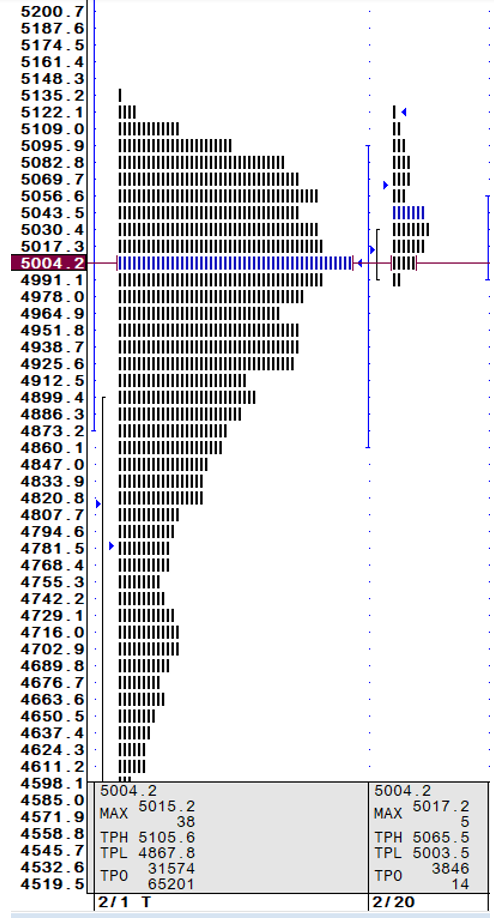
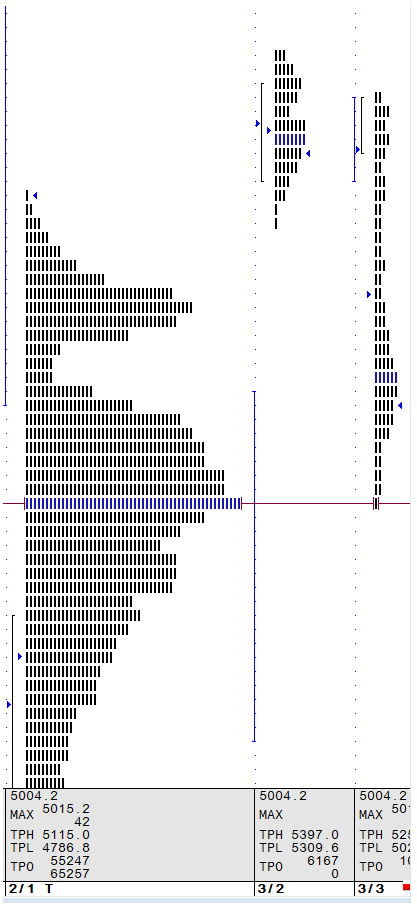
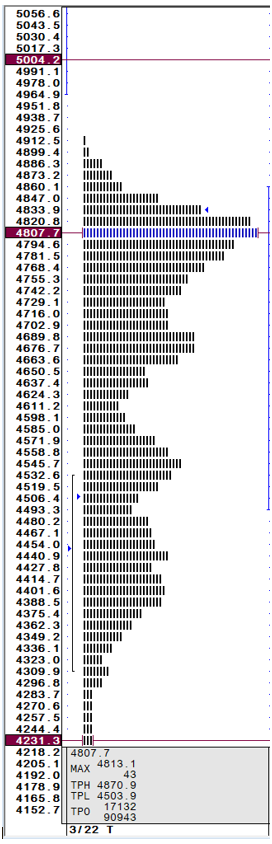
The next day price collapses, posts a negative pattern historically which is not confirmed because price holds the POMT of the current uptrend perfectly. Price will need to close below here at 5004 to turn the trend down.
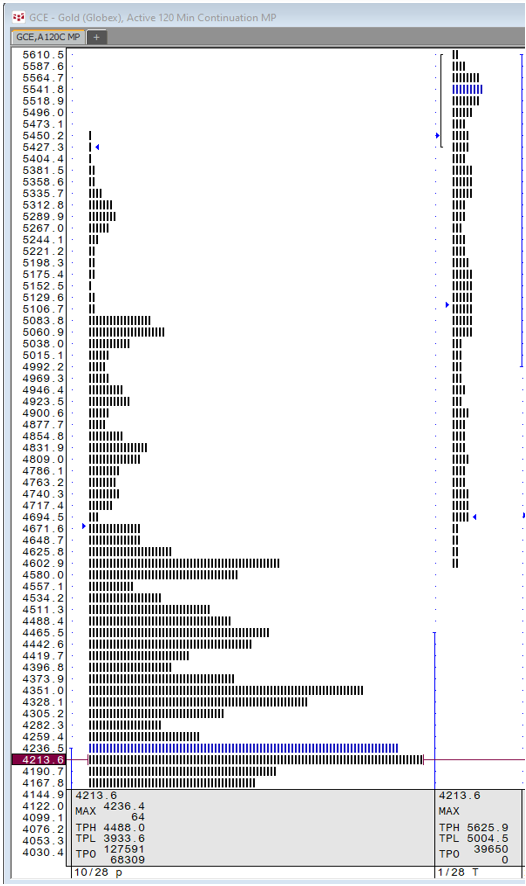
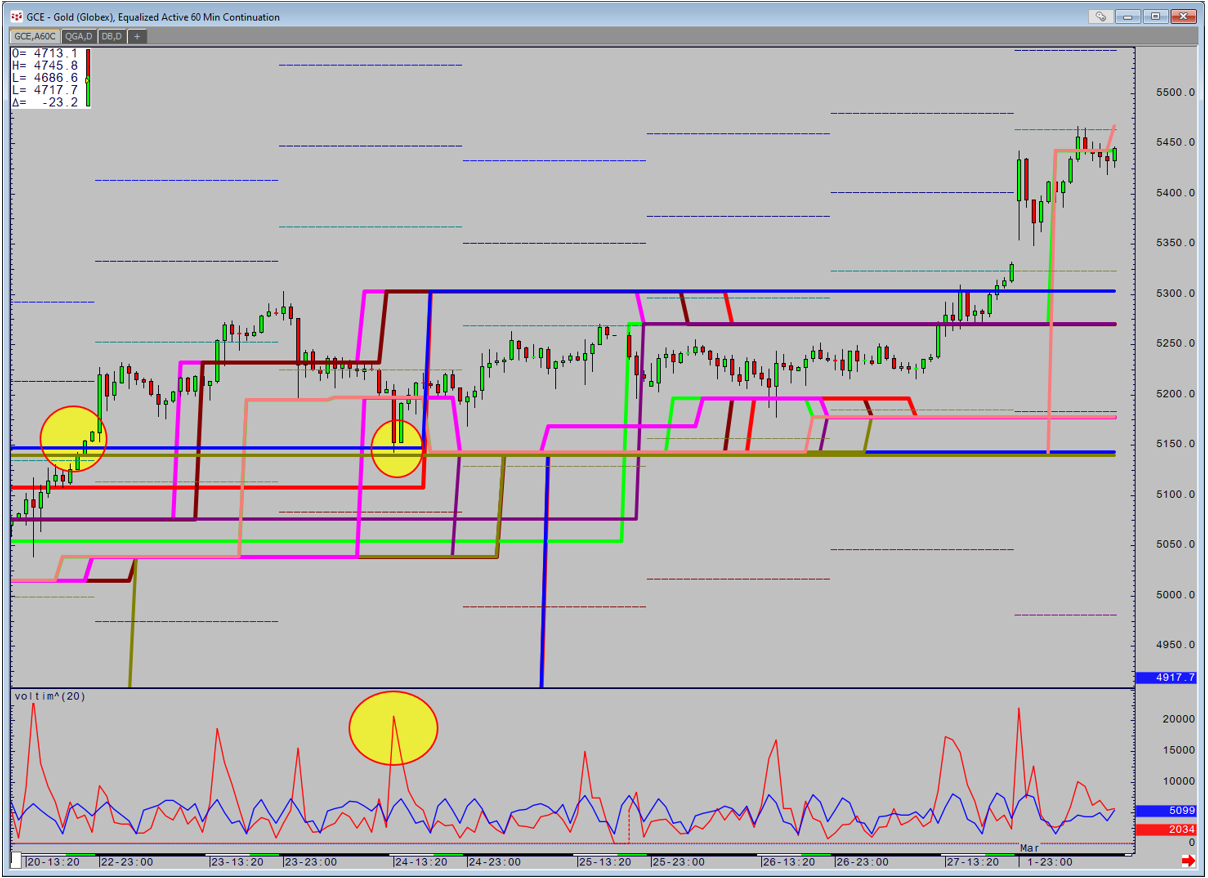
Price again goes sideways and repeatedly attacks 5004 without closing below it. This changes on March 18th as price breaks short-term support on very high volume for the time of day and also the historical, with no meaningful support until a weekly based level at 4456.
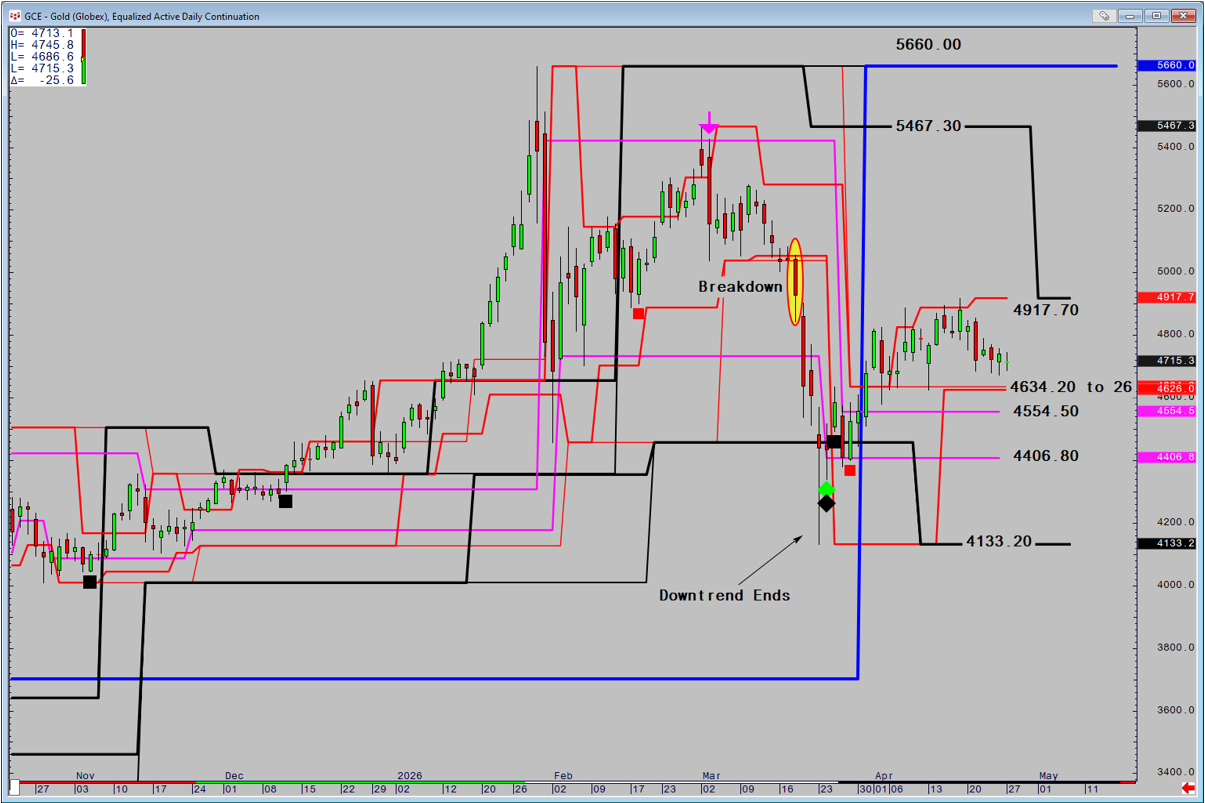
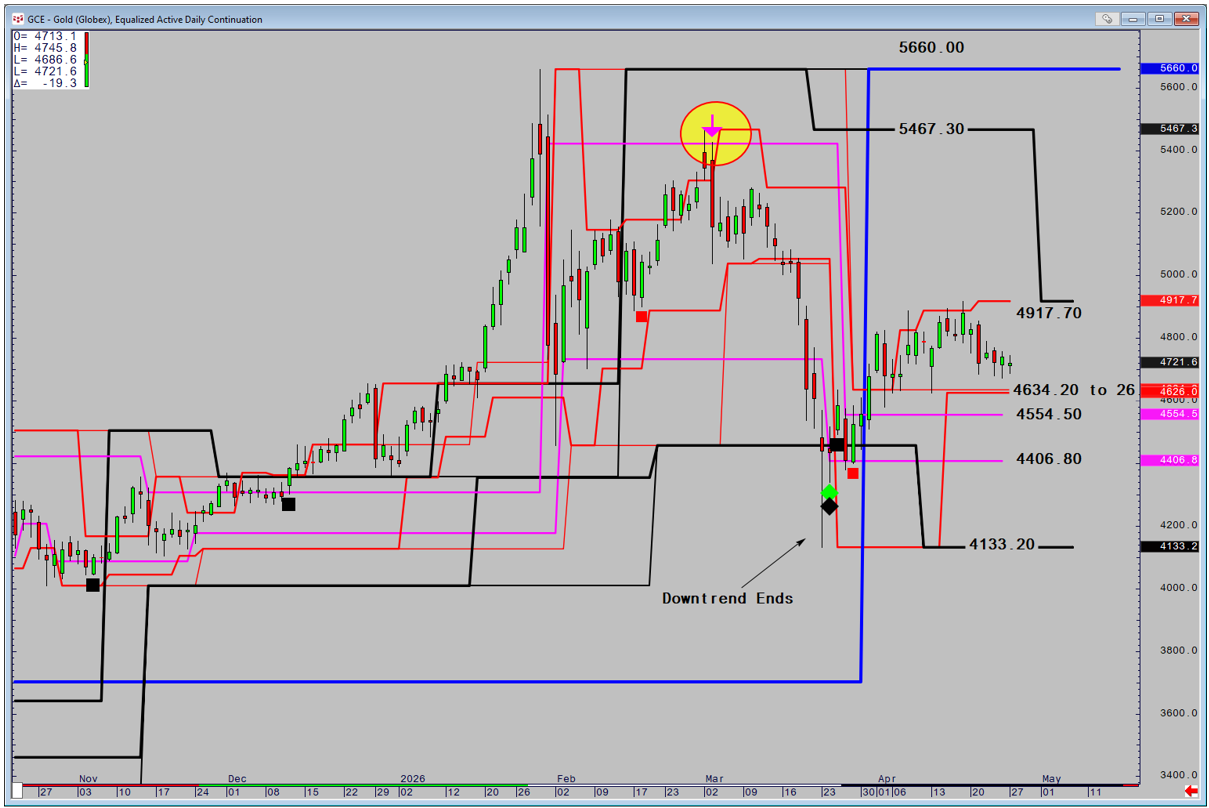
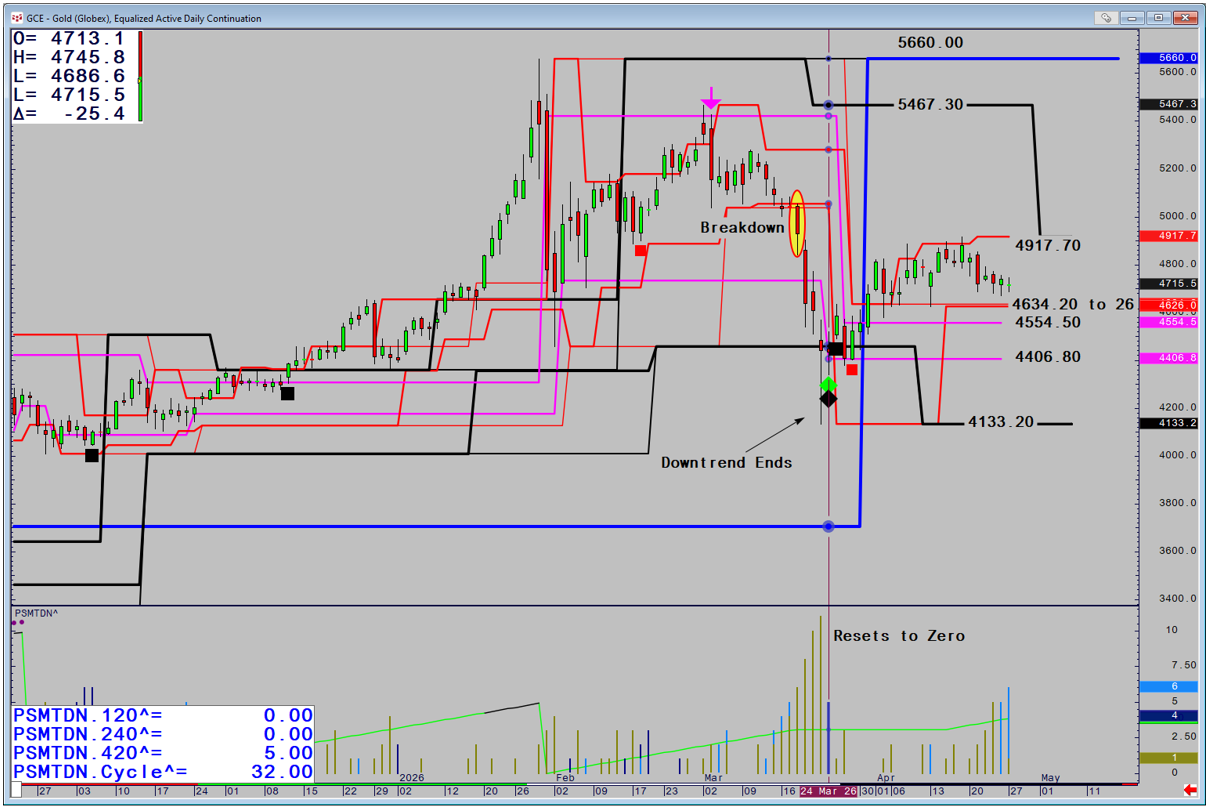
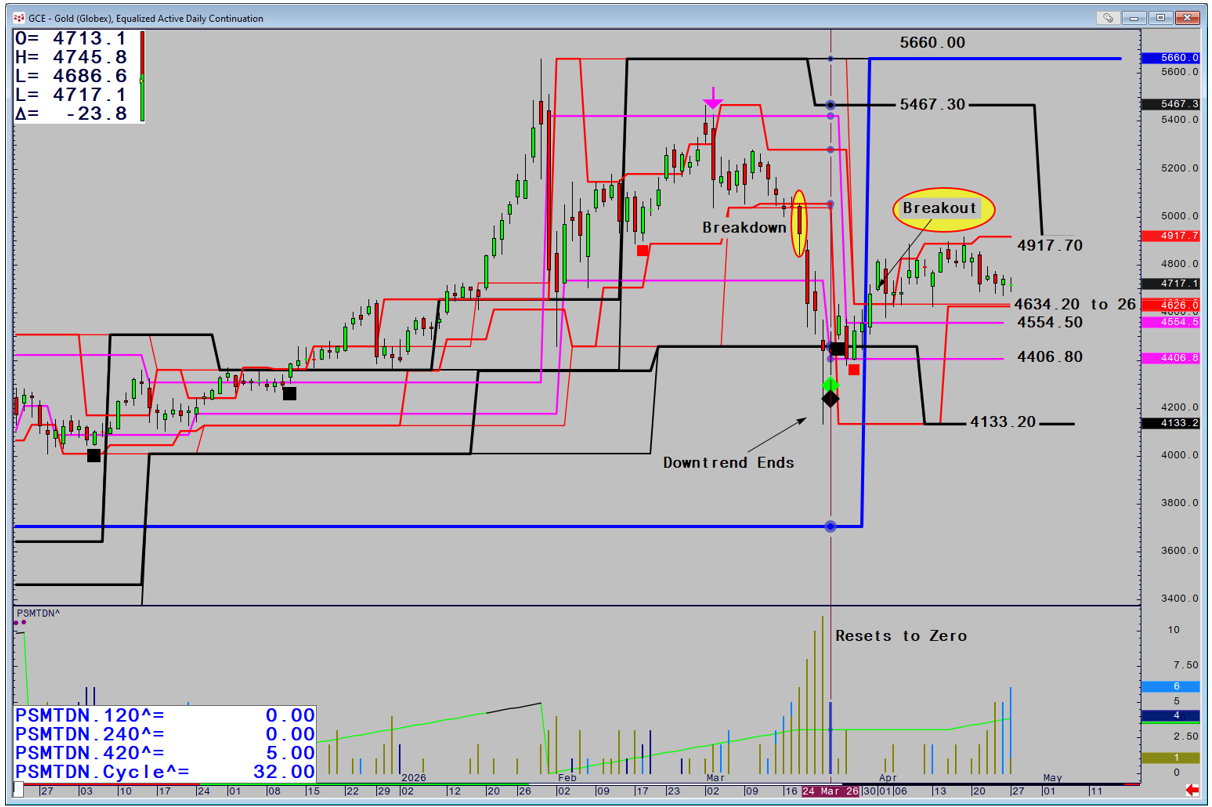
March 24th sees Stochastics Steps come into Play as the Downtrend ends (diamonds) as the 120 and 240-min trend resets back to zero. The downtrend is over and full profits on Shorts should be taken.
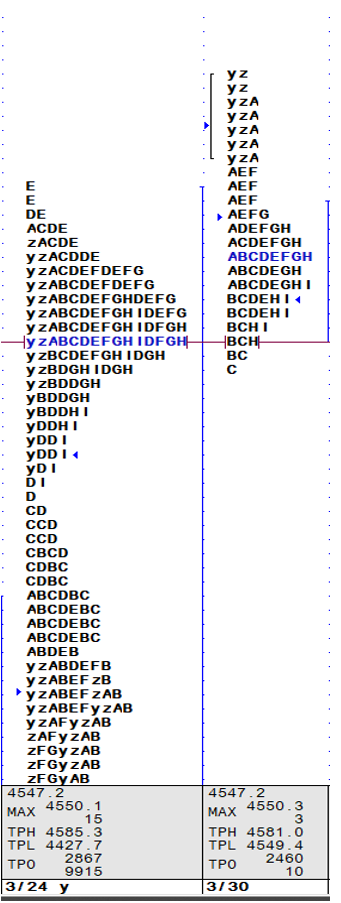
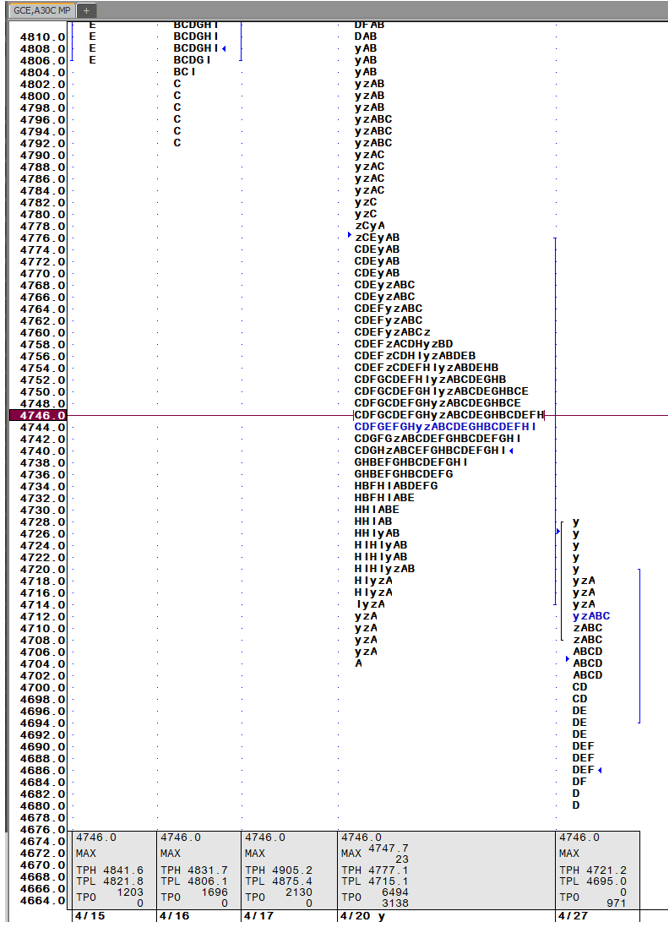
The 25th and 27th sees positive patterns appear which enable a new Uptrend Profile to begin. On the 5-day Profile the 30th sees price hold the POMT, before on the 31st a breakout on a closing basis on the short-term and Historical chart. The trend is up.
Price edges higher in lacklustre fashion but does respect the outer short-term ranges.
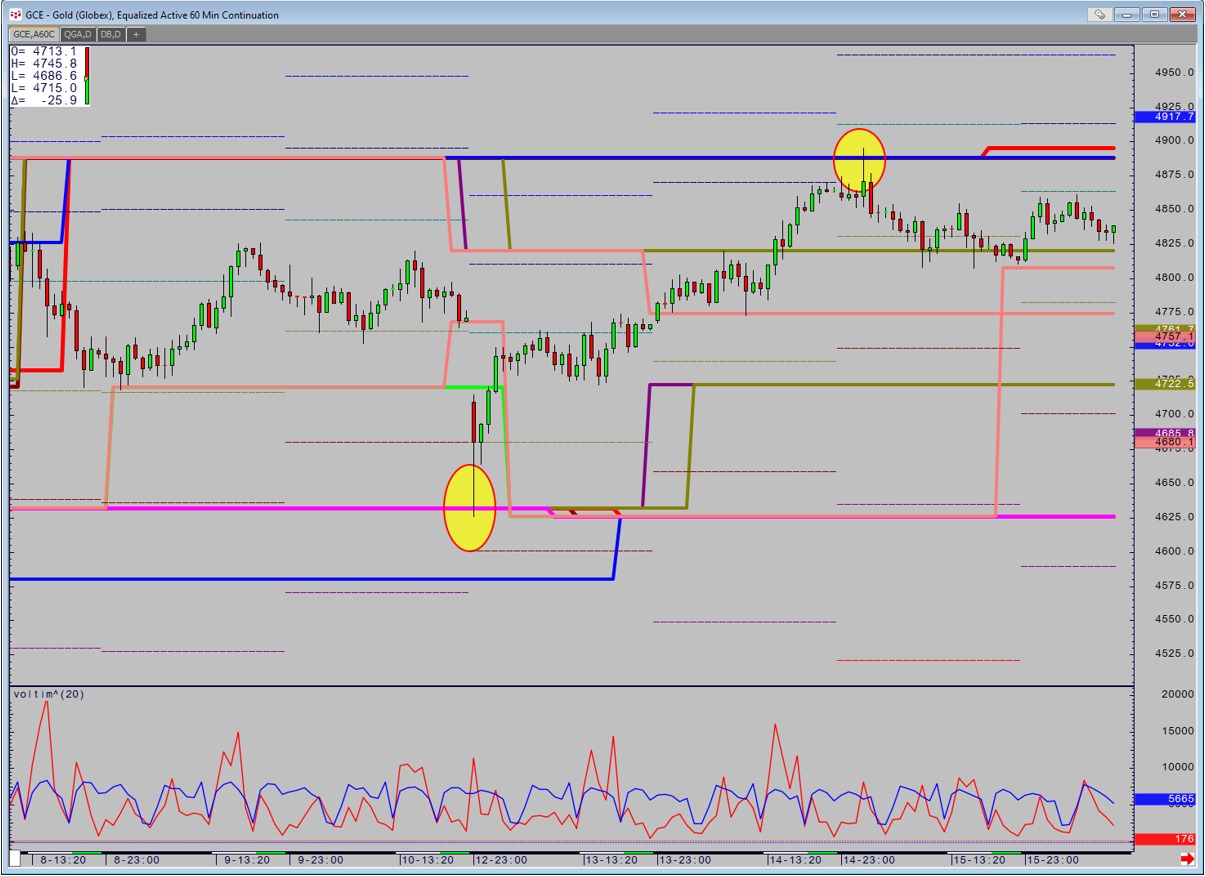
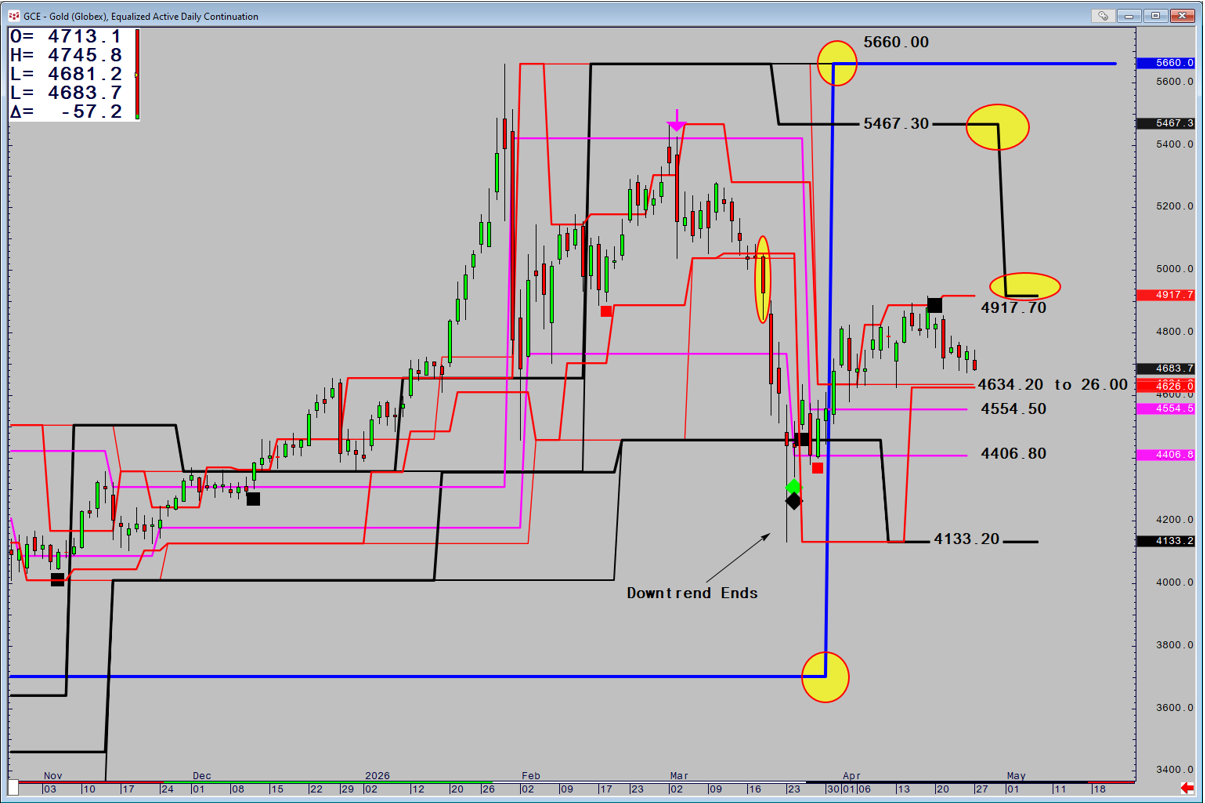
The 20th of April sees the next key moment as a negative pattern appears. In itself it is not very strong as it was an up candle.

However, both the 5-day and Merged Uptrend show a weakening and poor picture, especially in light of the decline in positive correlation between Gold and Usa Index's. The 5-Day Closed at the POMT showing the trend in balance, but the Merged Shows the POMT at the top of the trend and therefore Top-Heavy if the 21st is a down day (Everyone's long and wrong).
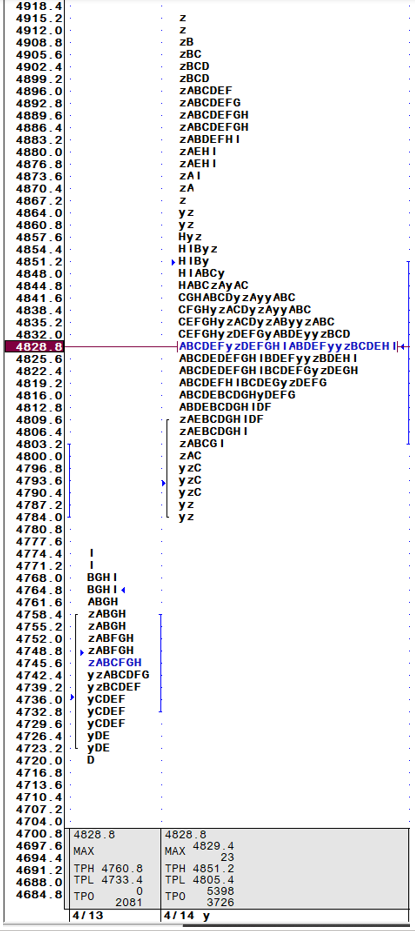
Sure enough, the Pit Only Session Opens Lower, has a failed rotation up in A and B before extending lower in C and Closing on the lows of the day.
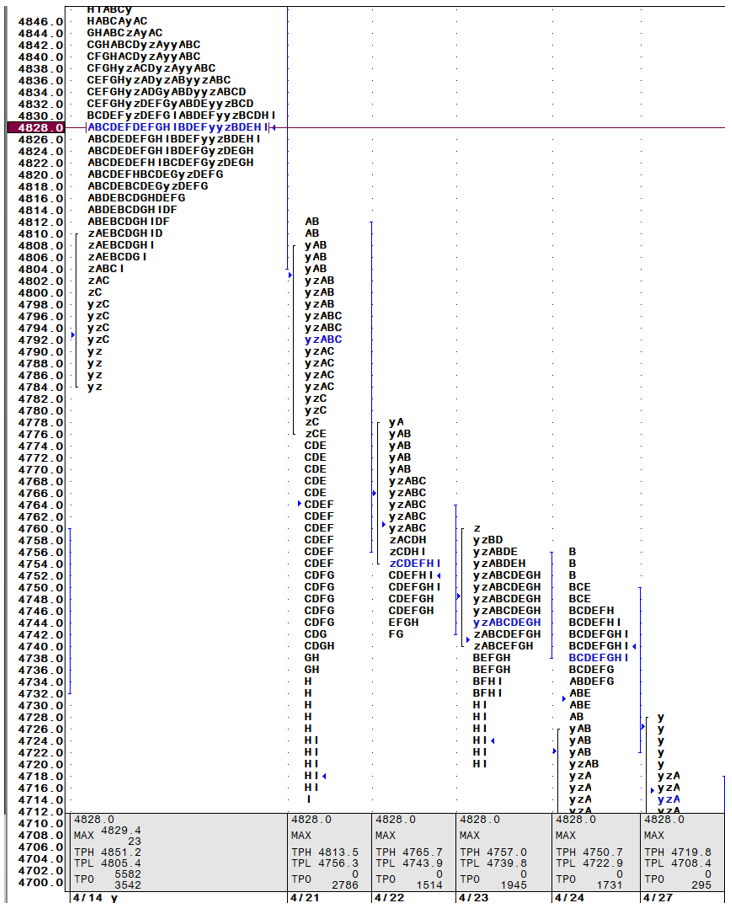
Finally, looking at it now the 5-day Pomt is way above, and we have had initiative selling on the opening.
The Short-Term Chart is close to final support. The Volume Profile is Top-Heavy.
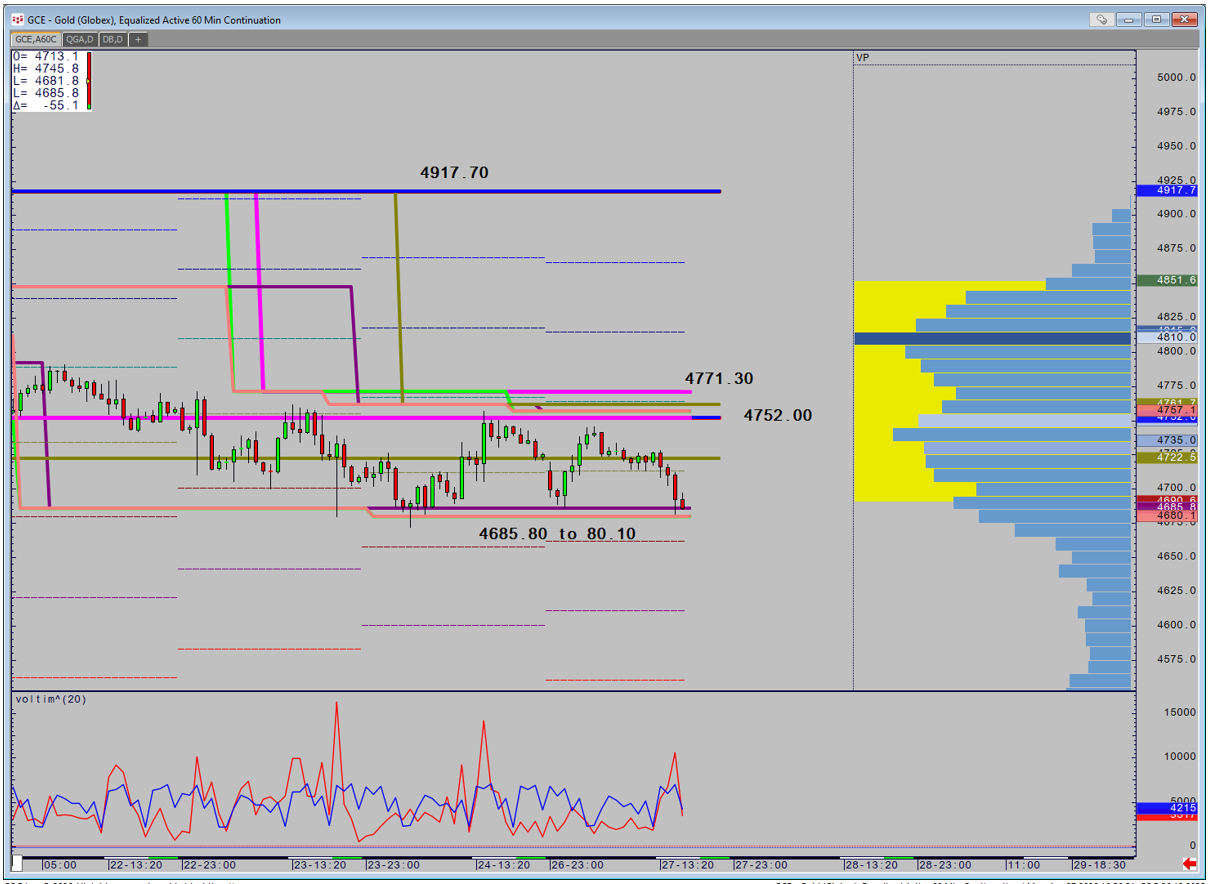
Historically, a close below the nearest daily based support zone at 4634.20 to 26.00 will leave only 2 minor daily supports and turn the major trend down with a weekly based target level way down at 4133.20. The beginning of this month saw a monthly based support switch to resistance (blue line) and at the end of this week, a weekly based resistance will move down to 4917.70, highlighting the weaking picture. It will take a Daily Close above that 4917.70 to turn the picture positive.