- Gold corrected from the late January record high after ten consecutive quarterly new highs
- The bull market began in 1999. Corrections have been "golden" buying opportunities
- The case for gold accumulation at the current price level
- The factors that could lead to a deeper correction
- Many choices for gold exposure
From 1981 through 1997, I traded gold and was in charge of sales and trading for one of Wall Street and London's leading gold bullion dealers. Throughout that period, nearby COMEX gold futures traded mostly between $300 and $400 per ounce, with brief periods below $300 and above $400.
I had been a frustrated gold bull throughout that period. Years later, gold took off on the upside. Since 1999, when the price reached a low of $252.50 per ounce, every correction in the gold price has been a buying opportunity. I expect that trend to continue after the most recent late January 2026 and March 2026 downside corrections.
Gold corrected from the late January record high
Gold reached a continuous contract record high of $5,586.20 on January 29, 2026, when the leading precious metal ran out of upside steam.
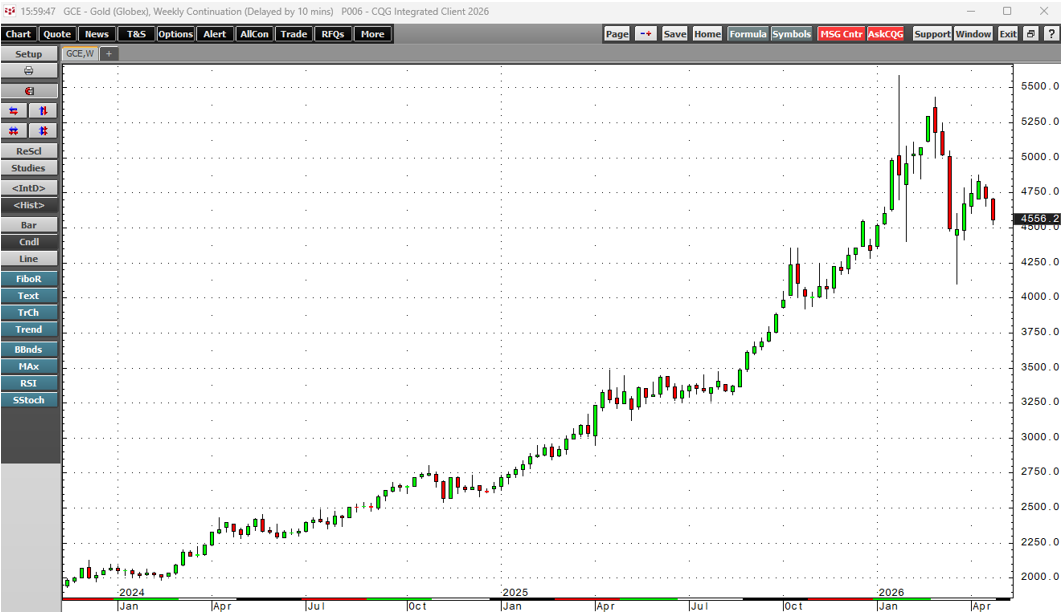
The weekly gold chart highlights the 26.6% correction that took gold futures to a low of $4,100.00 per ounce on March 23, where it found a bottom. While gold lost over one-quarter of its value in a si'"ngle month, the price plunge did not negate its long-term bullish trend.
The bull market began in 1999 and continues. Corrections have been "golden" buying opportunities.
The long-term quarterly COMEX gold futures chart highlights the bullish trend has continued since the late January through March 2026 correction.
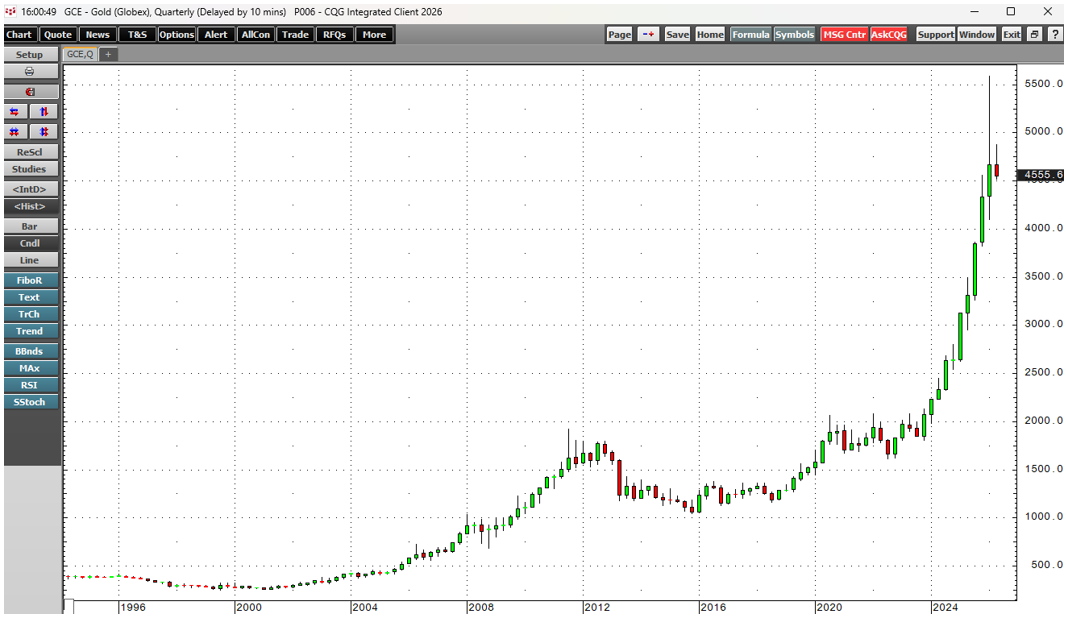
The quarterly chart shows that gold futures reached a new record high and rallied for 10 consecutive quarters, starting in Q3 2023. The continuous contract gold futures price was near $4,550 per ounce in late April 2026. While the 11th straight quarterly gain depends on gold closing June at over $4,666.40, an 11th consecutive quarterly new high requires a close above $5,586.20 per ounce, over $1,000 above the current price level in late April.
Meanwhile, the quarterly chart shows that since gold bottomed at $252.50 per ounce in 1999, every downside correction has been a buying opportunity. While gold futures fell 26.6% during the most recent decline, there have been other significant corrections over the past 27 years. From the Q3 2011 record high of $1,920.70 to the Q4 2015 low of $1,046.20, gold corrected by 45.5%. From the Q3 2020 all-time high of $2,063 to the Q1 2021 low of $1,673.30, gold's price dropped 18.9%. After reaching a Q1 2022 record high of $2,078.80, gold fell 22.4% to $1,613 in Q3 2022. In each case, accumulating gold on a scale-down basis during corrections was optimal as it led to new highs.
Even the most aggressive bull markets rarely move in straight lines, and corrections are normal events that can be healthy for a bullish trend, as they clears out weak long positions and create an opportunity for new buyers to take advantage of pullbacks. In gold's case, central banks, governments, monetary authorities, and supranational institutions have increased their gold reserves on pullbacks and rallies, validating gold's role in the global financial system and its bull market.
The case for gold accumulation at the current price level
With gold futures nearly $900 below its latest January 2026 record high, the following factors support higher highs over the coming months and years:
- Central bank and government buying over the past years have made gold the leading reserve asset, surpassing the euro and the U.S. dollar.
- Fiat currency values have been declining, which supports gold. Gold has been the ultimate means of exchange for thousands of years.
- While the U.S. dollar remains the world's leading reserve currency, the bifurcation of the world's nuclear powers, U.S. tariffs and sanctions, and friction between the U.S. and traditional allies have led to de-dollarization. Gold is a global reserve asset that transcends borders.
- Since the pricing mechanism for gold remains the U.S. dollar, a weakening U.S. currency supports higher gold prices.
- Gold tends to be a hedge against inflation. Global inflation remains elevated in late April 2026.
- Falling interest rates support gold prices by lowering the cost of carrying it and making fixed-income assets less attractive.
- Meanwhile, rising U.S. interest rates due to debt approaching $40 trillion could also be bullish for gold as the U.S. credit rating declines.
- The midterm elections could cause significant changes on the U.S policy front.
The bullish factors for gold present a compelling case for continued higher prices. Meanwhile, the long-term trend remains a trader's and investor's best friend, and it is bullish as gold moves into May 2026.
The factors that could lead to a deeper correction
The factors that could cause a deeper correction that sends gold prices lower over the coming months include:
- Gold experienced a multi-year correction from Q3 2011 through Q4 2015, taking the price 45.5% lower. Picking bottoms during corrections in any market is dangerous, as prices can fall to levels that defy reasonable, rational, and logical fundamental and technical analysis.
- The first critical technical support level for COMEX gold futures on the long-term quarterly chart is far below the current market price at the Q2 2023 high of $2,085.40 per ounce.
- If the central bank buying dries up or turns to selling, gold could experience a far deeper correction.
- Higher crude oil prices driving up inflationary pressures could cause interest rates to rise, increasing the cost of carrying long gold risk positions.
- Risk-off across markets could cause gold's price to plunge as market participants sell the precious metal to meet margin calls and accumulate cash in a crisis.
While factors could weigh on gold prices over the coming weeks and months, the bullish case remains far more compelling in the current environment. Markets reflect the economic and geopolitical landscapes, and gold is no exception. Gold has historically thrived during periods of uncertainty.
Many choices for gold exposure
The most direct route for investment in gold is the physical market for bars and coins. COMEX futures and futures options are highly liquid, but require specialized accounts and margin requirements. Gold ETF products that own physical gold include, but are not limited to, the liquid GLD, IAU, and BAR ETFs. The expense ratio of these products covers insurance and storage costs and allows market participants to own gold exposure in standard equity accounts.
Gold mining shares move higher and lower with gold, and can provide leverage at times because mining is a leveraged business. Two diversified senior and junior gold mining ETFs that own a portfolio of the leading mining companies are the GDX and GDXJ ETFs. The NUGT and JNUG ETFs turbocharge GDX and GDXJ with leverage.
For more than a quarter of a century, accumulating gold during periods of price weakness has been optimal. I do not expect that trend to change, and we may look back at the current period as another "golden" buying opportunity with the price currently around $4,550 per ounce.