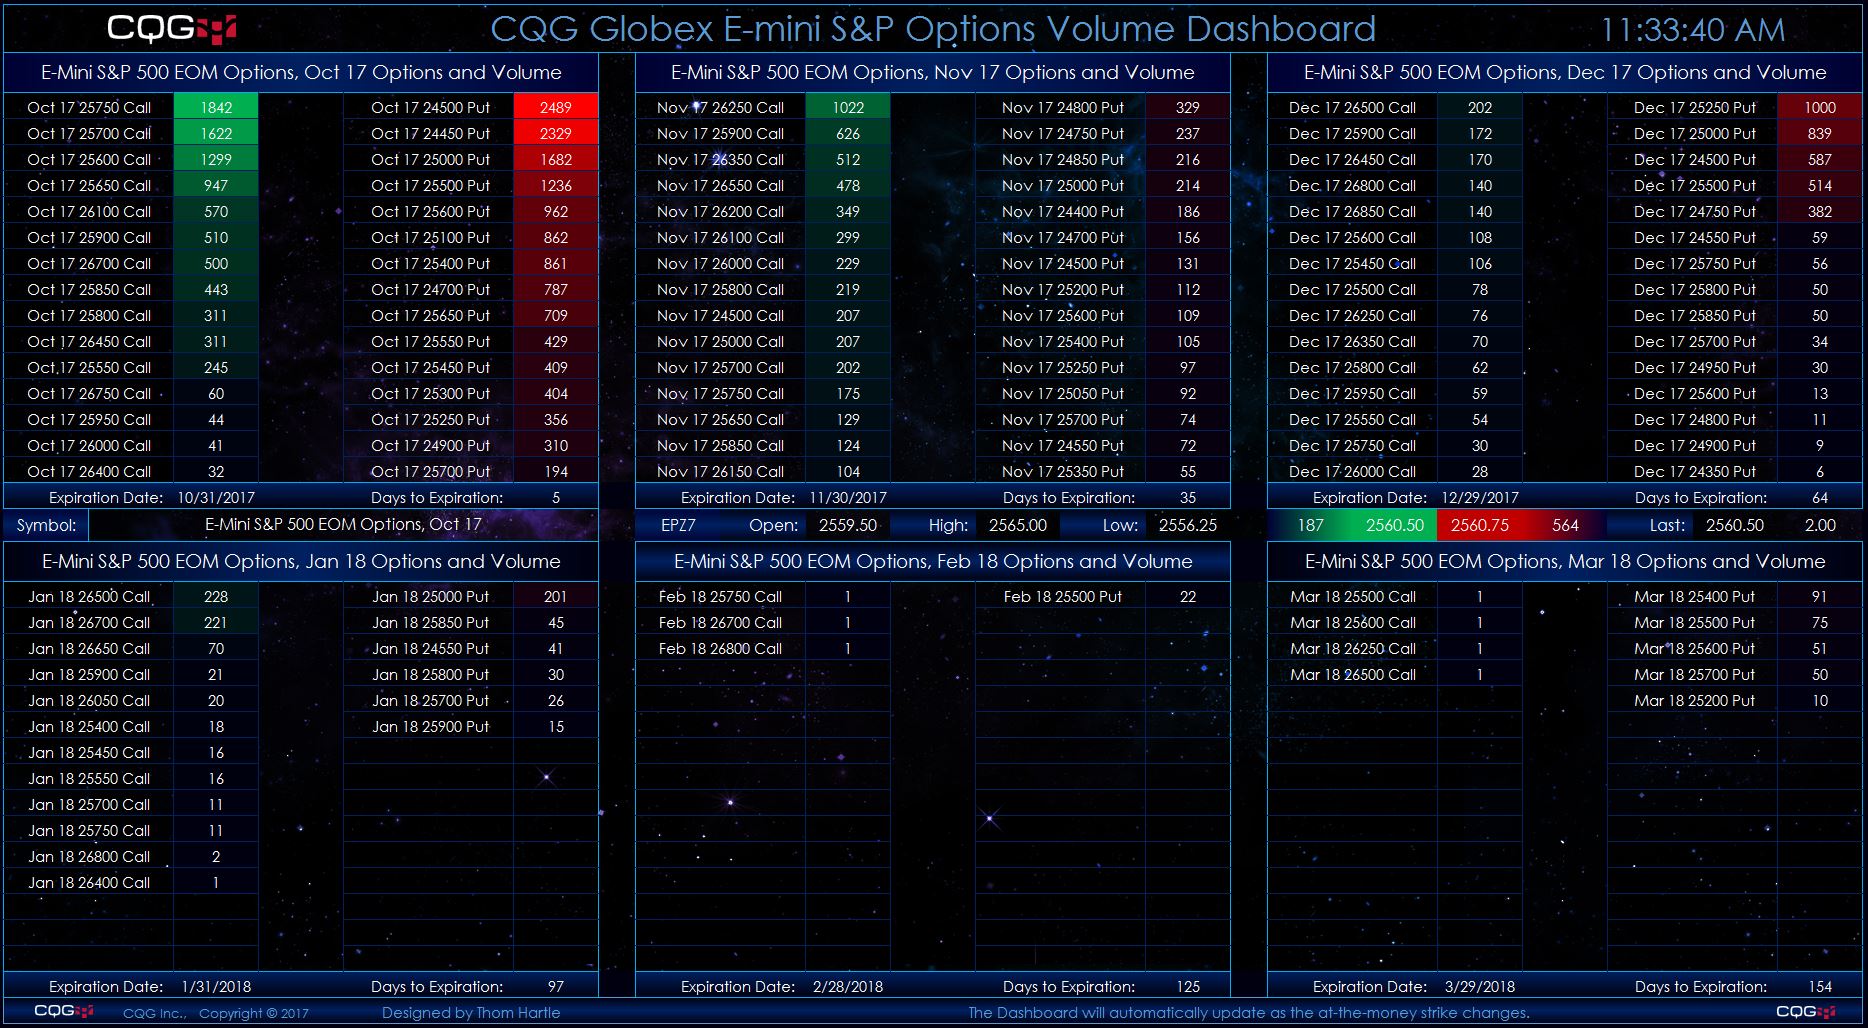
This Microsoft Excel® dashboard scans options on the E-mini S&P 500 futures market using the CQG RTD Toolkit for volume and displays strikes ranked by the volume traded for each listed expiry… more
Excel/RTD
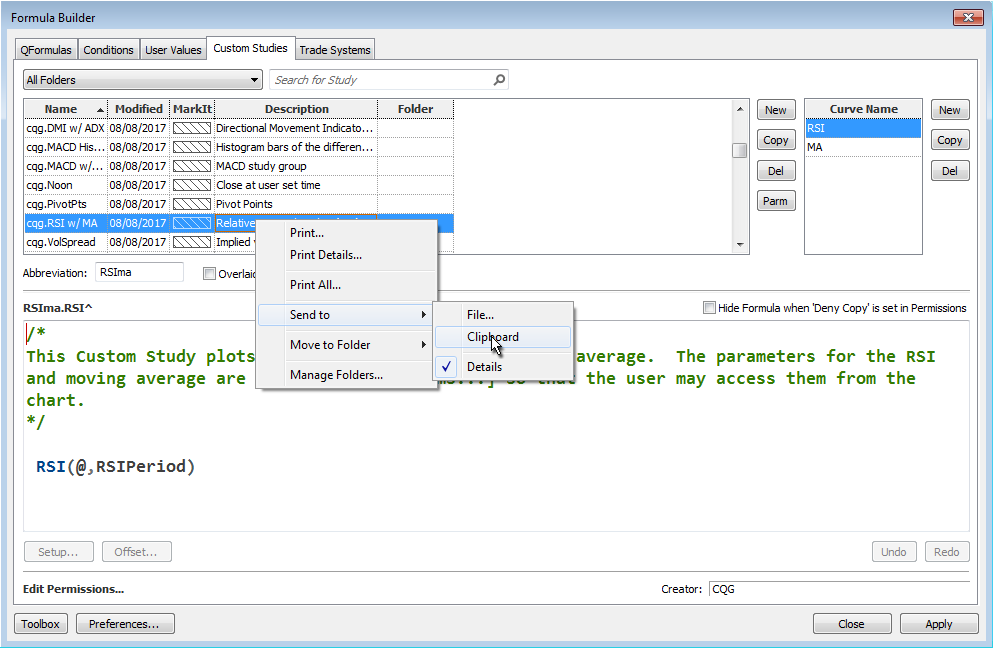
There are numerous Excel samples that walk you through bringing various market data into Excel using RTD formulas. However, there is a lot to look through. One solution is to use the CQG Formula… more
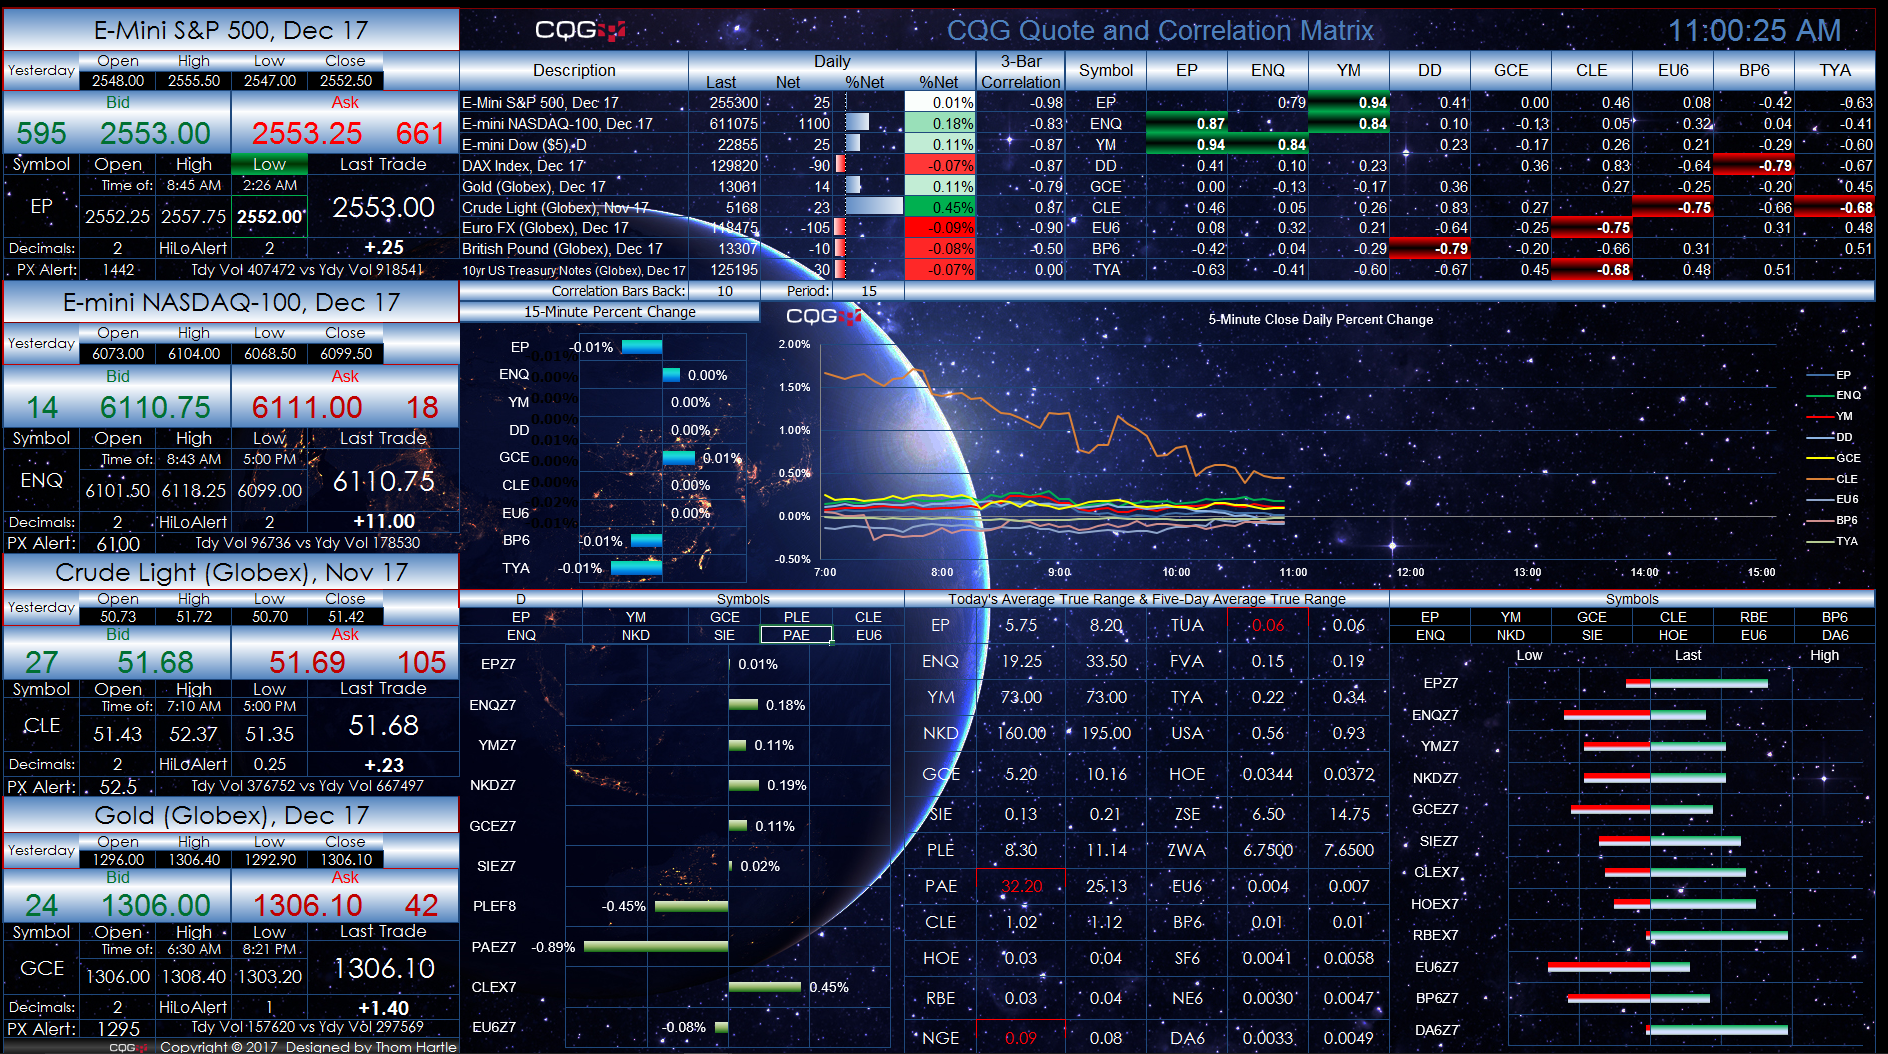
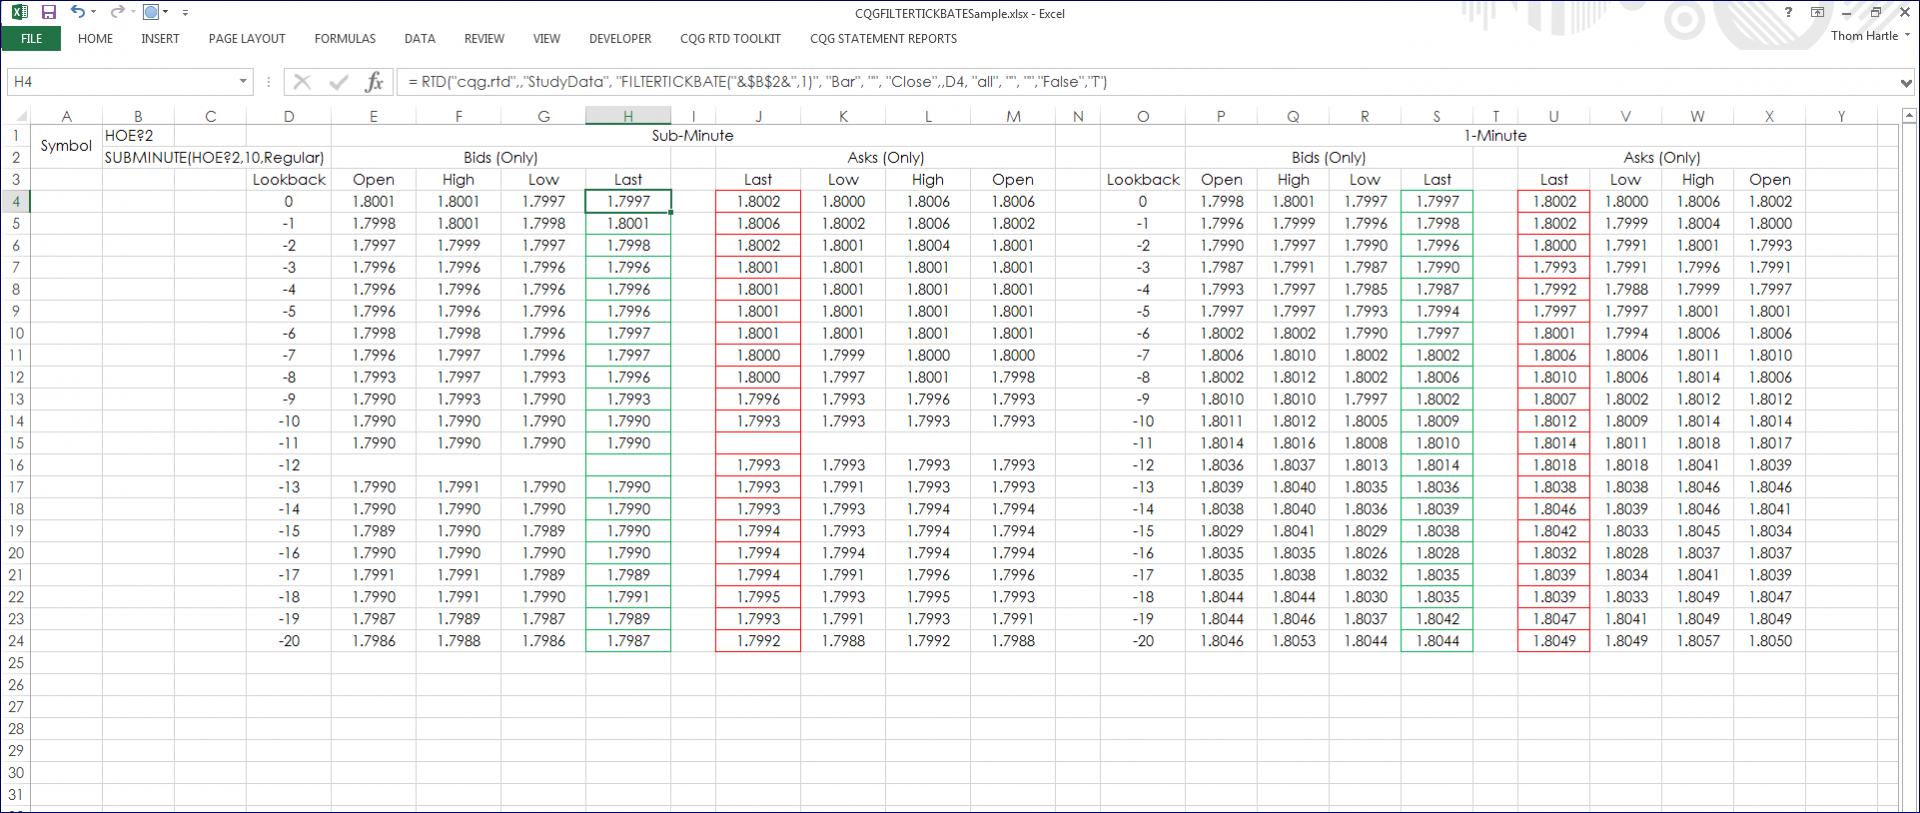
This Microsoft Excel® dashboard presents different styles of viewing market and study information. The left-hand side is today's current market data. You can enter symbols and set the number of… more
This Microsoft Excel® dashboard has three tabs. The first tab displays today’s market quotes, volume, and open interest data. If the last price is matching the open price, then the open price… more
CQG charts have a setting called the BATS Charts Preferences. Here, you select what data to use to build the chart. You can use the default setting where the chart is built using trade and… more
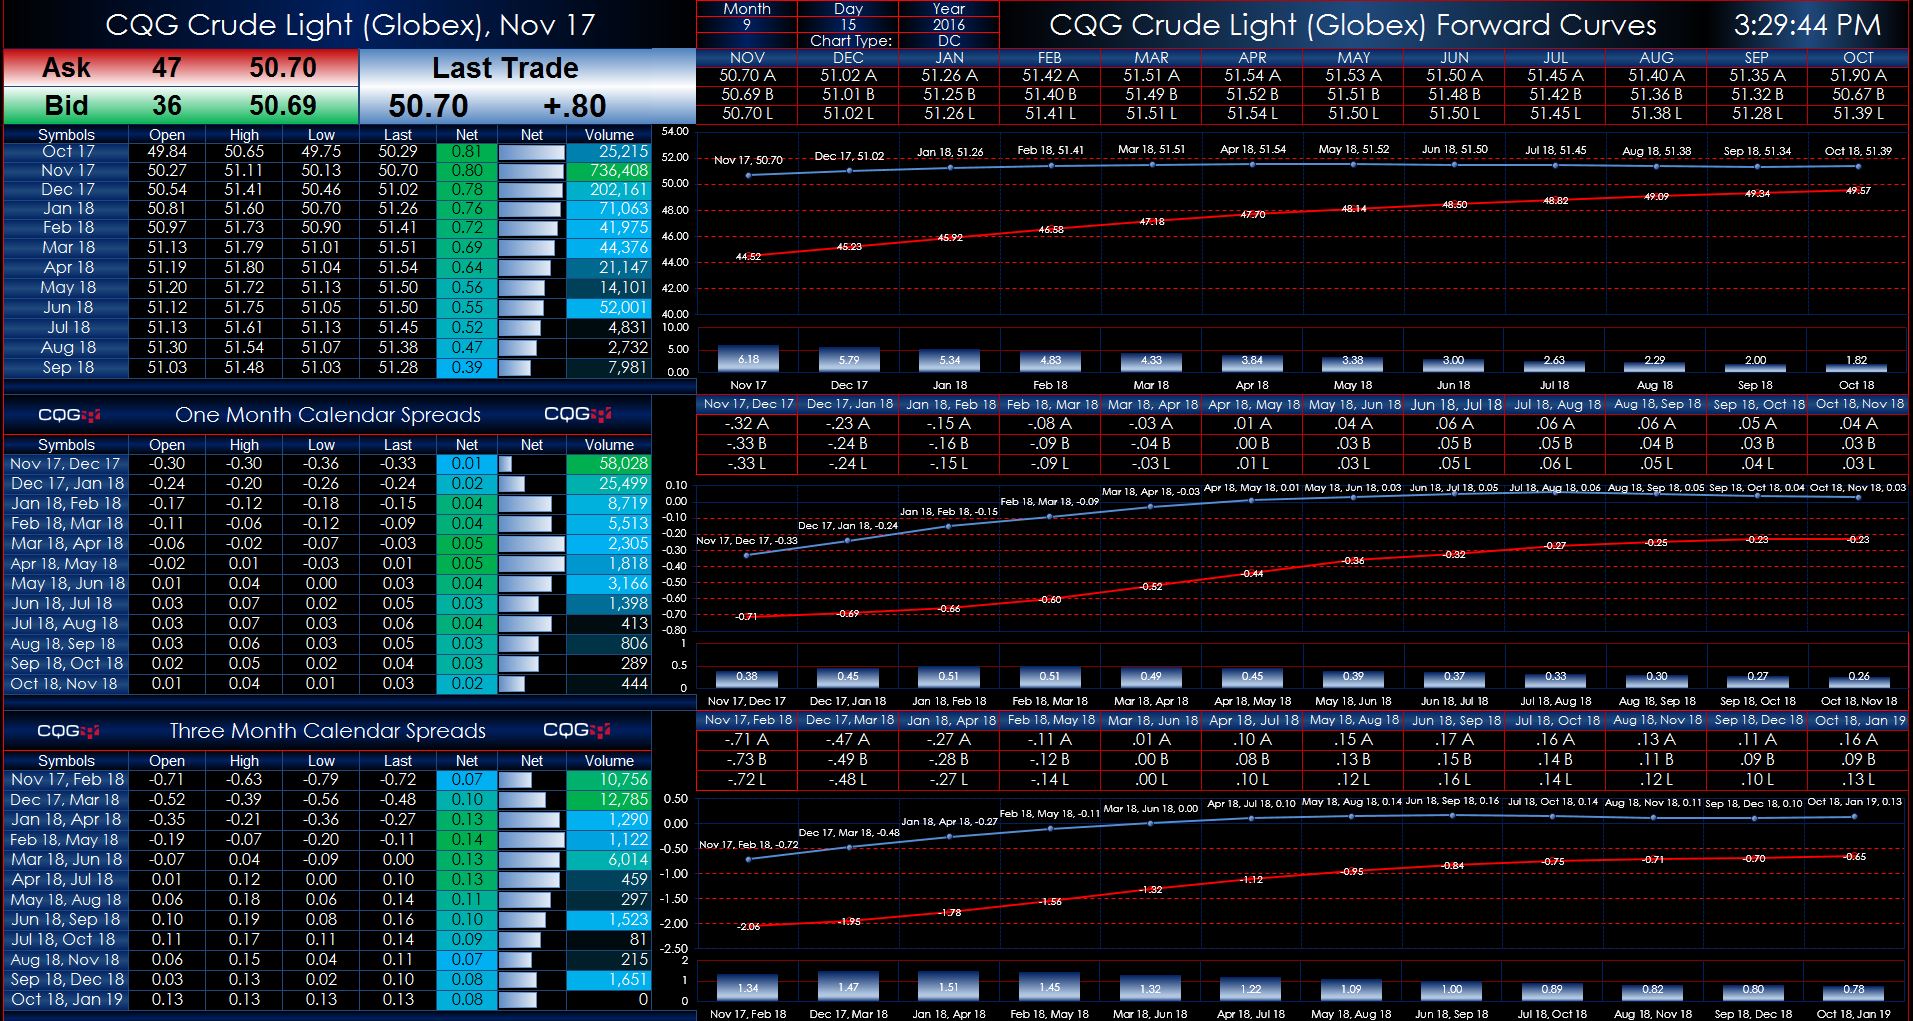
These two Microsoft Excel® spreadsheets present Globex crude oil market data and forward curves, both current and historical. Two dashboards are available: The first the data includes outrights… more
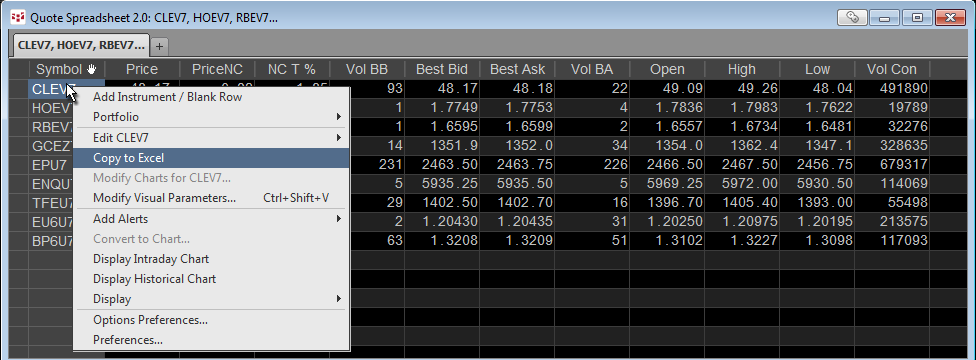
Customers who use Microsoft Excel® when following the markets can easily populate their Excel spreadsheet with RTD formulas using CQG's Quote SpreadSheet (QSS) 2.0.
To open QSS 2.0, click… more
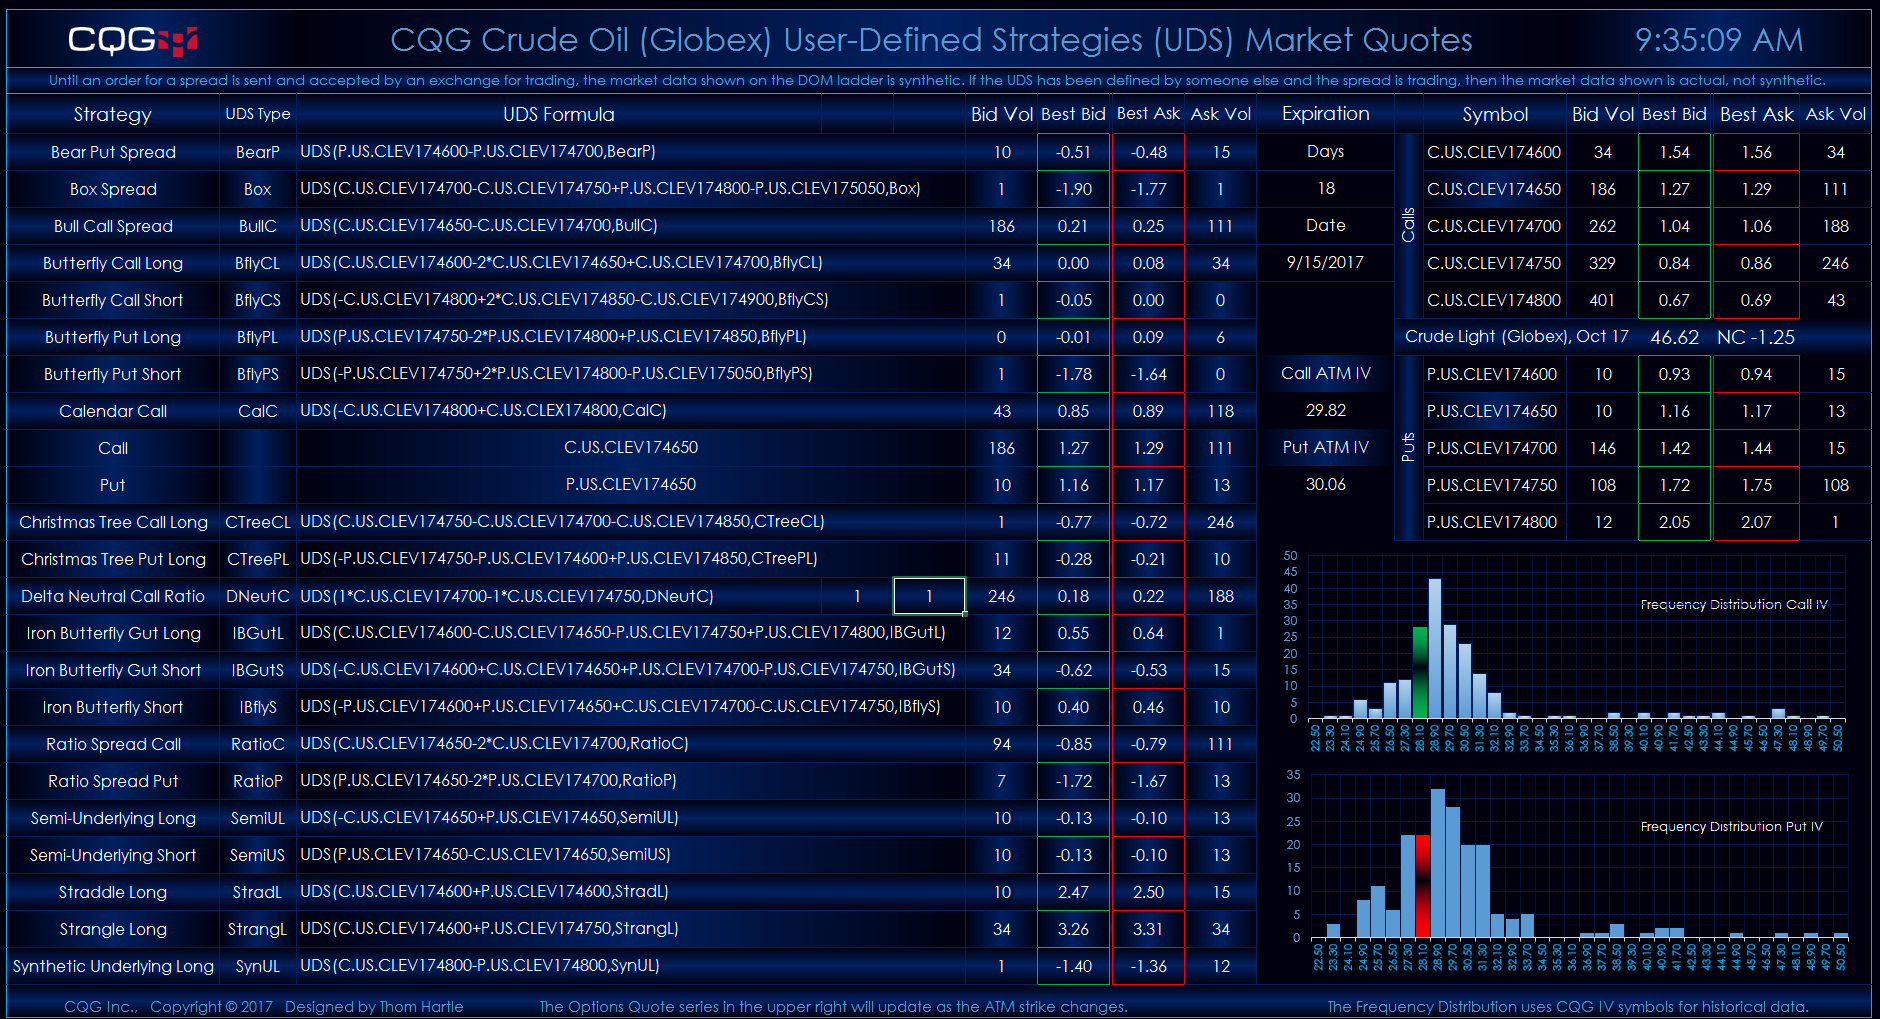
These two Microsoft Excel® dashboard display market quotes for tradable UDS for the crude oil contract and the E-mini S&P 500 traded on Globex. There is also a quote display with at-… more
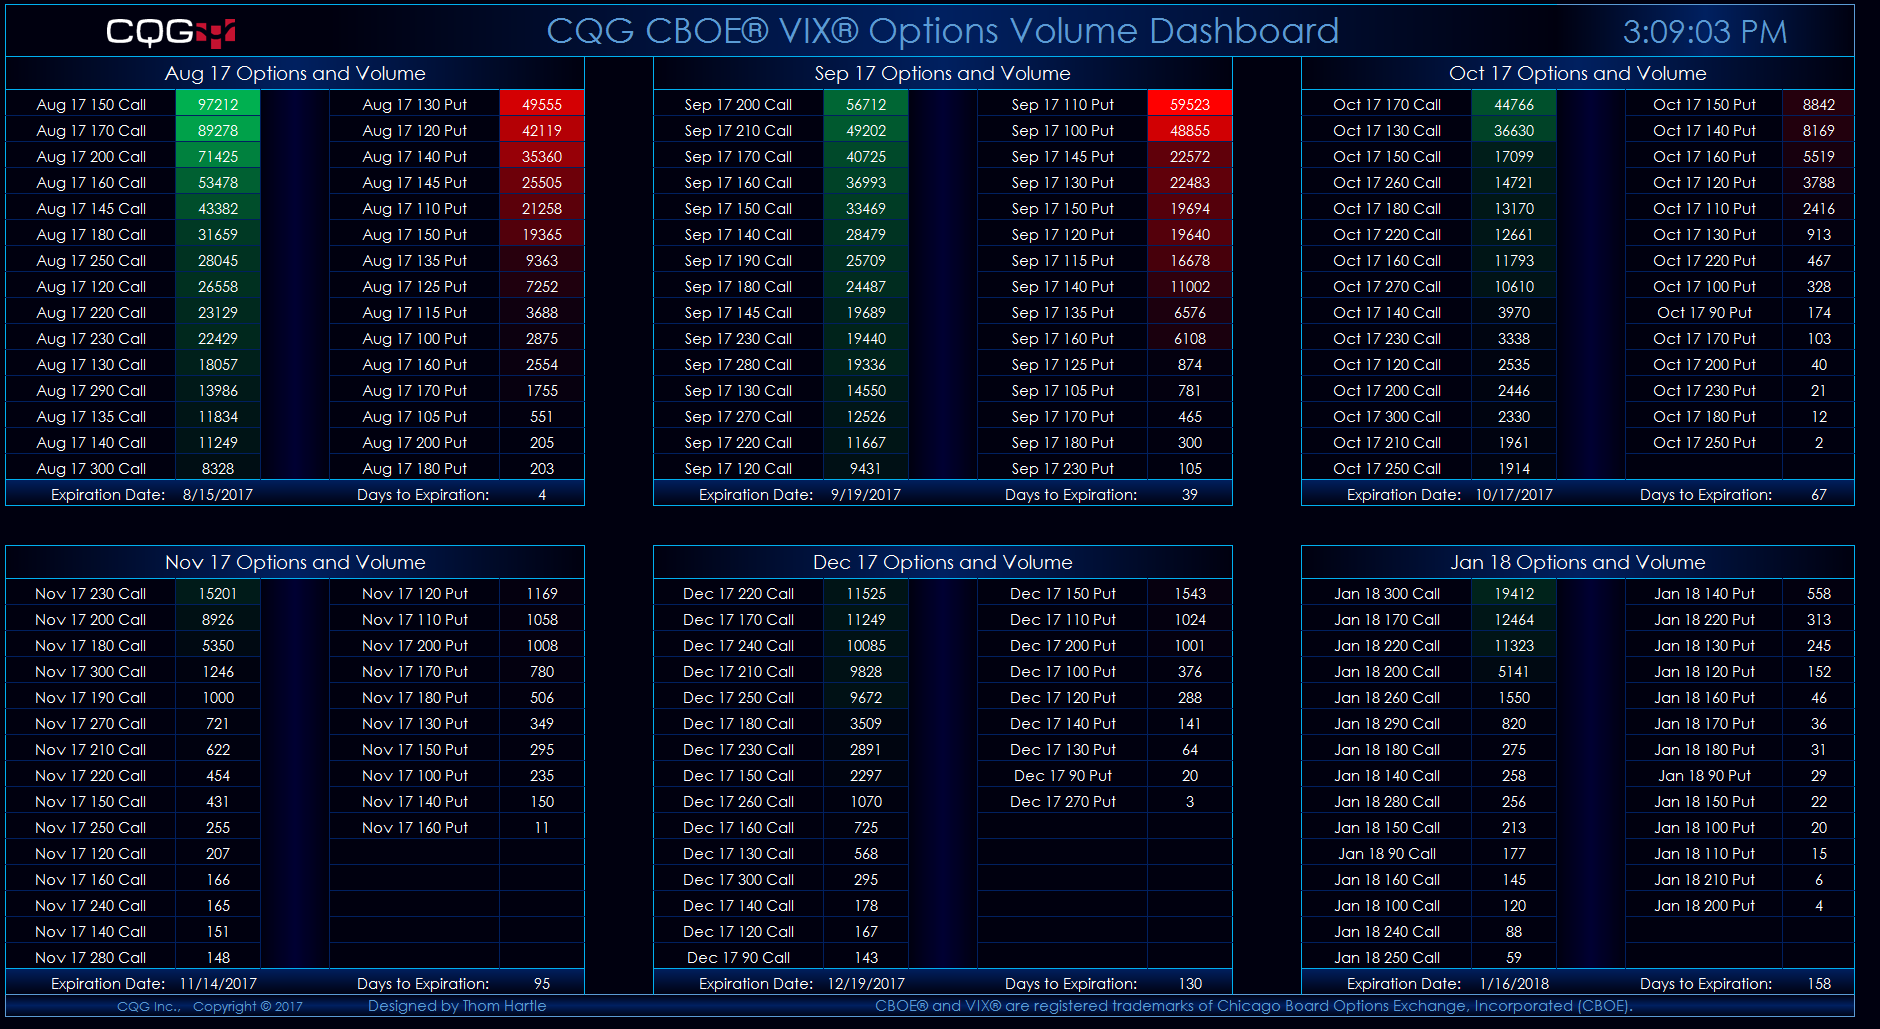
This Microsoft Excel® dashboard scans the VIX (CBOE) options market for volume and displays the strikes ranked by the volume traded for each expiry listed. The scan covers options traded 15… more
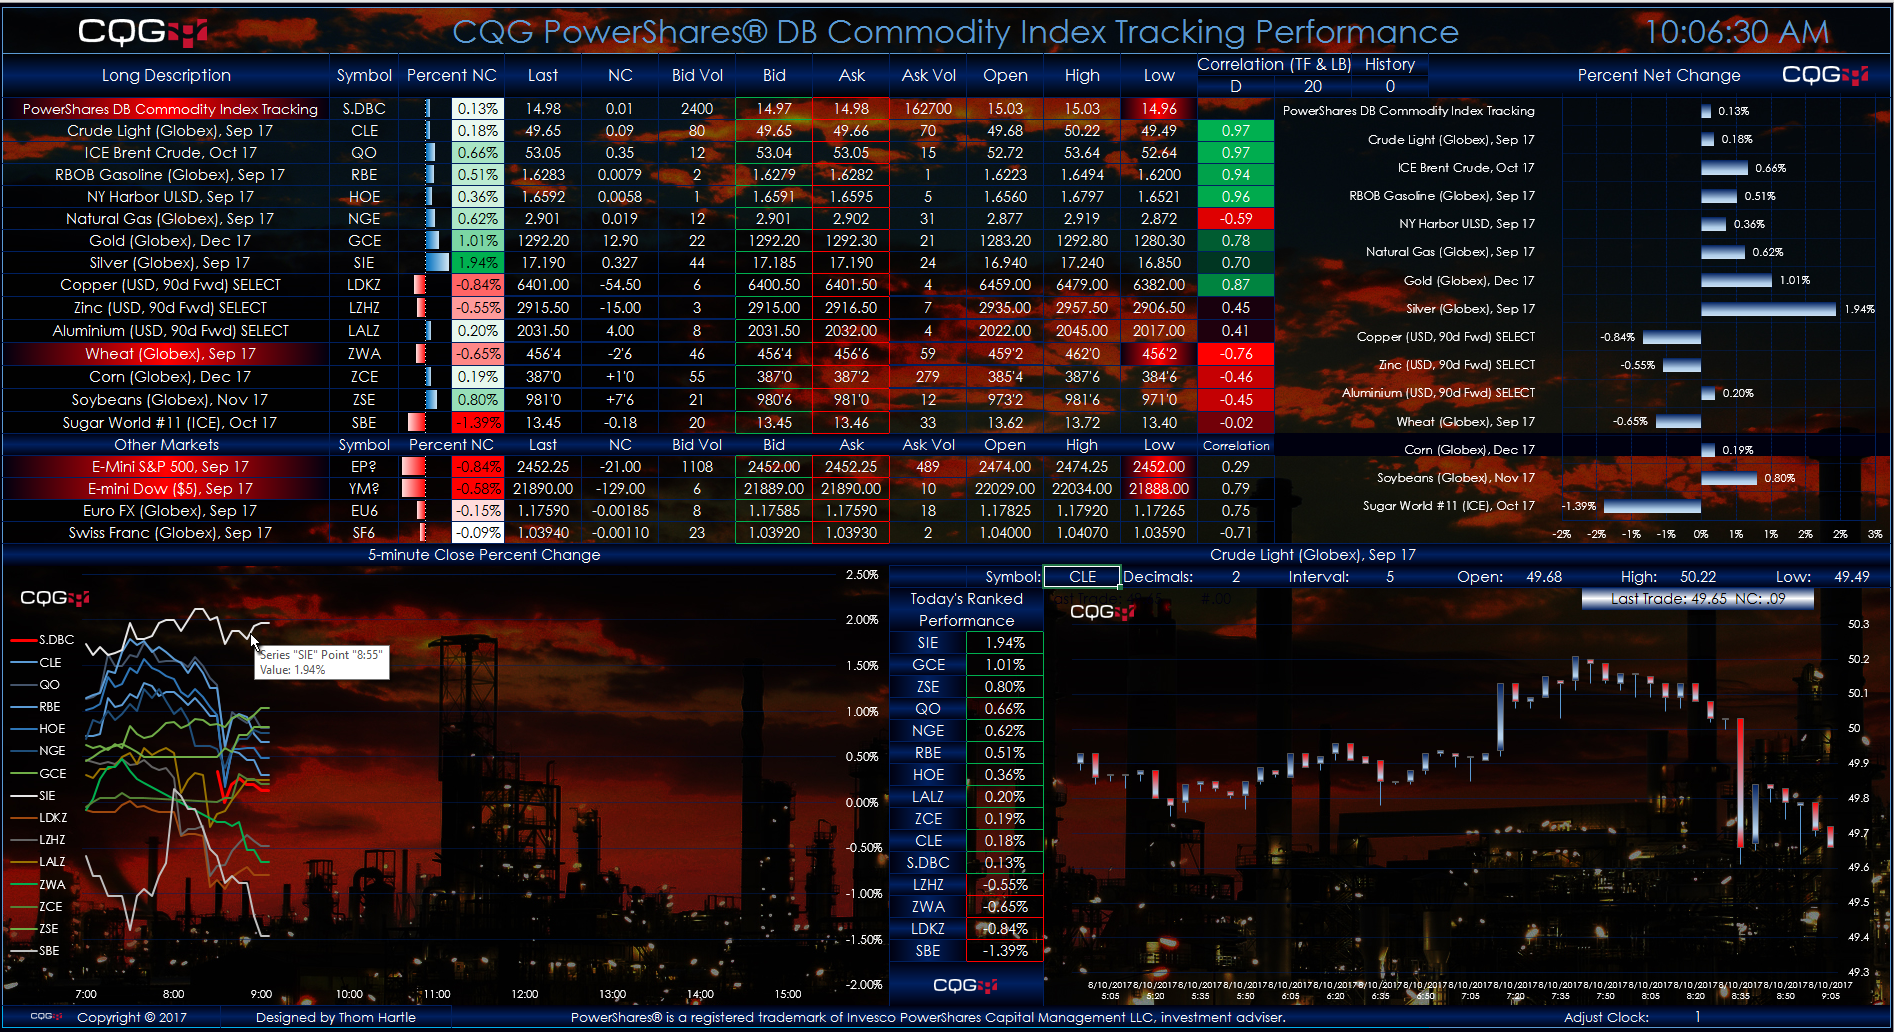
This Microsoft Excel® spreadsheet tracks the front month contracts of the PowerShares® DB Commodity Index (symbol: DBC) holdings. The actual ETF holds deferred contracts. More information about… more