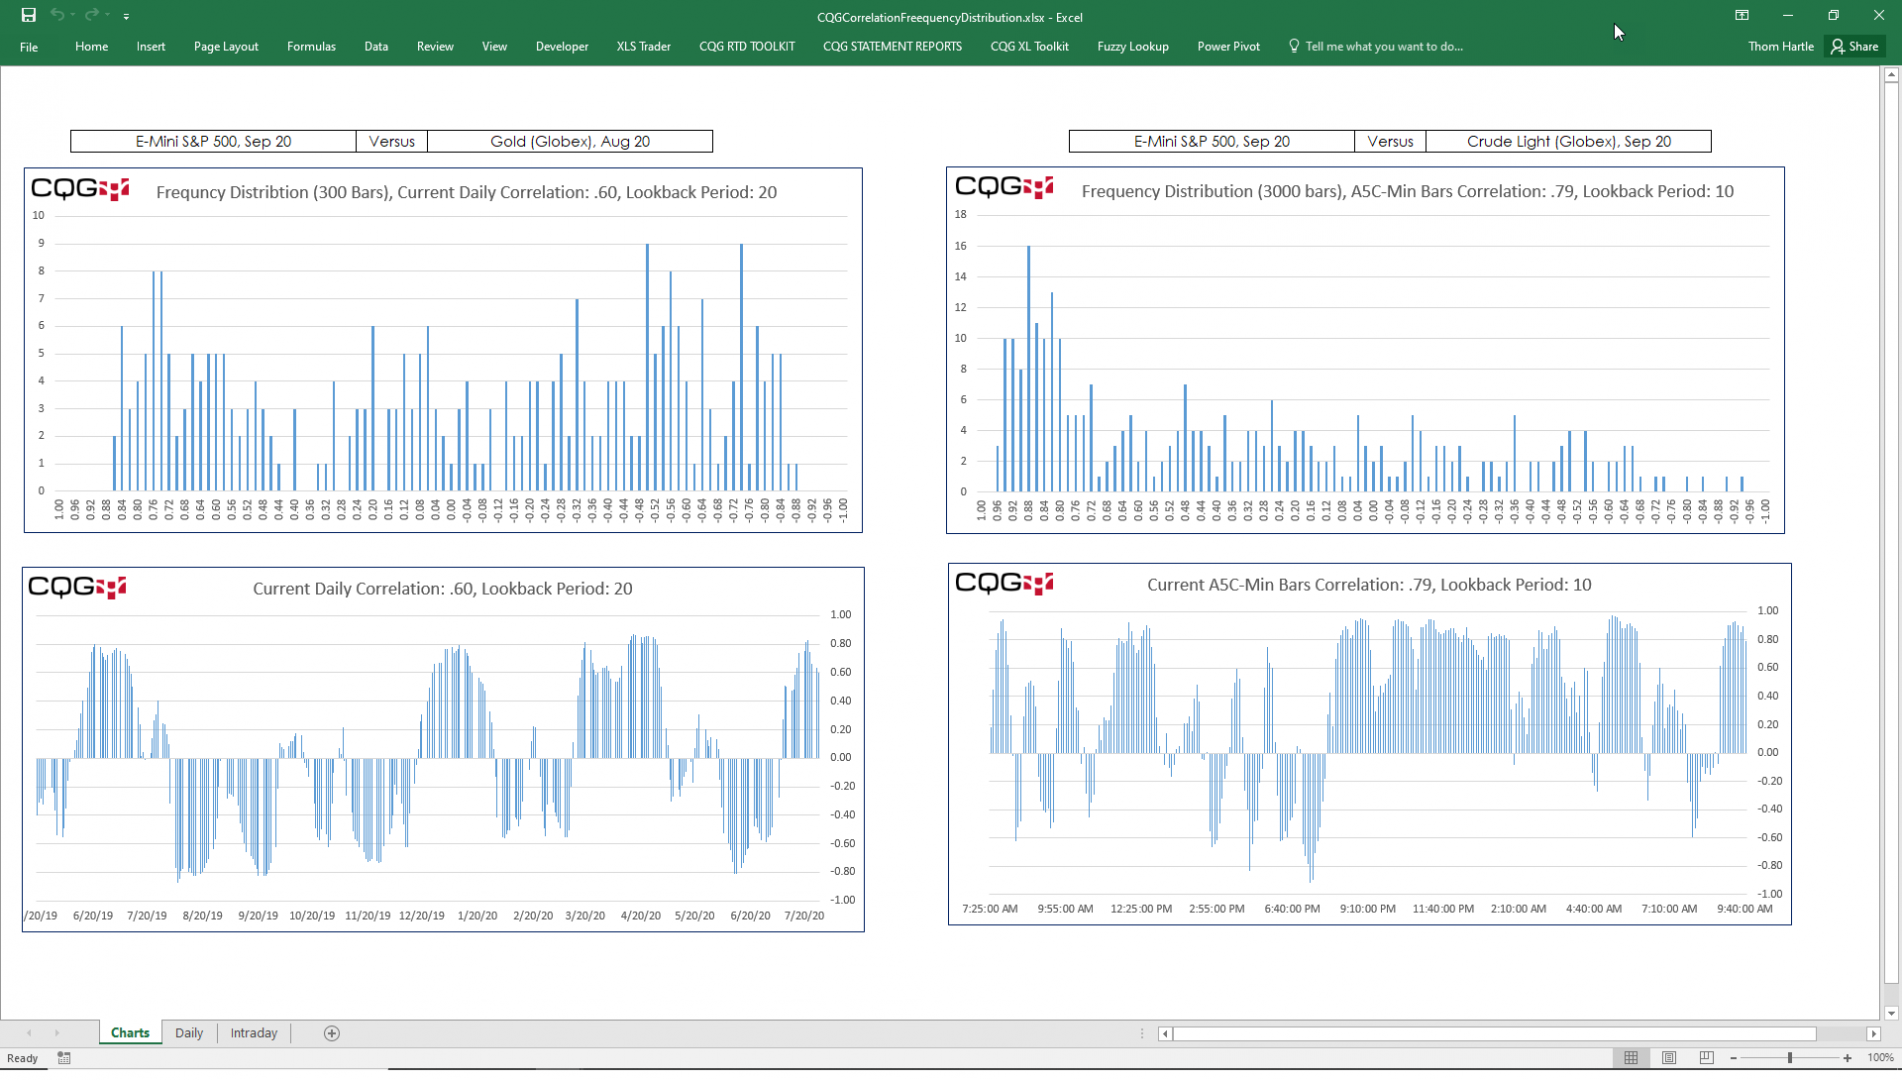
Imagine that today the 20 day correlation between the E-mini S&P 500 futures contract (symbol: EP) and the Crude Oil Contract (symbol: CLE) is 0.82. Now, is that a typical value or an unusual… more
Excel/RTD
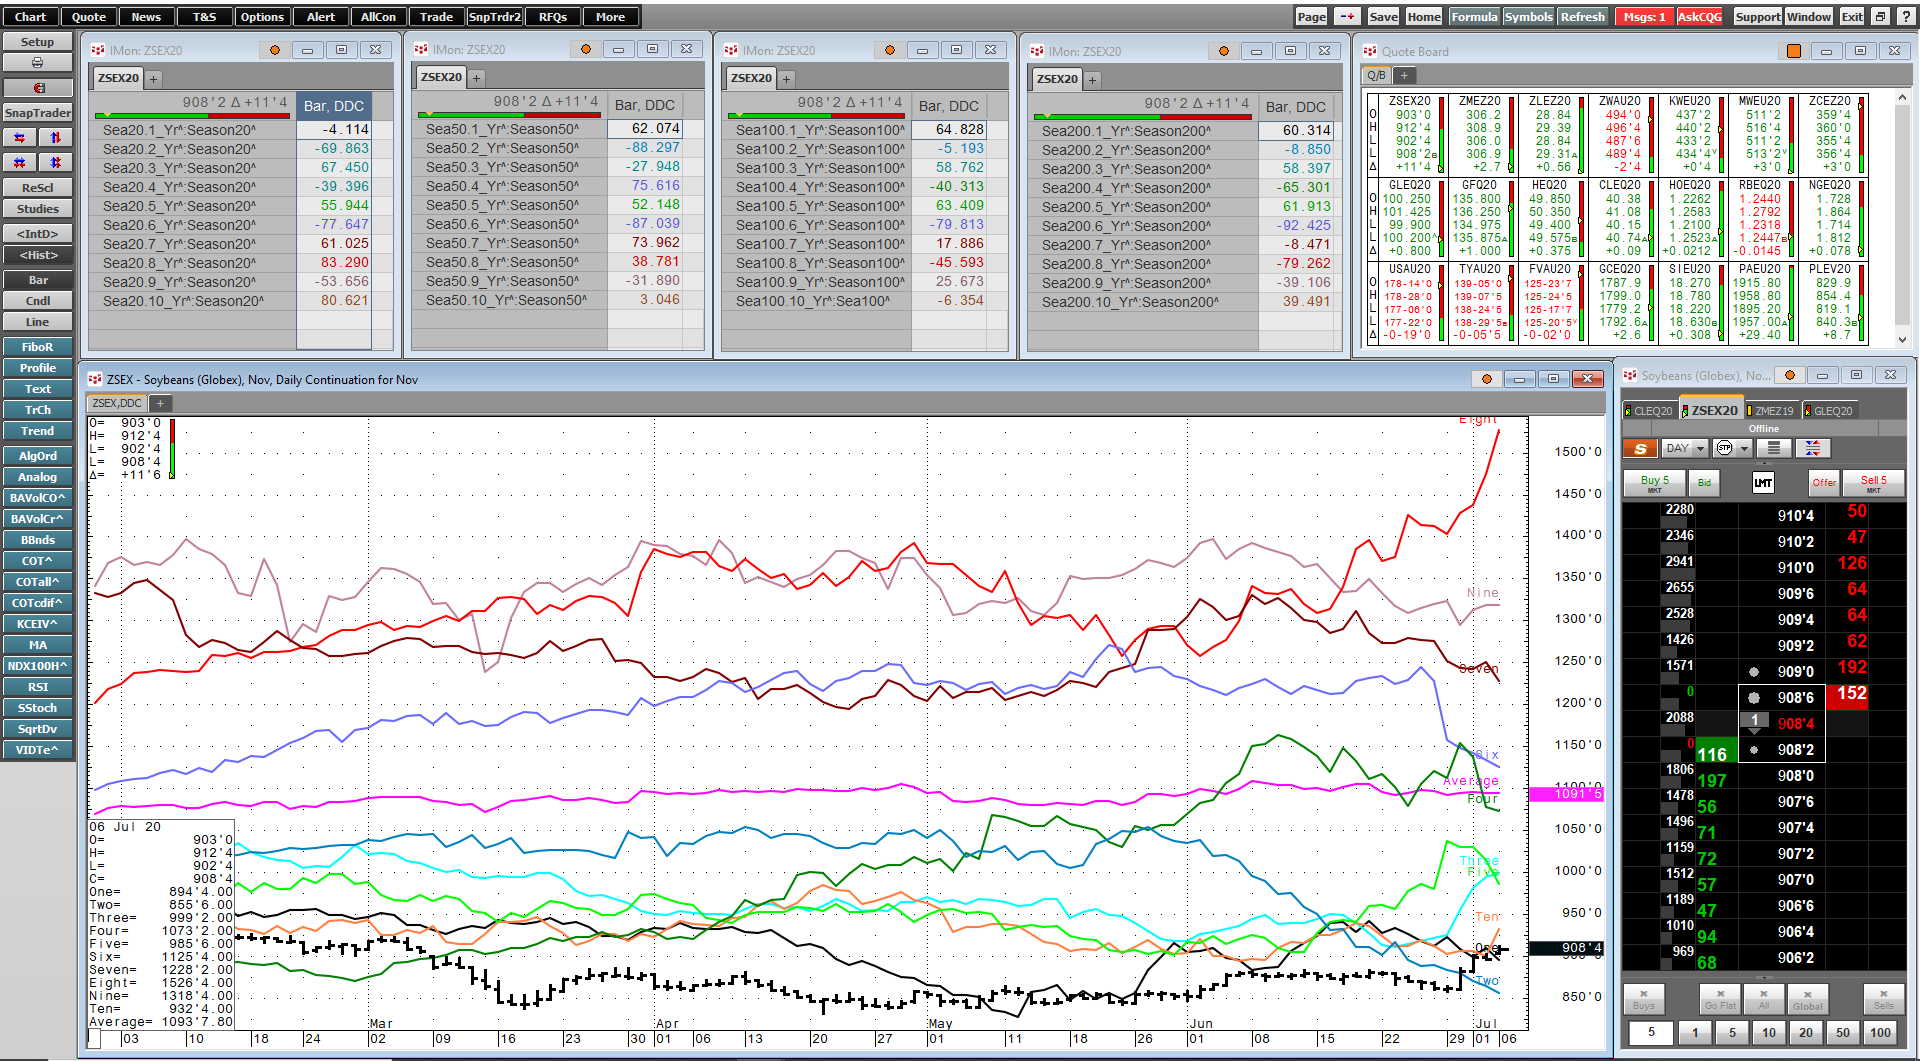
CQG’s Integrated Client and QTrader Version 2020 offers a new study called the Seasonal Study. This study is very popular with analysts and traders in the agricultural markets because of the… more
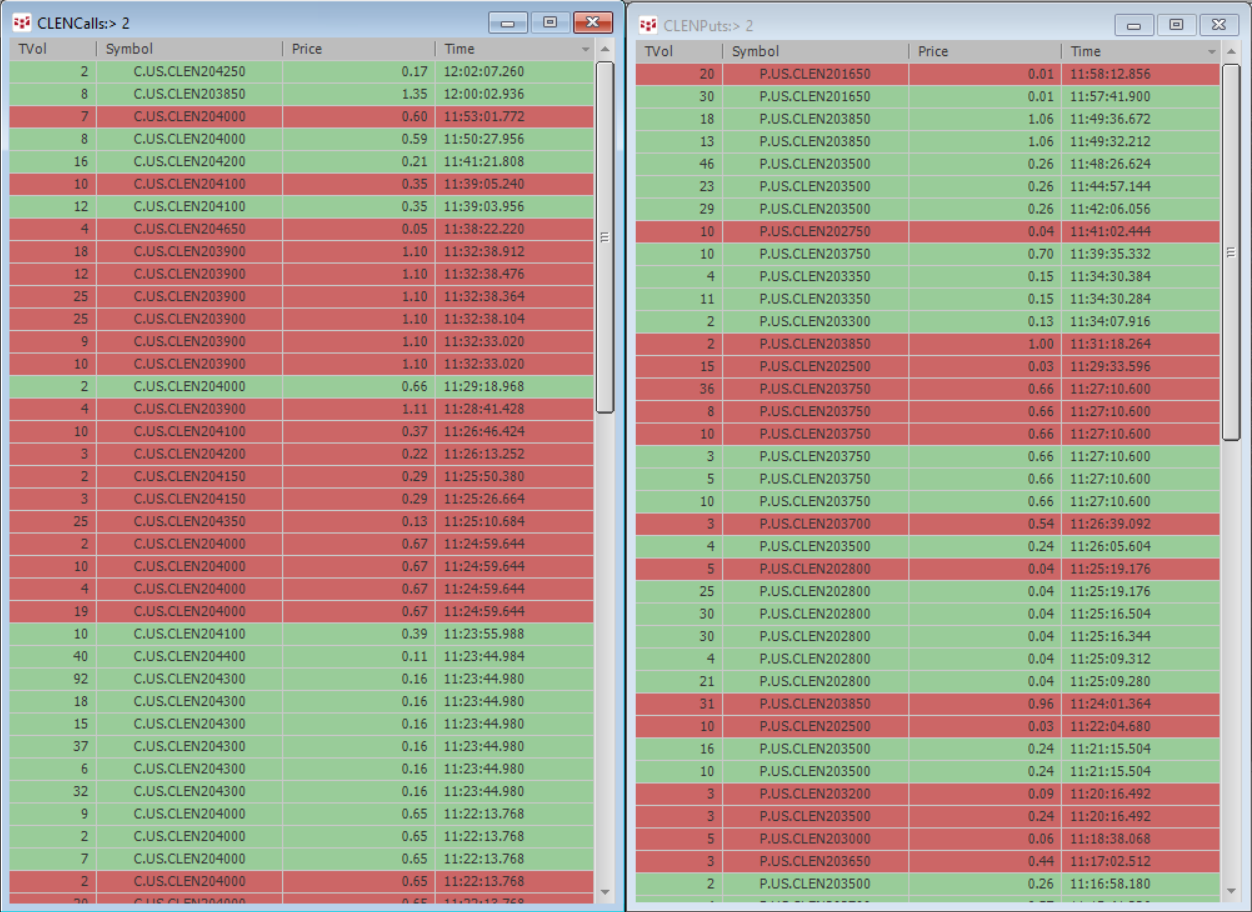
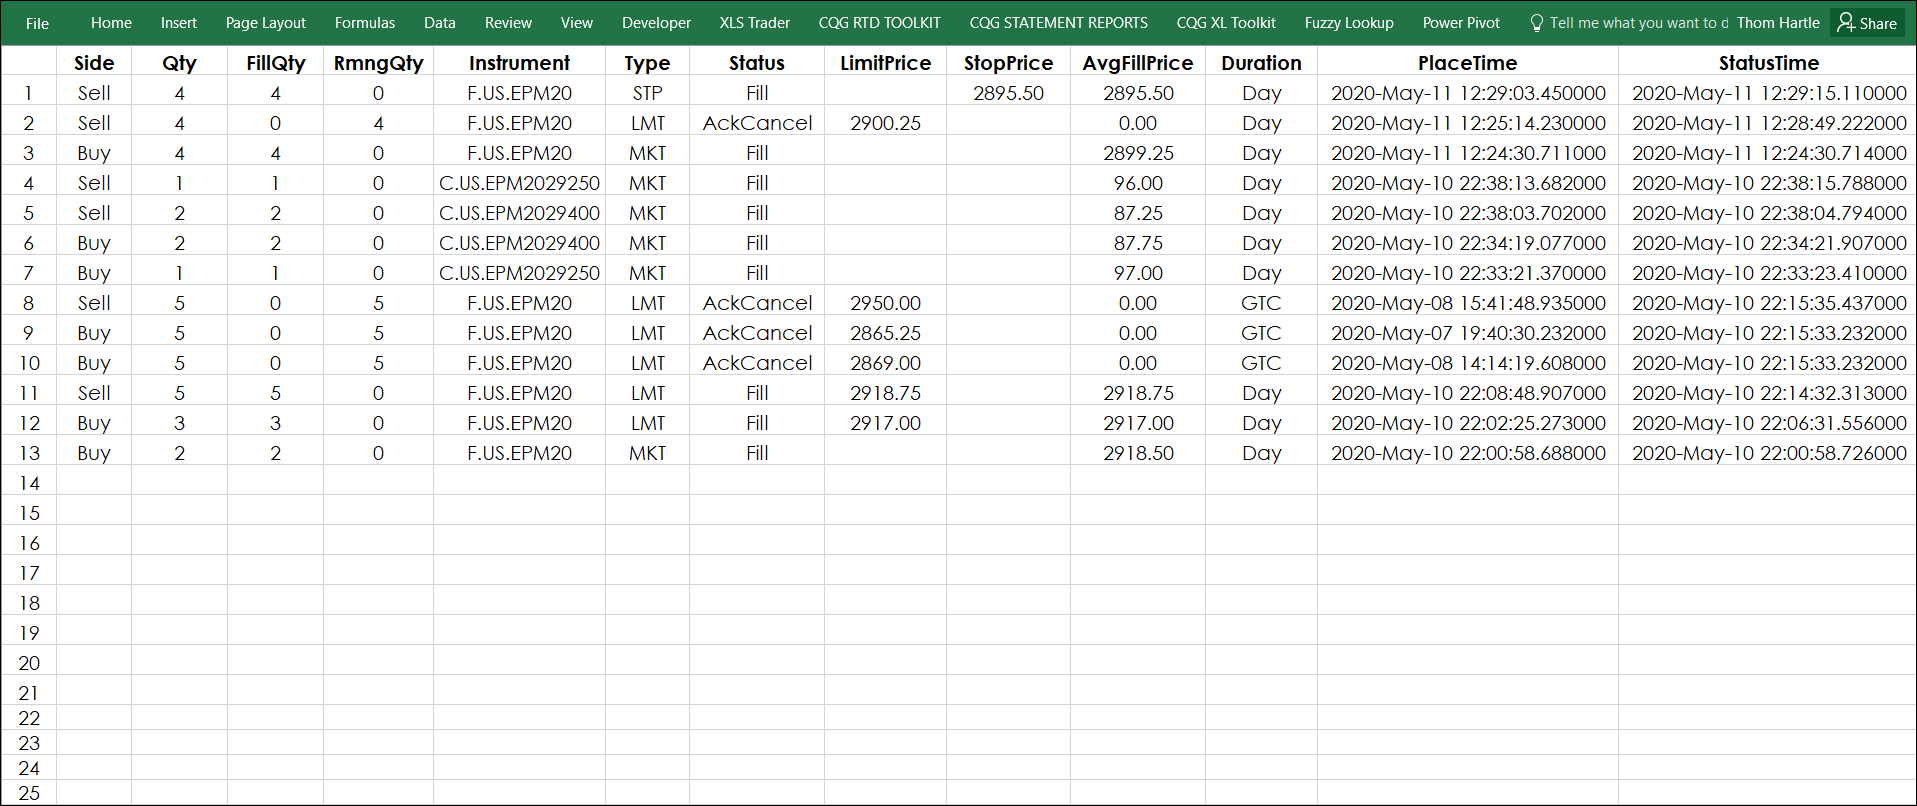
CQG’s Portfolio T&S Monitor displays trades using a time & sales format for a portfolio of instruments. The standard T&S display shows you trading activity for just one instrument.… more
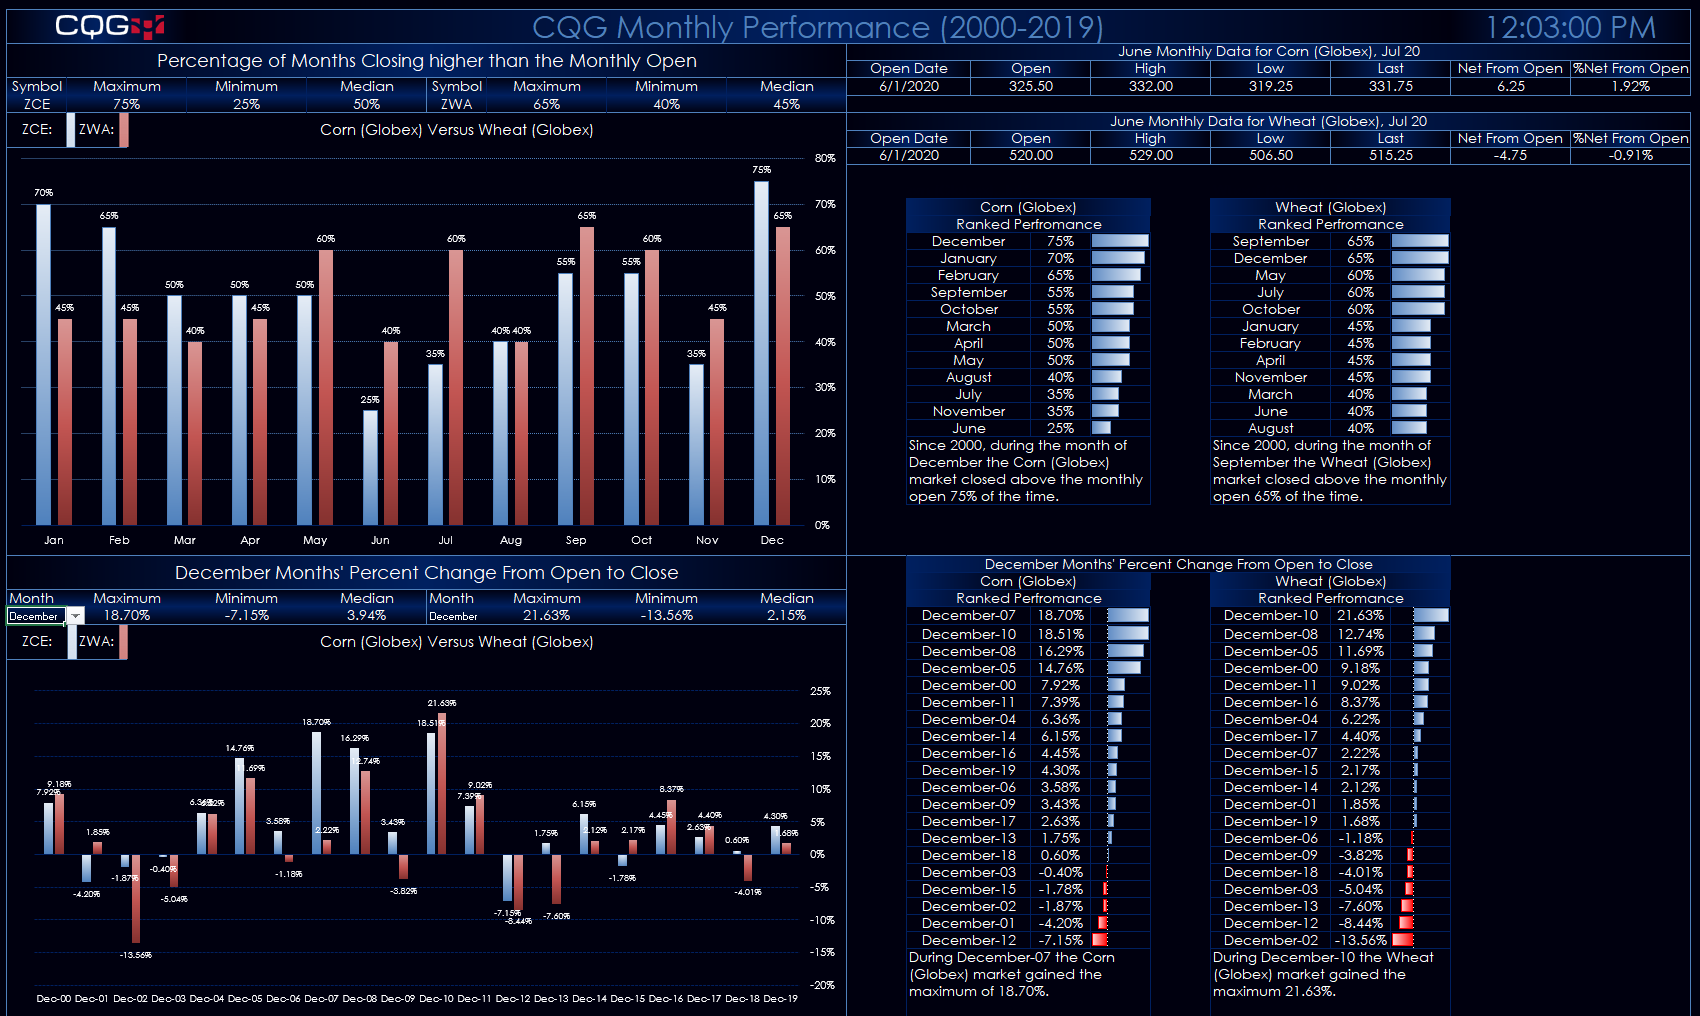
The updated dashboard uses active monthly contracts for the futures rollover. This Excel® dashboard pulls monthly data and provides analysis of user selected markets from 2002 to 2022. The… more
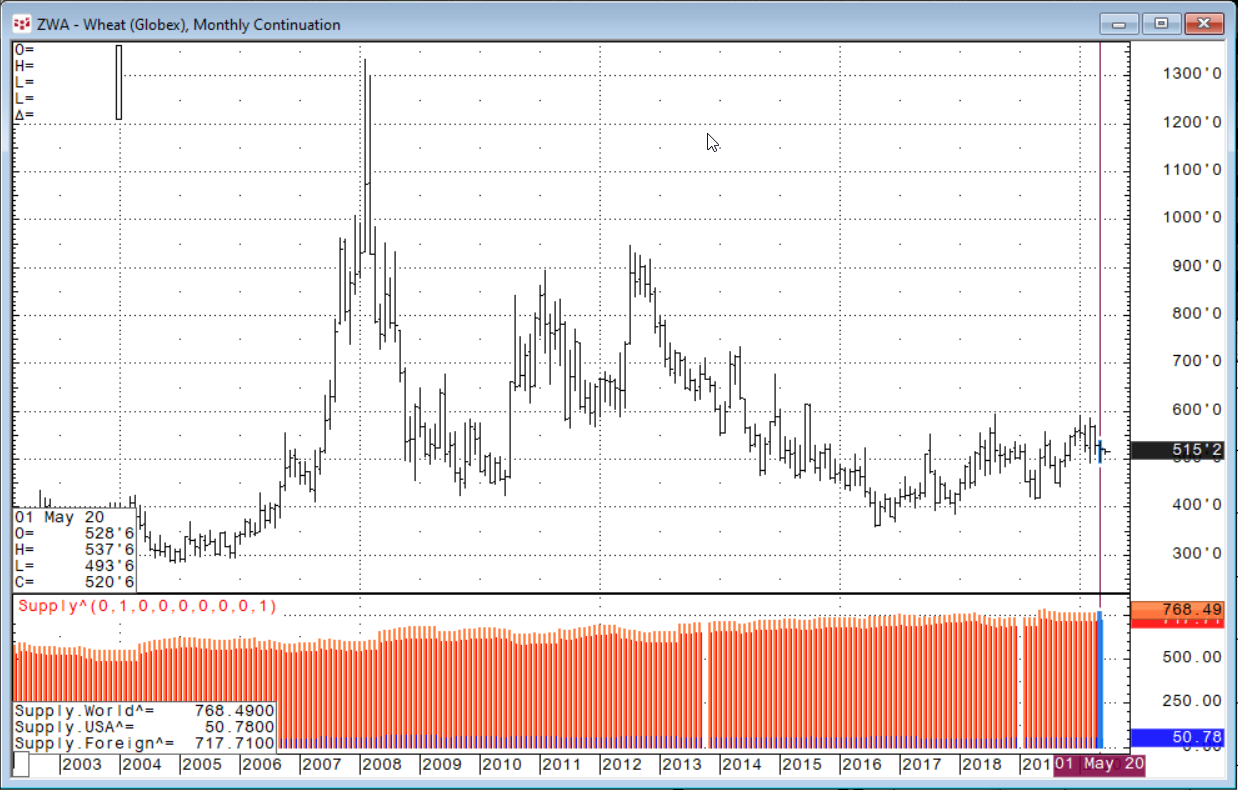
United States Department of Agriculture-World Agriculture Supply and Demand Estimates reports are a critical component to gaining insight into both the international and domestic demand and supply… more
The CQG XL Toolkit Add-In for Microsoft Excel® pulls today's market data, orders data and open positions data into Excel via the Internet. Historical data is not available. CQG products do not… more
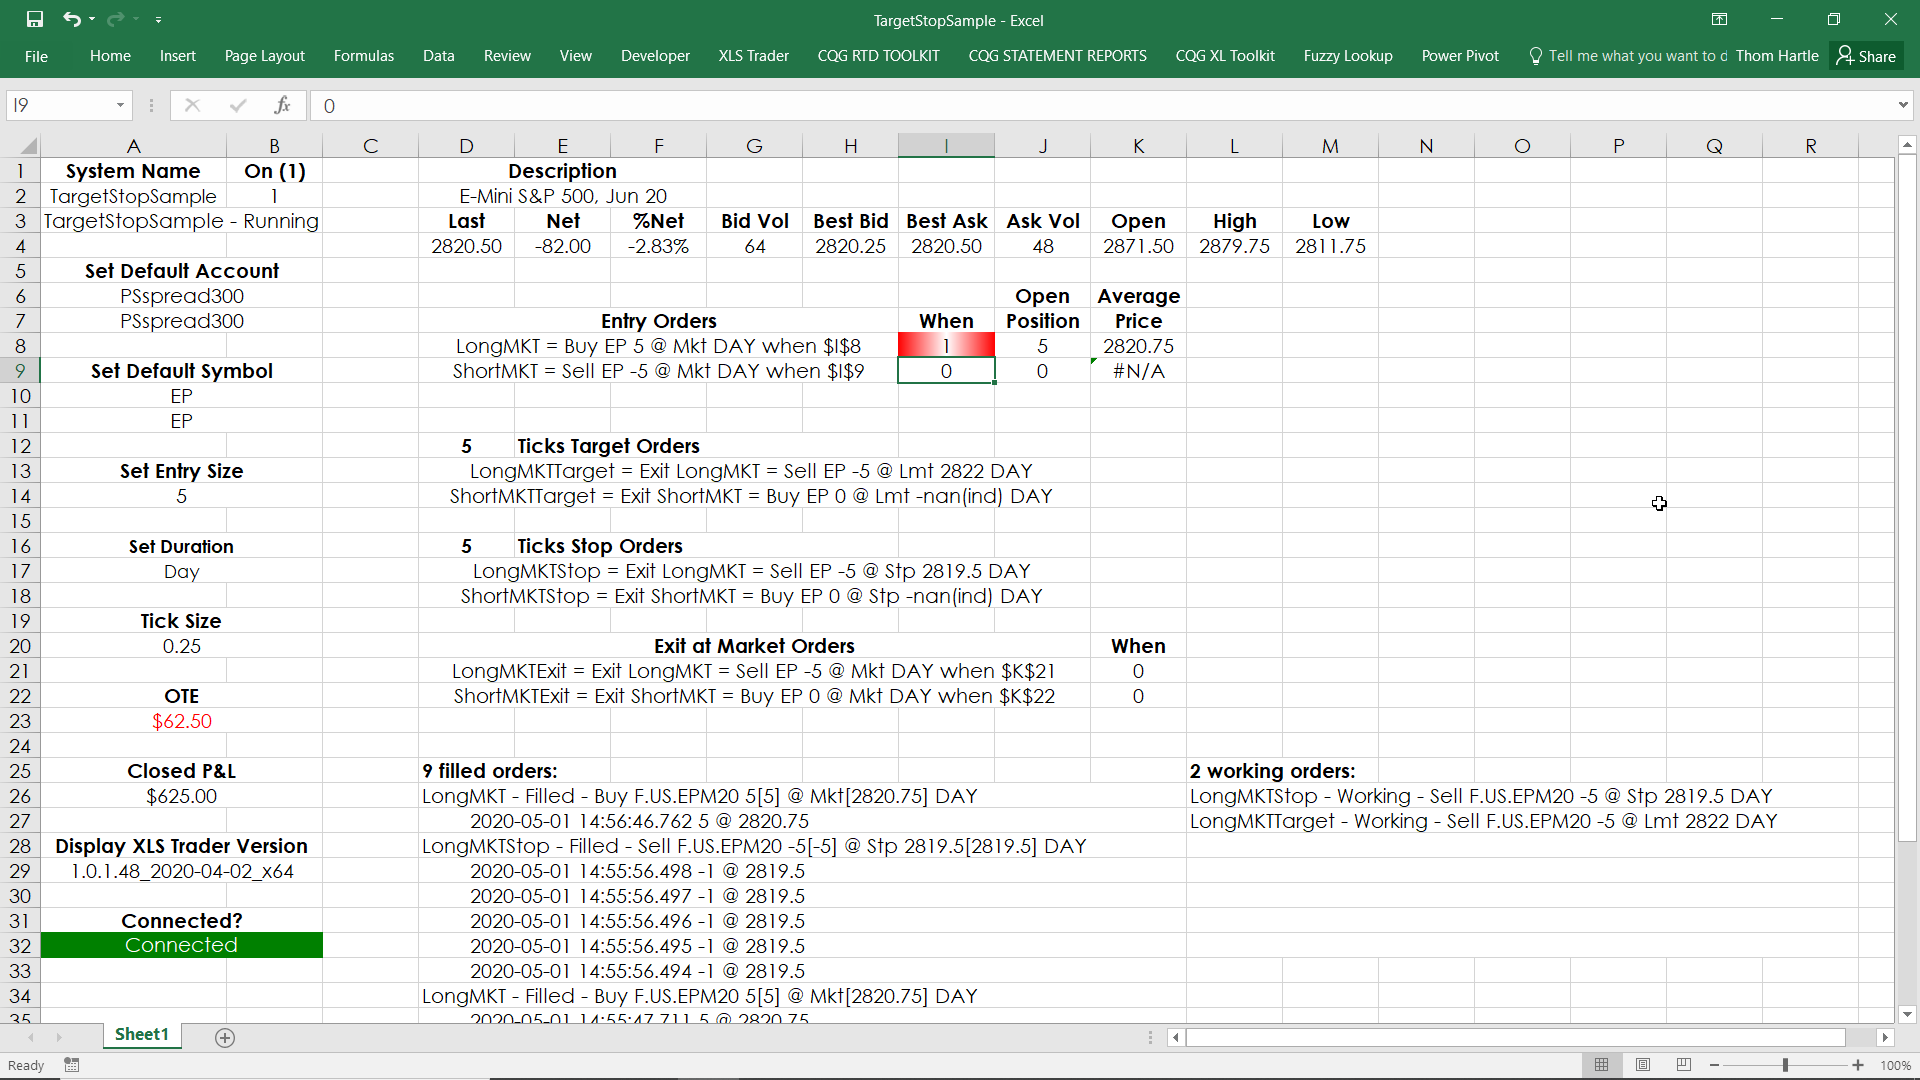
This sample XLS Trader worksheet uses market orders to enter into positions. When filled, XLS Trader will automatically enter in a target and a stop order, which are OCO orders (one cancels the… more
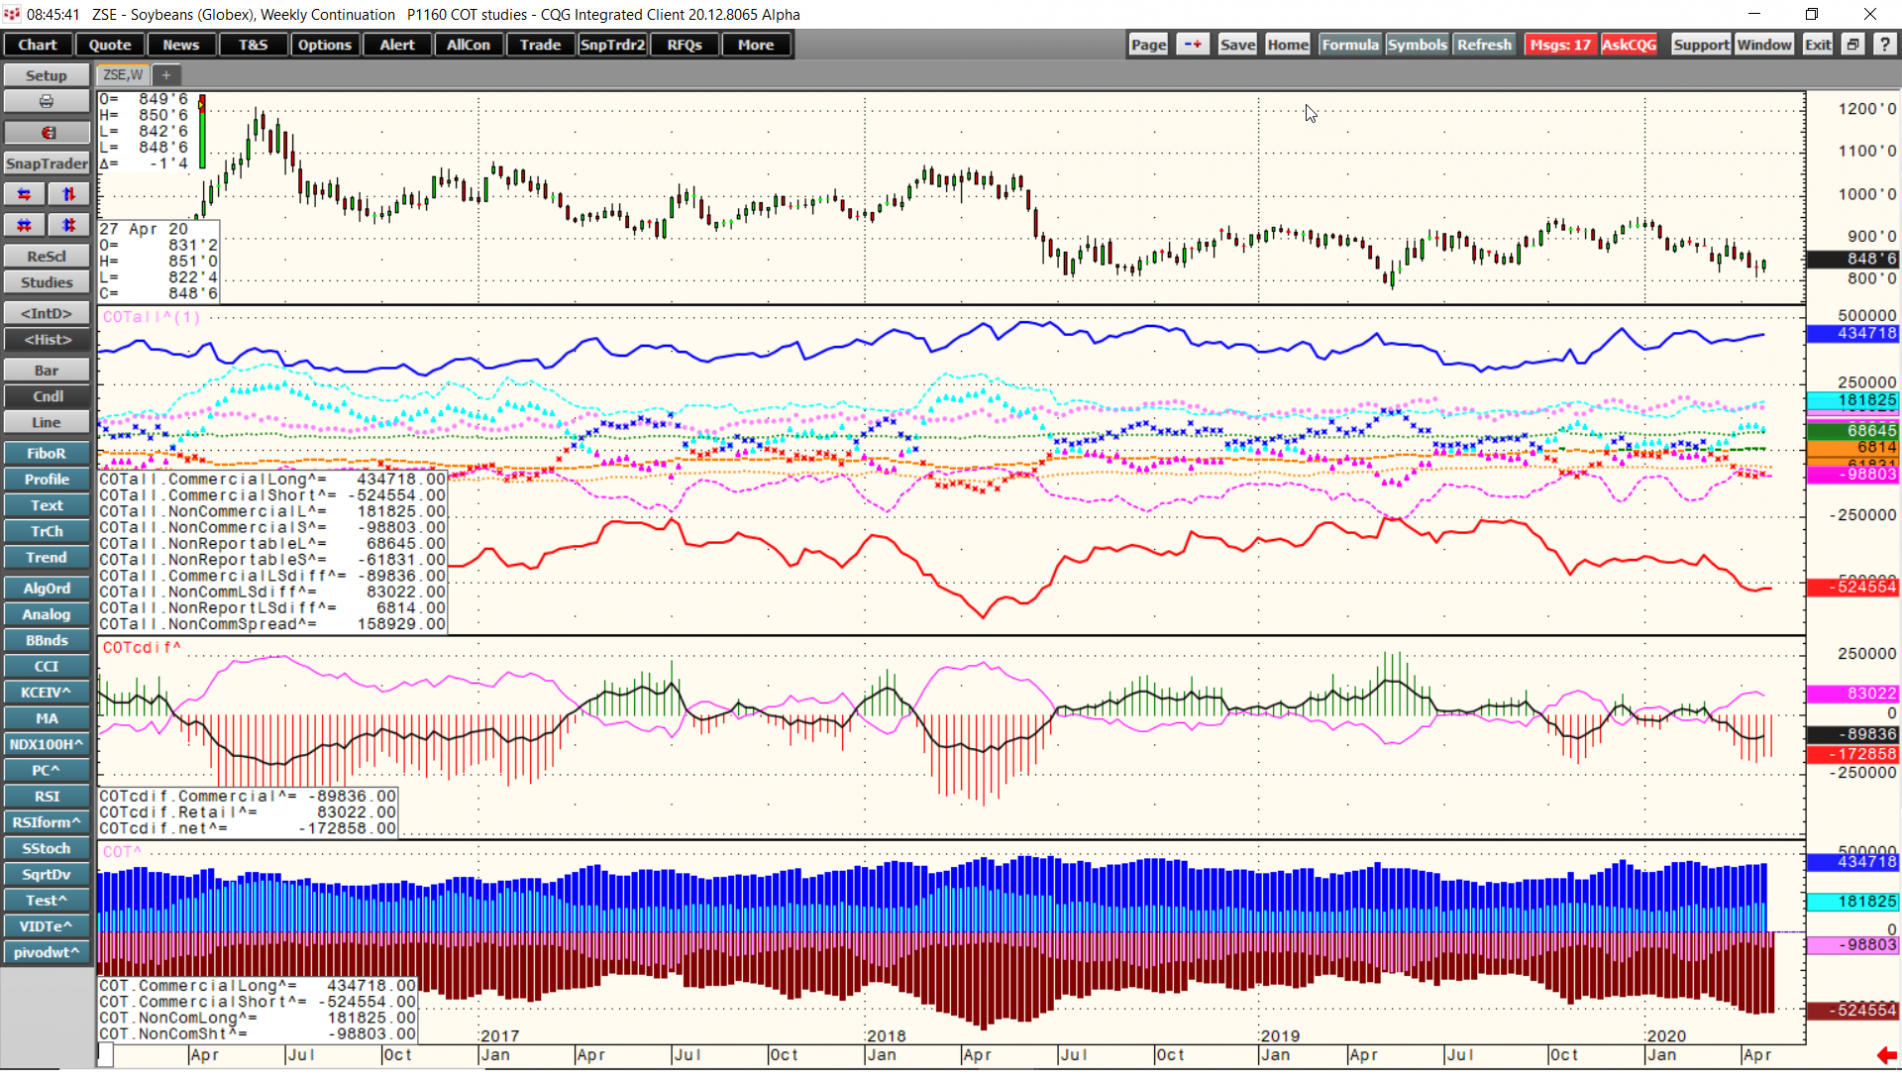
CQG Product Specialist Jim Stavros has created a downloadable CQG PAC that has three new CFTC COT Studies designed to aid in analysis of the COT reports: COTAll, COTcDiff and COT.
COTAll… more
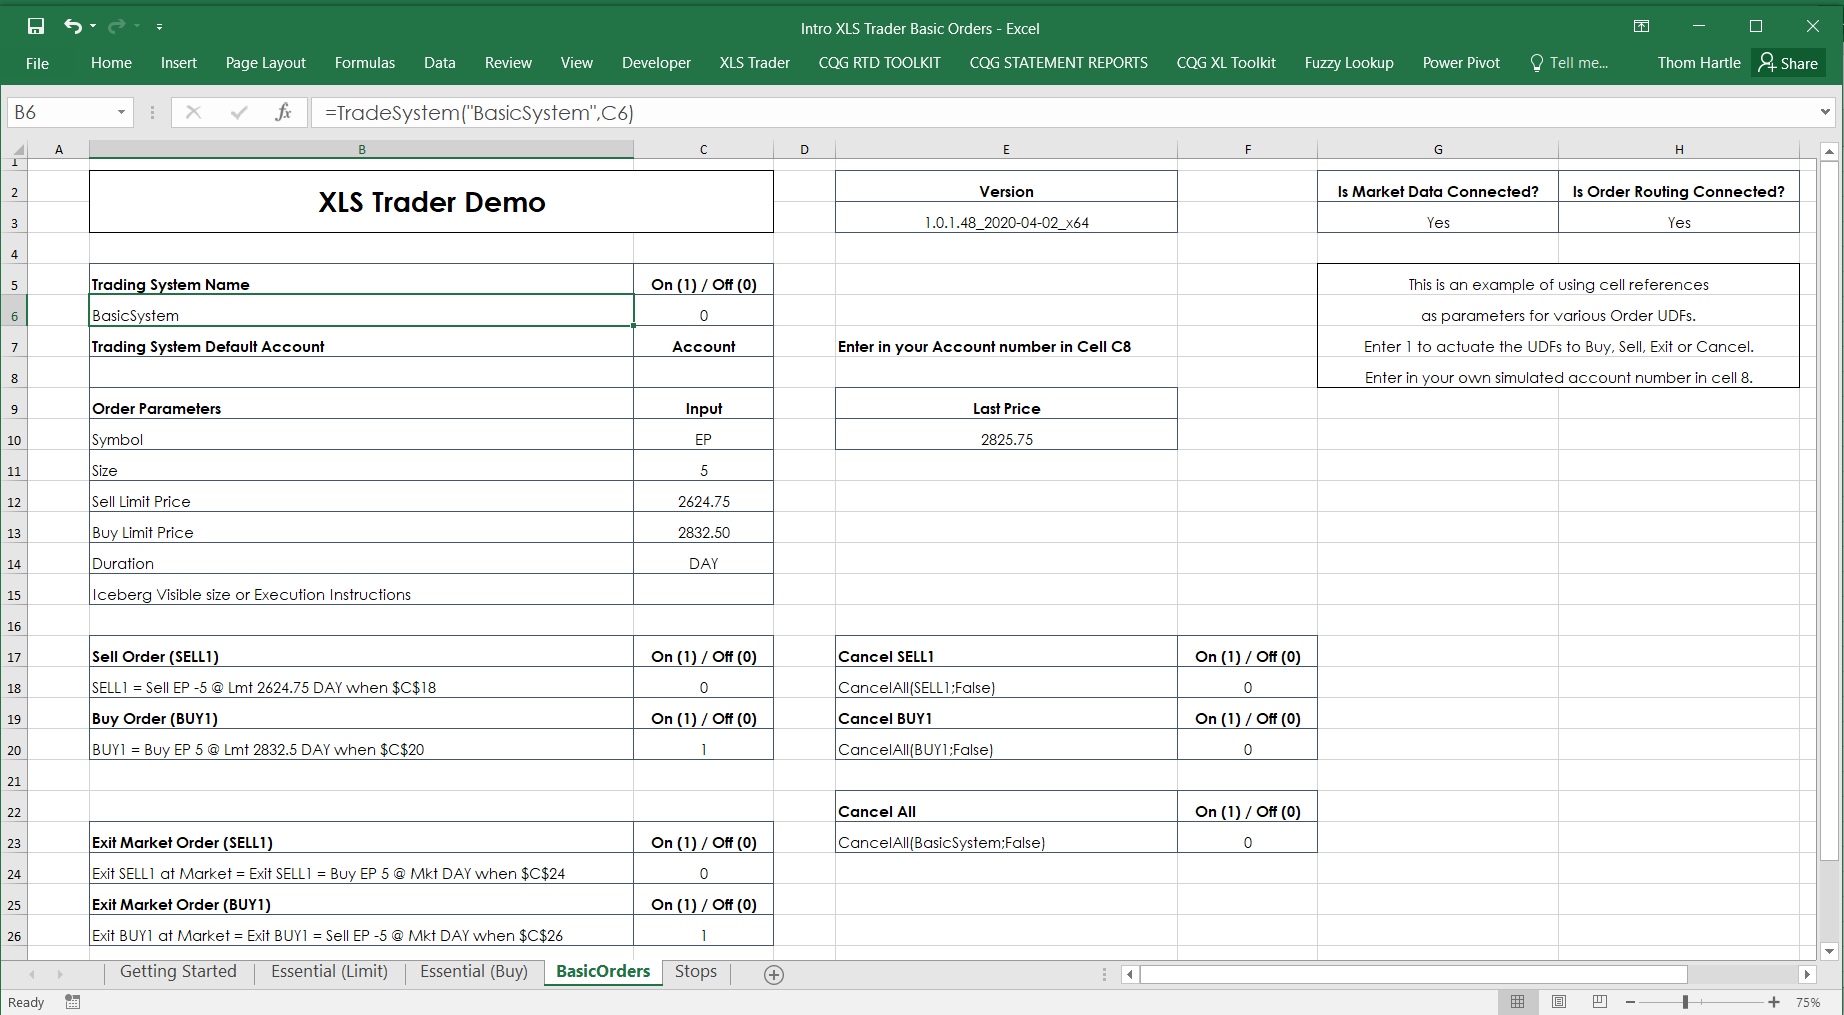
XLS Trader offers CQG Integrated Client customers the ability to route and manage orders directly from Microsoft Excel®. Now, you can create models within Excel that can be the basis for… more
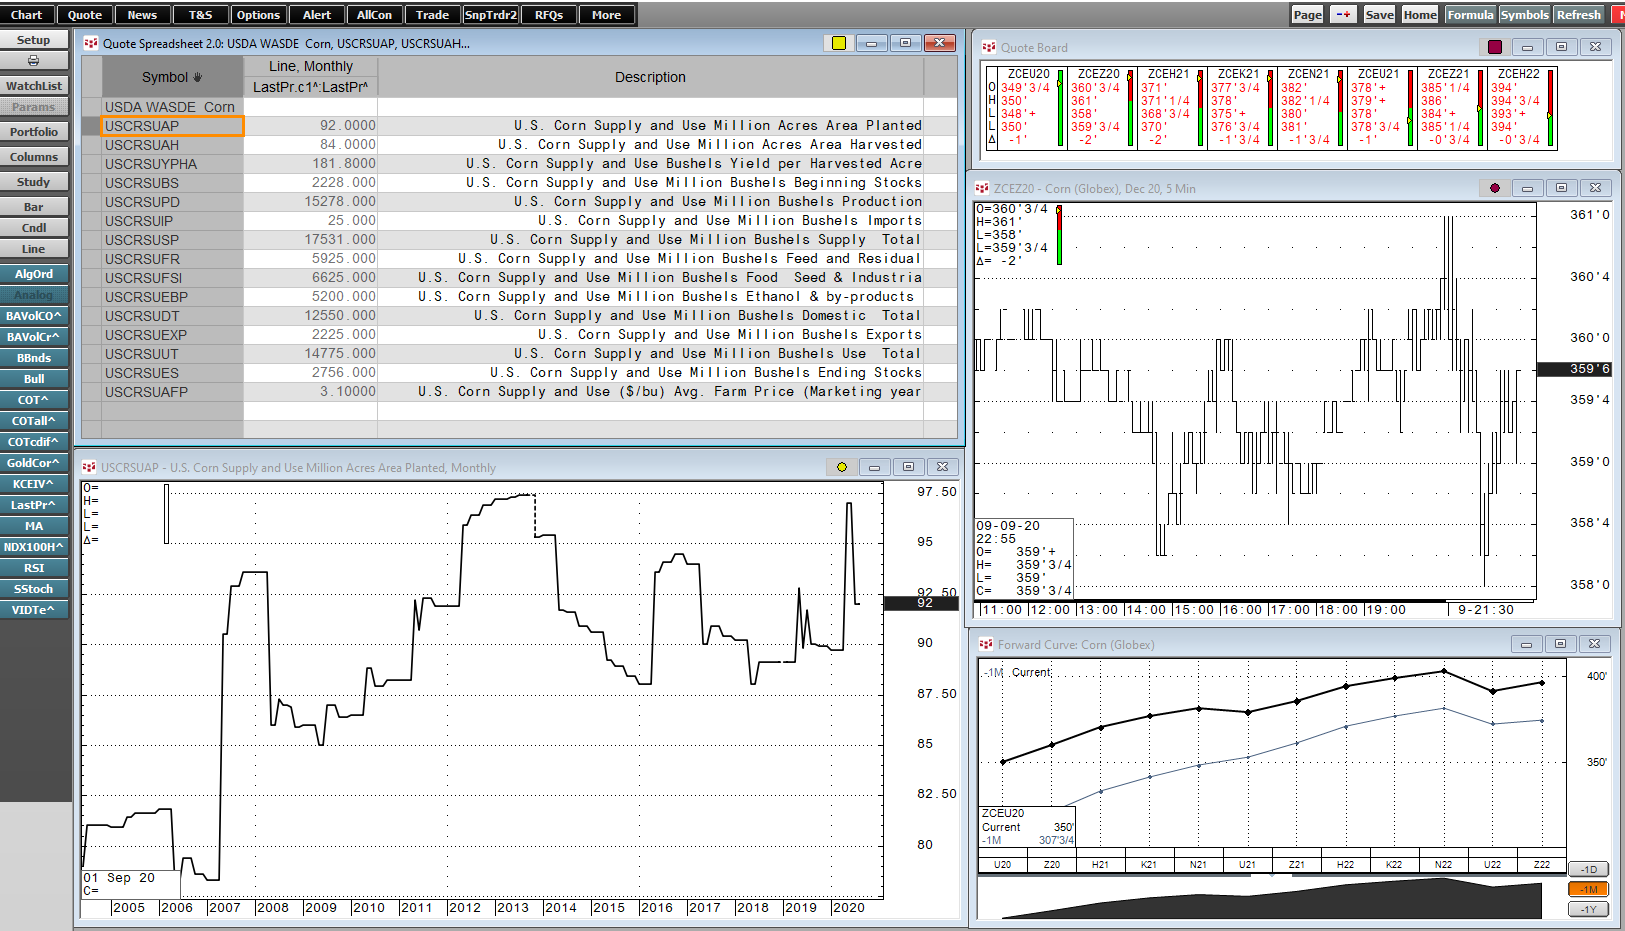
CQG has added the World Agricultural Supply and Demand Estimates (WASDE) data to the data feed. Published monthly by the United States Department of Agriculture (USDA), the World Agricultural… more