This recent post "Quote Spreadsheet 2.0 TTM Squeeze and More" provided a page installed via a CQG PAC that included a CQG QSS V2 for monitoring the markets. The benefit of the Quote Spreadsheet 2.… more
Excel/RTD
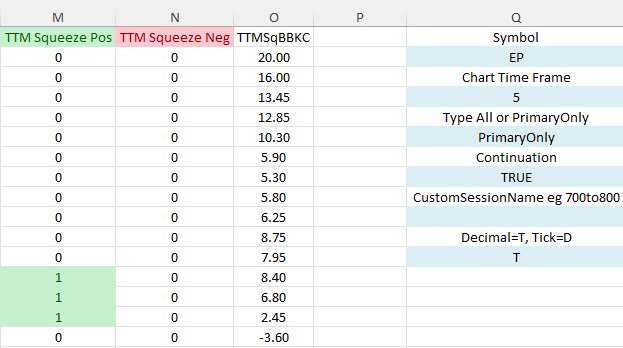
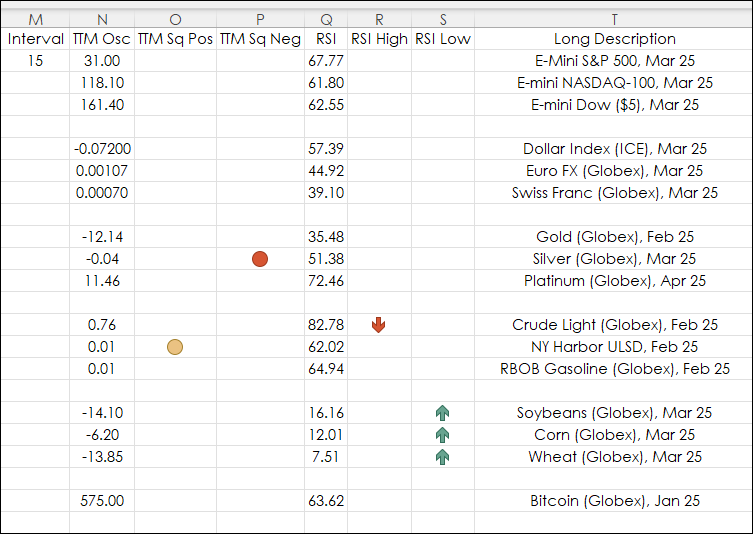
This post "TTM Squeeze Indicator" detailed the TTM indicator, which is a combination of measuring volatility and momentum. The volatility is a condition where the Bollinger Bands contract and move… more
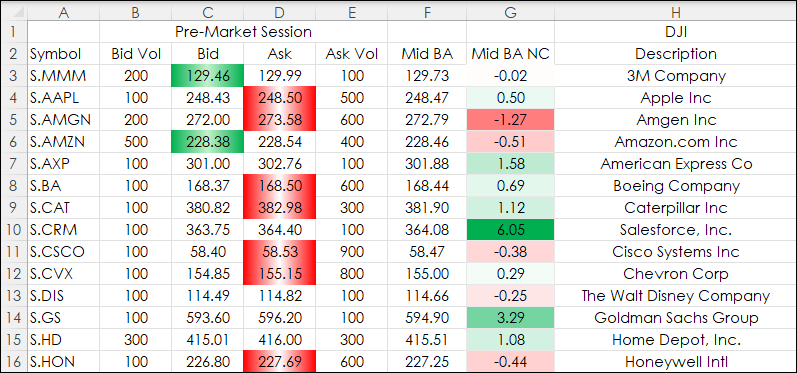
Recent posts detailed observing market data during pre-, current, and post-market sessions. The post View Pre and Post Sessions for Stocks detailed the steps to displaying a chart that included… more
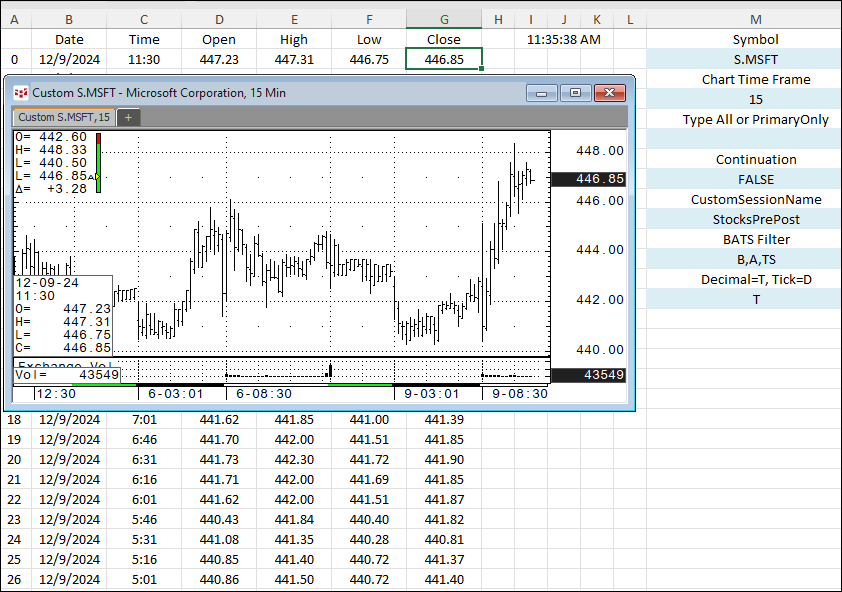
This post, View Pre and Post Sessions for Stocks, detailed creating a custom session in CQG IC or QTrader to view on a chart pre-market and post market Bid and Ask activity for stocks.
… more
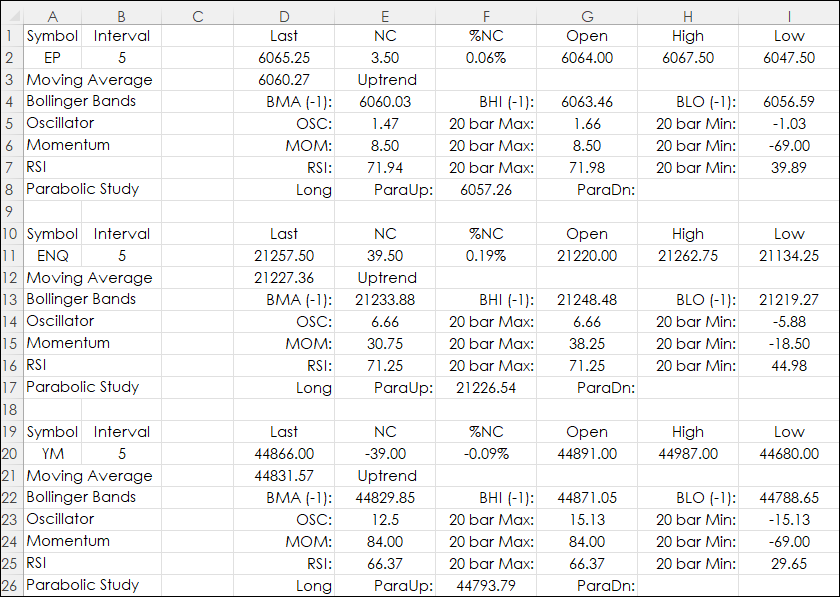
Excel users with RTD links to both market and study data can design a real-time dashboard that can monitor a portfolio of instruments and the status of various studies. This is the topic of this… more
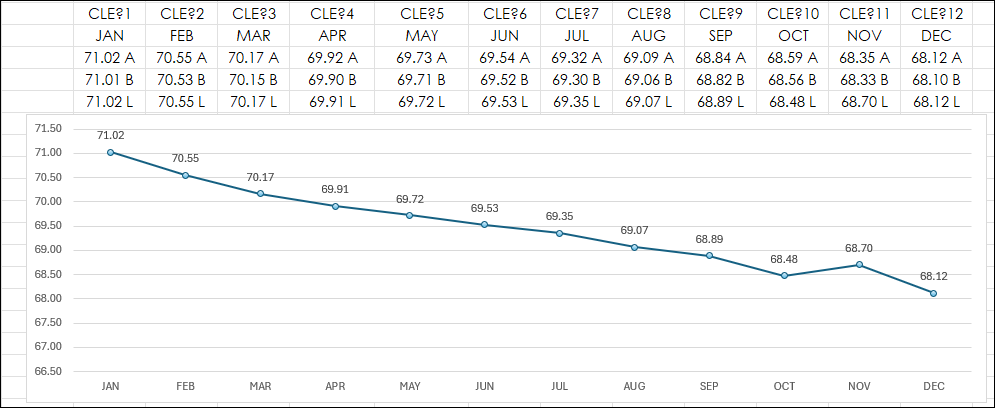
Traders who look to forward curves for analysis can create forward curves using Excel RTD calls. This post details some ways to create forward curves and some "tricks" to make the forward curves… more
The forward curves dashboard displays futures contracts White Maize (symbol: WMAZ), Yellow Maize (symbol: YMAZ), Wheat (symbol: WEAT), Soybeans (symbol: SOYA), and Sunflower Seeds (symbol: SUNS),… more
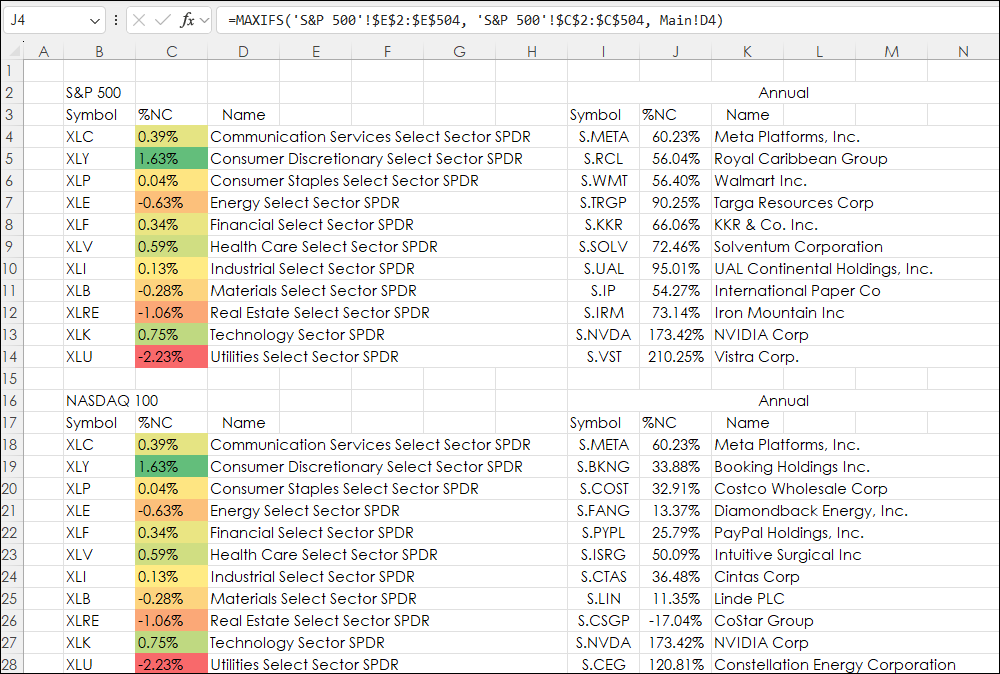
The Excel MAXIF function returns the maximum value from a range of cells and a criteria range. For example. The downloadable sample at the bottom of this post is determining the best performance… more
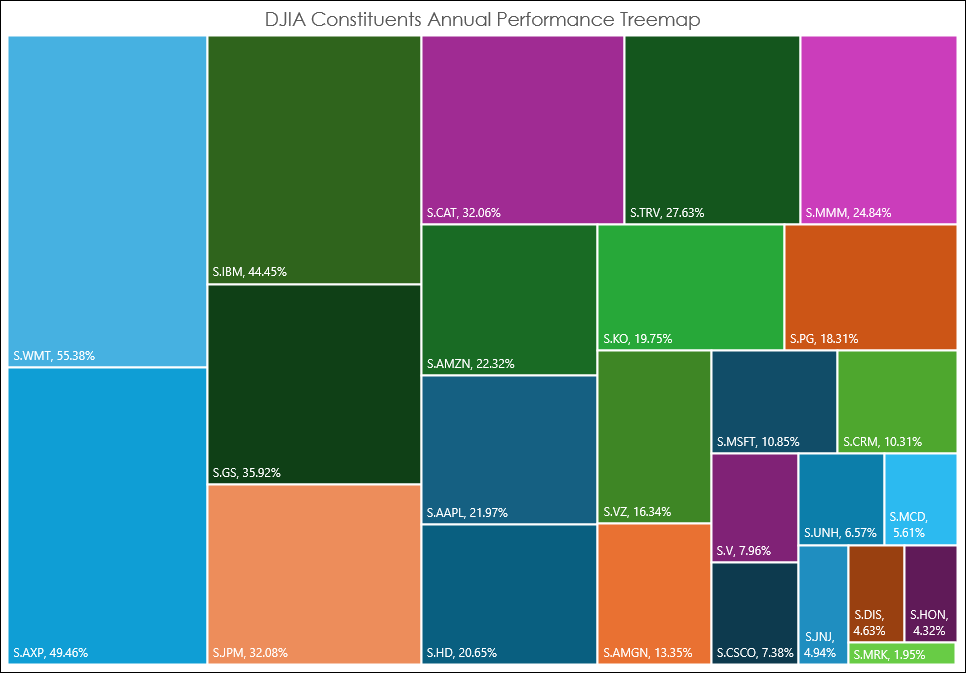
The Excel Treemap chart displays a hierarchical view of the data. The Treemap chart below displays the annualized performance of the 30 stocks in the Dow Jones Industrial Average. The size of the… more
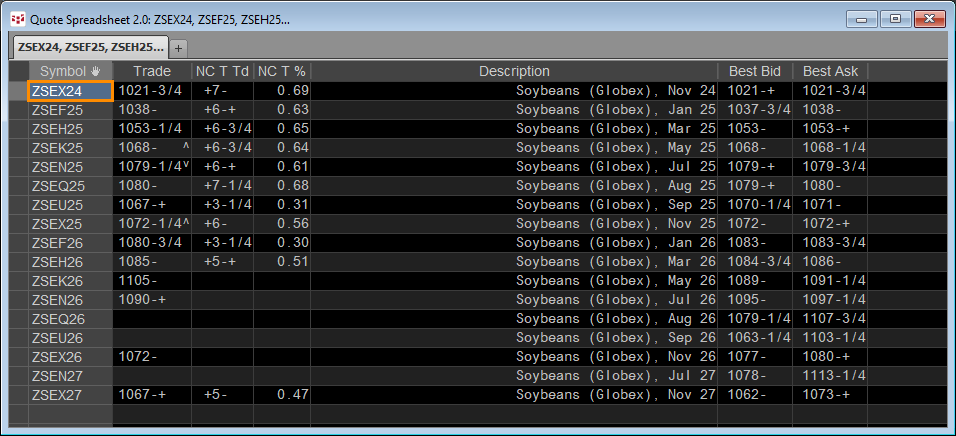
In the CQG Quote Spreadsheet the first symbol of a list of symbols can be entered and then hitting the key combination of CTRL+Enter will populate the spreadsheet with all of the available symbols… more