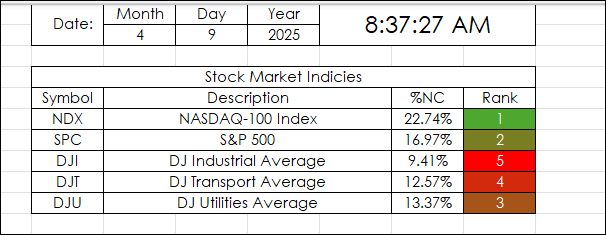
This Excel Dashboard uses RTD Calls to pull in the Net Percent Change of a collection of markets by a particular date.
For example, April 9, 2025:
"Markets News, April 9, 2025: Dow… more
This Excel Dashboard uses RTD Calls to pull in the Net Percent Change of a collection of markets by a particular date.
For example, April 9, 2025:
"Markets News, April 9, 2025: Dow… more
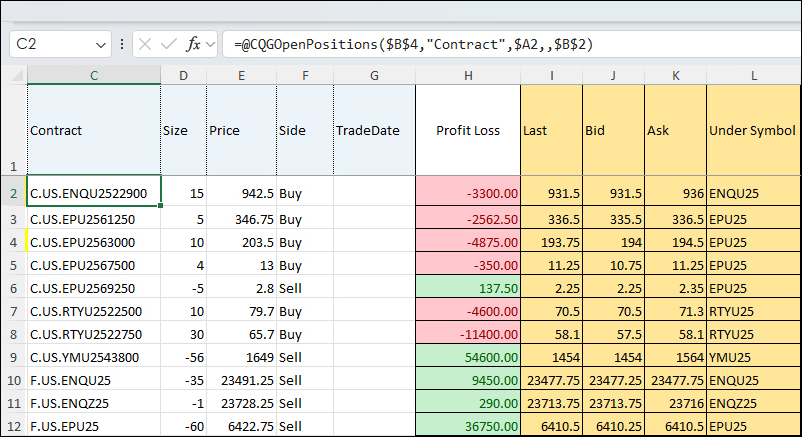
This spreadsheet built by CQG Product Specialist Jim Stavro uses RTD calls to pull in open futures and options positions as well as "Greeks" using RTD formulas.
To use the spreadsheet, CQG… more
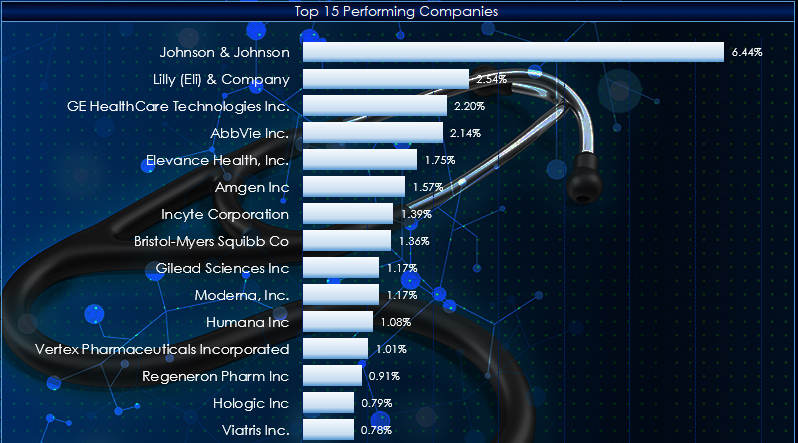
This macro-enabled Microsoft Excel® spreadsheet tracks the holdings of the Health Care Select Sector SPDR® (XLY). The ETF is based on the Health Care Select Sector Index.
There are 60 stocks… more
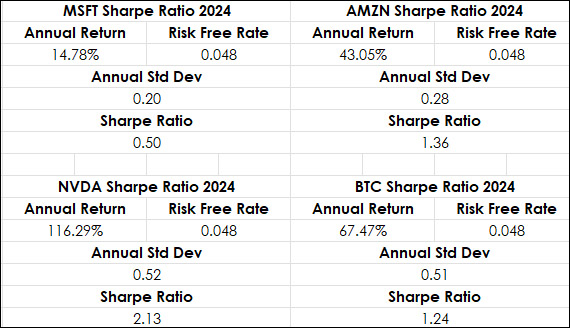
The Sharpe ratio measures the performance of an investment such as a security or portfolio compared to a risk-free asset, after adjusting for its risk. It is the difference between the returns of… more
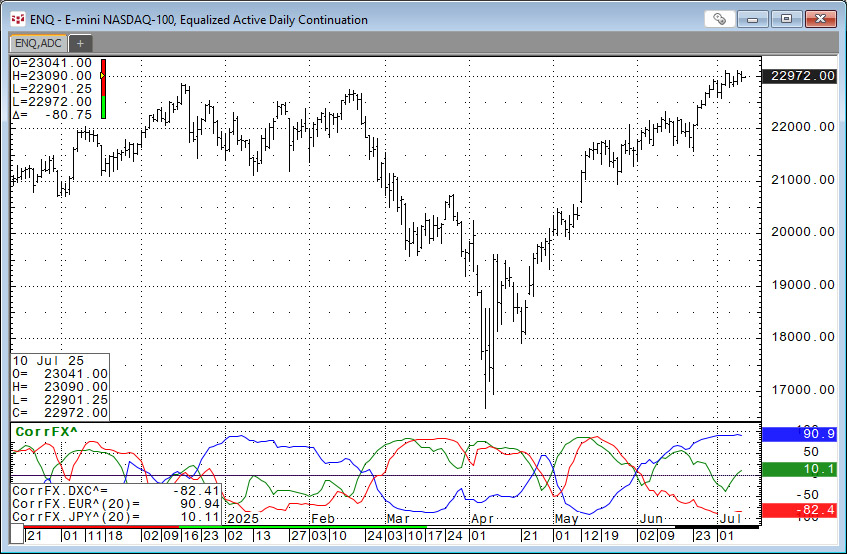
This function is available in the Add Study window and in the Formula Toolbox.
The function measures the strength and direction of the price movement of two symbols over a defined number of… more
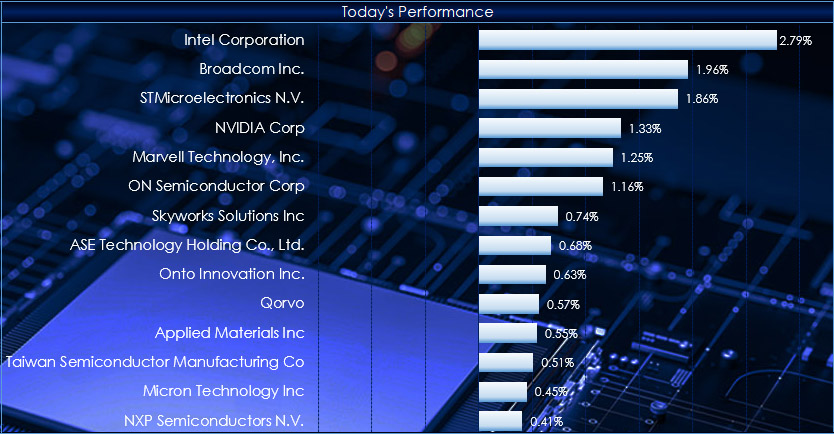
This macro-enabled Microsoft Excel® spreadsheet tracks the holdings of the iShares Semiconductor ETF (SOXX). The ETF tracks the investment results of an index composed of listed US equities in the… more
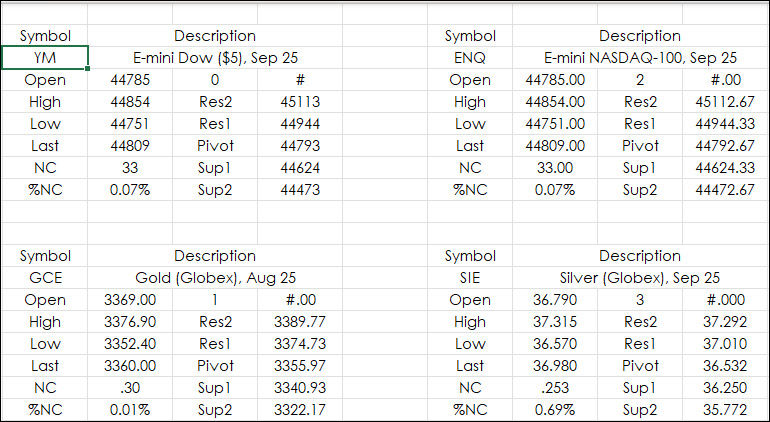
This post details bringing in the Pivot Points study values from IC or QTrader into Excel.
The pivot point is the arithmetic average of the high (H), low (L), and closing (C) prices of the… more
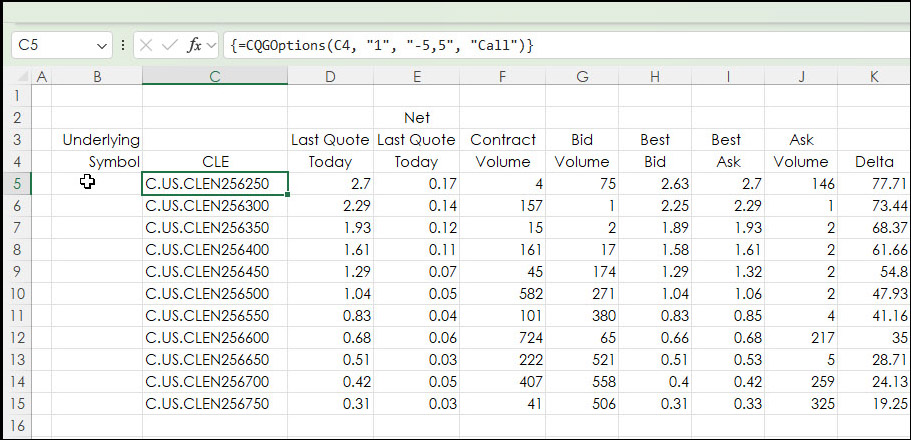
This post walks the reader through building option chains in Excel. The CQG RTD Toolkit offers this functionality, however, the same feature can be implemented using Excel's CONCATENATE function.… more
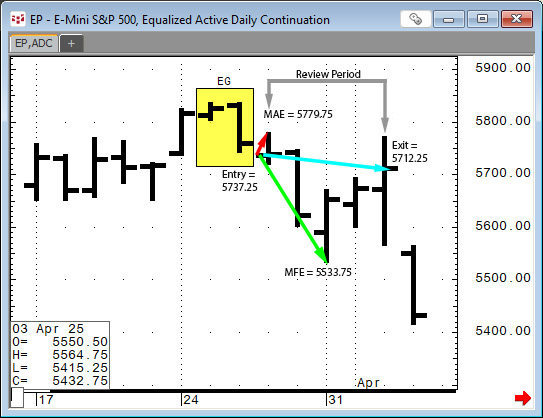
This post provides a guideline to reviewing the outcomes of a pattern recognition approach to the markets.
Two recent posts on Workspaces discussed CQG's Candlestick Formations Study.
… more
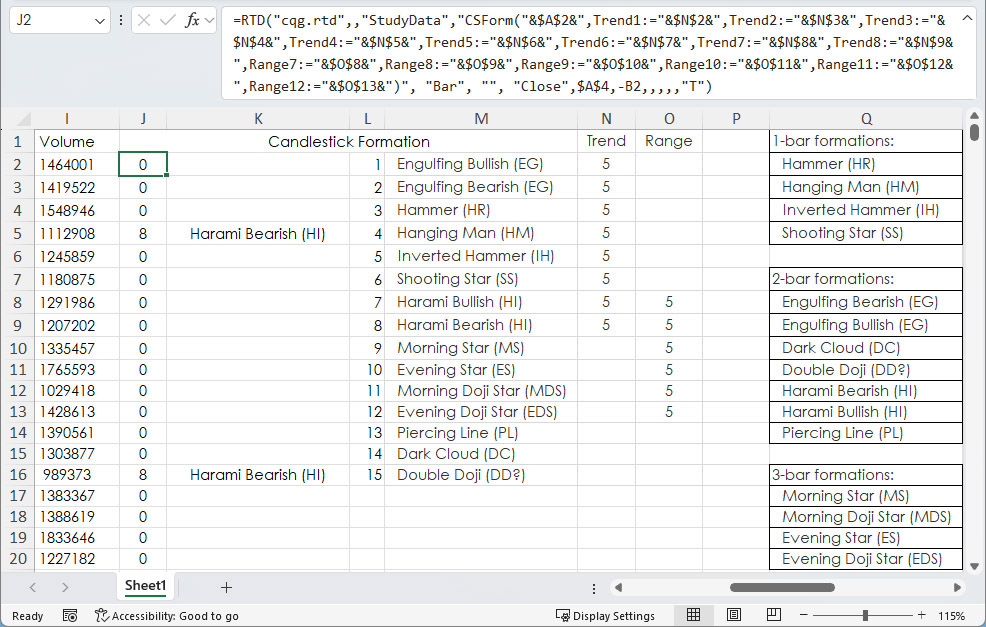
A recent post "CQG Primer: Candlesticks Formations Study" introduced this study available in CQG IC and QTrader. The study is a collection of fifteen conditions. The Candlestick formations appear… more