This function is available in the Add Study window and in the Formula Toolbox.
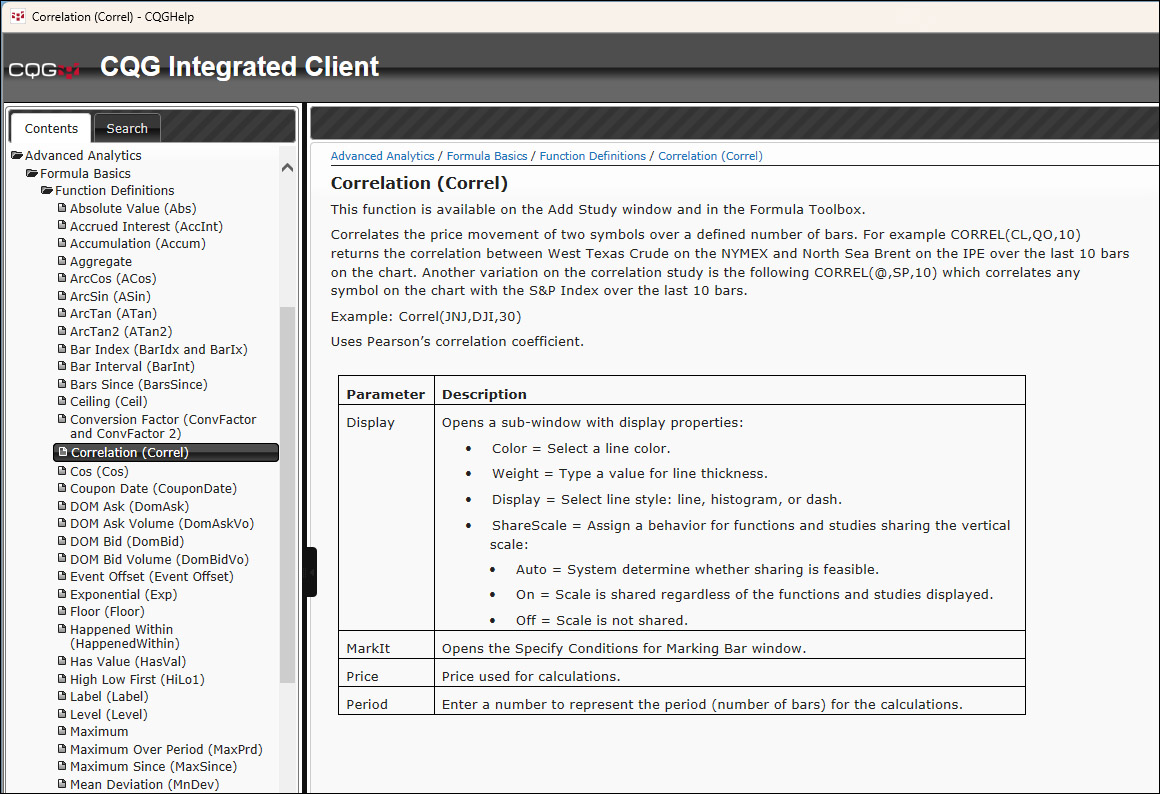
The function measures the strength and direction of the price movement of two symbols over a defined number of bars. For example, CORREL(CLE,QO,10) returns the correlation between West Texas Crude on the NYMEX and North Sea Brent on the IPE over the last 10 bars on the chart. Another variation on the correlation study is the following: CORREL(@,EP,10) which correlates any symbol on the chart with the E-mini S&P 500 Index over the last 10 bars.
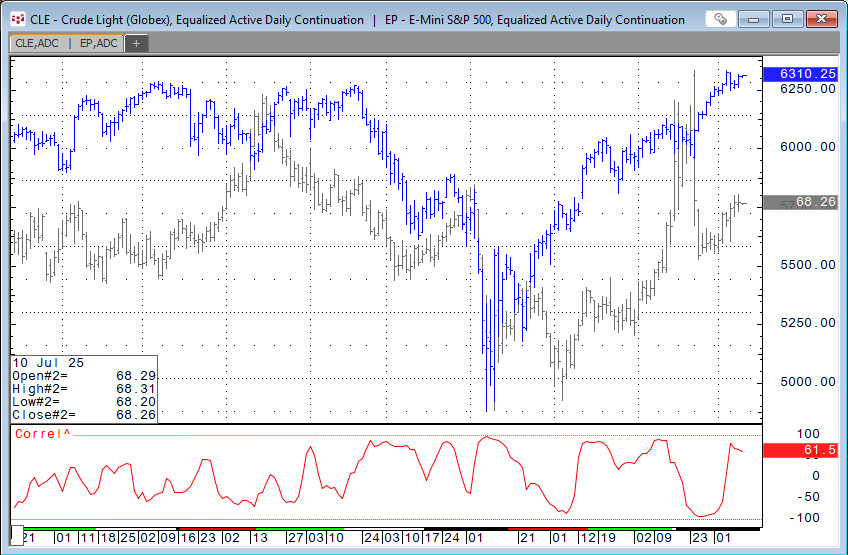
The above chart displays Crude Light (green) versus Emini S&P 500 (blue) on an Analog chart. The study is the correlation function using a 10-period look comparing the two markets. There are times when the two market are positively correlated and times when the two markets are negatively correlated.
The CQG correlation function uses Pearson's correlation coefficient.
The Pearson correlation coefficient, often denoted as r, measures and quantifies the strength and direction of a linear relationship between two variables. The output ranges from +1 to -1, where:
- Values near +1 indicate a perfect positive linear correlation. If one variable increases, the other increases proportionally.
- Values near 0 indicate no linear correlation.
- Values near -1 indicate a perfect negative linear correlation. If one variable increases, the other decreases proportionally.
The correlation does not denote cause and effect. Also, the statistical measure is for variables that are normally distributed (on a graph the distribution of data appears as a bell curve). Market prices are not normally distributed. Market price distributions have fat tails and are often skewed.
CQG (Correl) is a function and is found under the Functions list in Help.
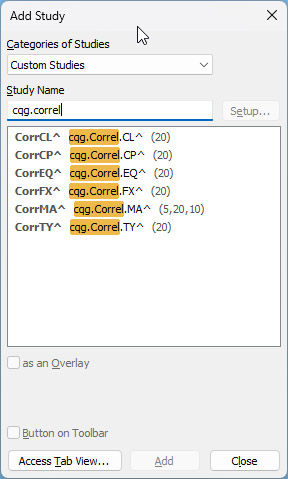
There are six custom studies that use the Correl Function.
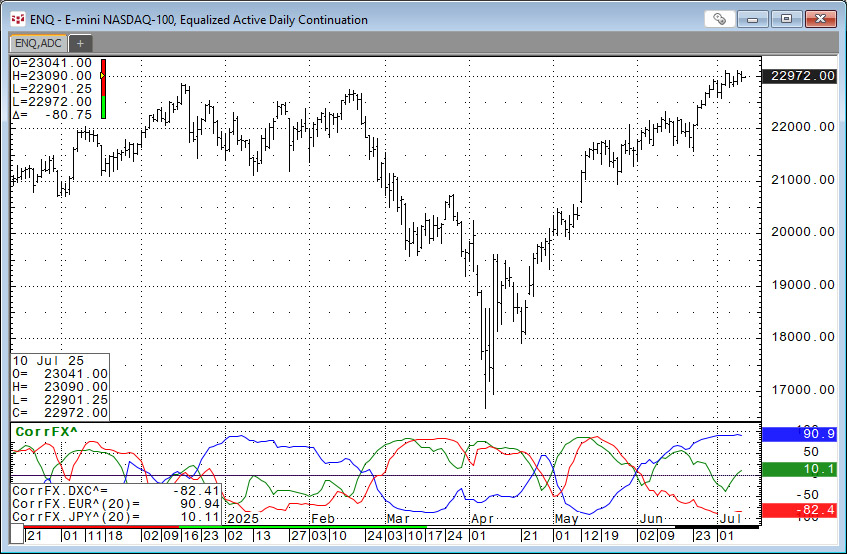
The CorrFX^ custom study produces three curves: DXC, EUR, and JPY.
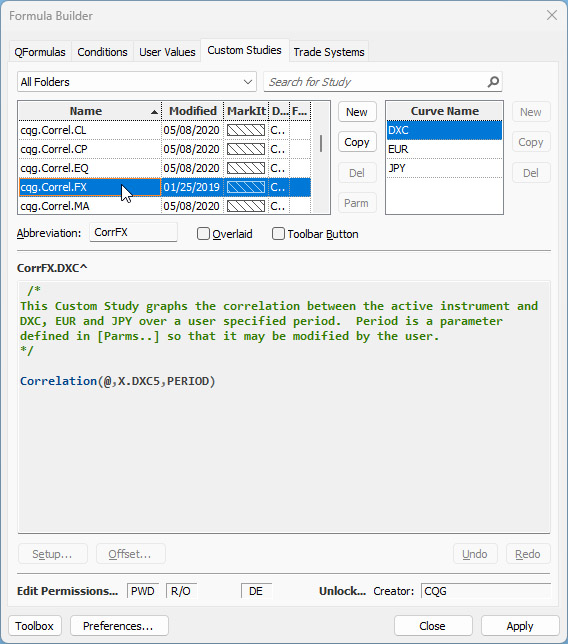
This display below is when applied to a chart. The "@" sign in the formula indicates the function is applied using the symbol for the chart and the symbol supplied in the function's formula. The "PERIOD" is a parameter.
Defining a custom study involves entering the following:
- A Study Name
- A Study Name Abbreviation (if desired)
- Study Curve Names (instead of the c1, c2, c3, and so forth, default names)
- Study Curve Formulas
Here are the steps:
- Click the New button in the Study Names group on the Custom Studies tab in Formula Builder.
- Enter a study name. The system automatically enters an abbreviation, but you can Enter a study abbreviation, if you want to.
- Click on the New Study Abbrev and Curve Name box and enter no more than 7 characters. The custom study abbreviation must start with a letter rather than a number or symbol. CQG uses the abbreviation name when you use one custom study as the basis for another custom study.
- Click the OK button.
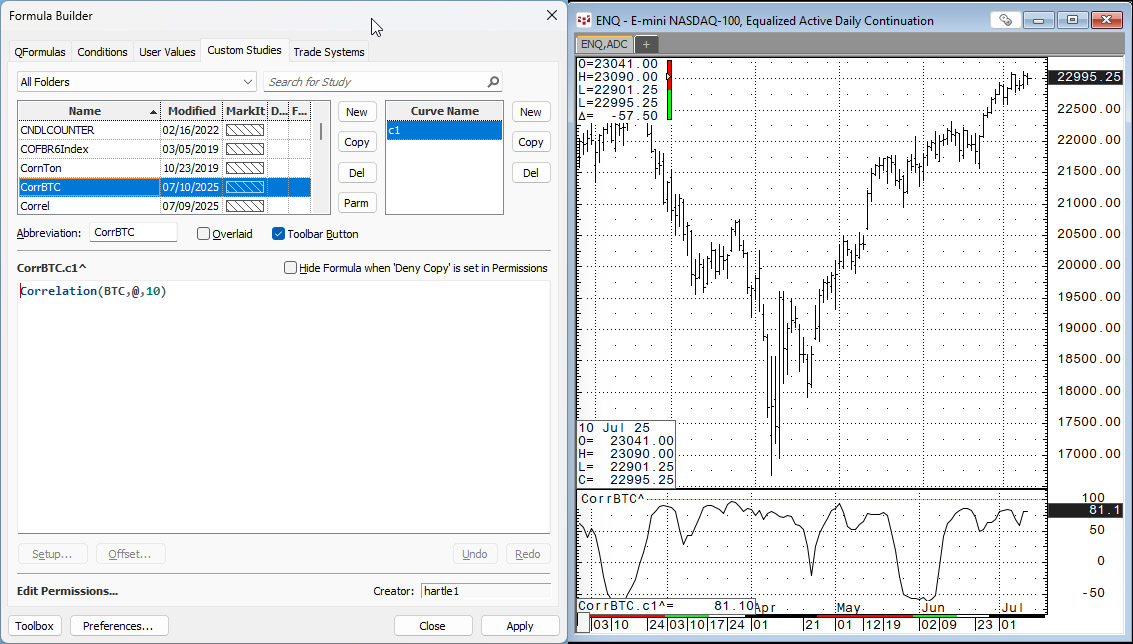
Below, a Correlation custom study using Bitcoin (Symbol: BTC) is added to a chart of the E-mini NASDAQ 100 contract.
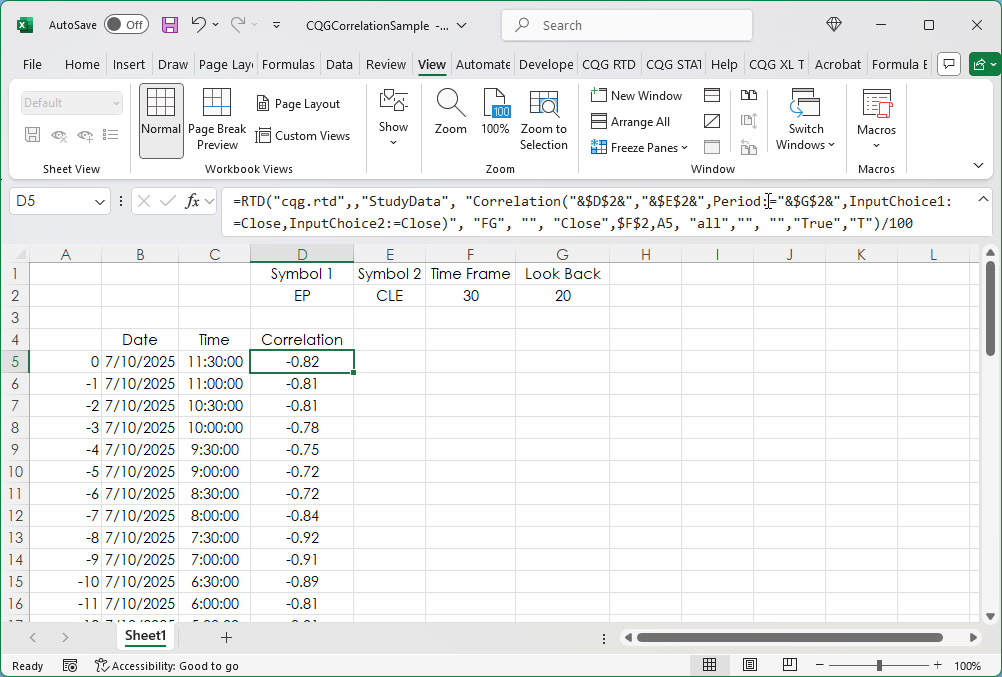
The Correlation function is available as an RTD Excel formula.
=RTD("cqg.rtd",,"StudyData", "Correlation(CLE,EP,Period:=20,InputChoice1:=Close,InputChoice2:=Close)", "Bar", "", "Close",30,"0", "all","", "","True","T")/100- First Symbol: CLE
- Second Symbol: EP
- Lookback Period: 20
- Input Choice1: Close
- Input Choice 2: Close
- Chart Type: Bar
- Time Frame: 30
- Bar Lookback: 0 (the current bar)
A sample spreadsheet is available at the bottom of the post.
There are numerous posts on Workspaces using correlation analysis as the basis for the Excel dashboards and one PAC for a CQG IC/QTrader page.
- Correlation-by-Dates Dashboard
- Correlation Dashboard with City Theme
- Correlation Matrix and Market Monitor
- Correlation Matrix Scattergram
- CQG Seasonality and Correlation Page
- Dynamically Ranked Correlations Market Dashboard
- Excel 365 BYCOL and by BYROW Functions and a Correlation Matrix
- Quadrant Correlation Dashboard
- SPDR Correlations Dashboard
And one for analysis of correlation relationships.
Requires CQG Integrated Client or CQG QTrader, and Excel 365 or more recent.