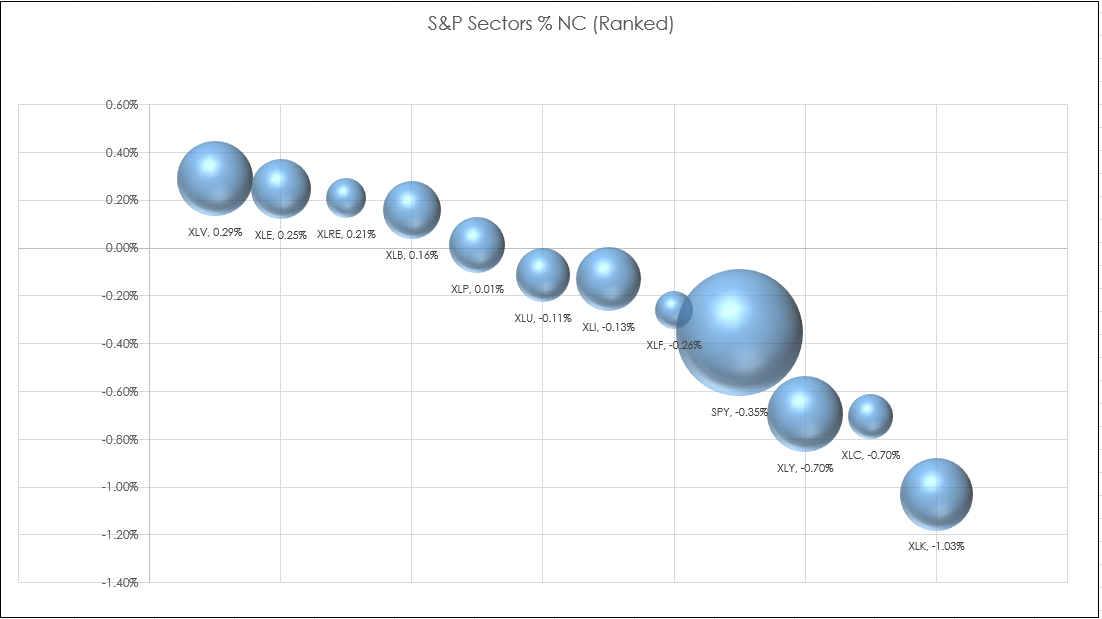
The Microsoft® Excel 3-D chart is different from the Excel Scatter Plot chart. The Scatter chart uses a fixed size for the chart data points. The 3-D chart accesses an additional column to set the… more
Workspaces
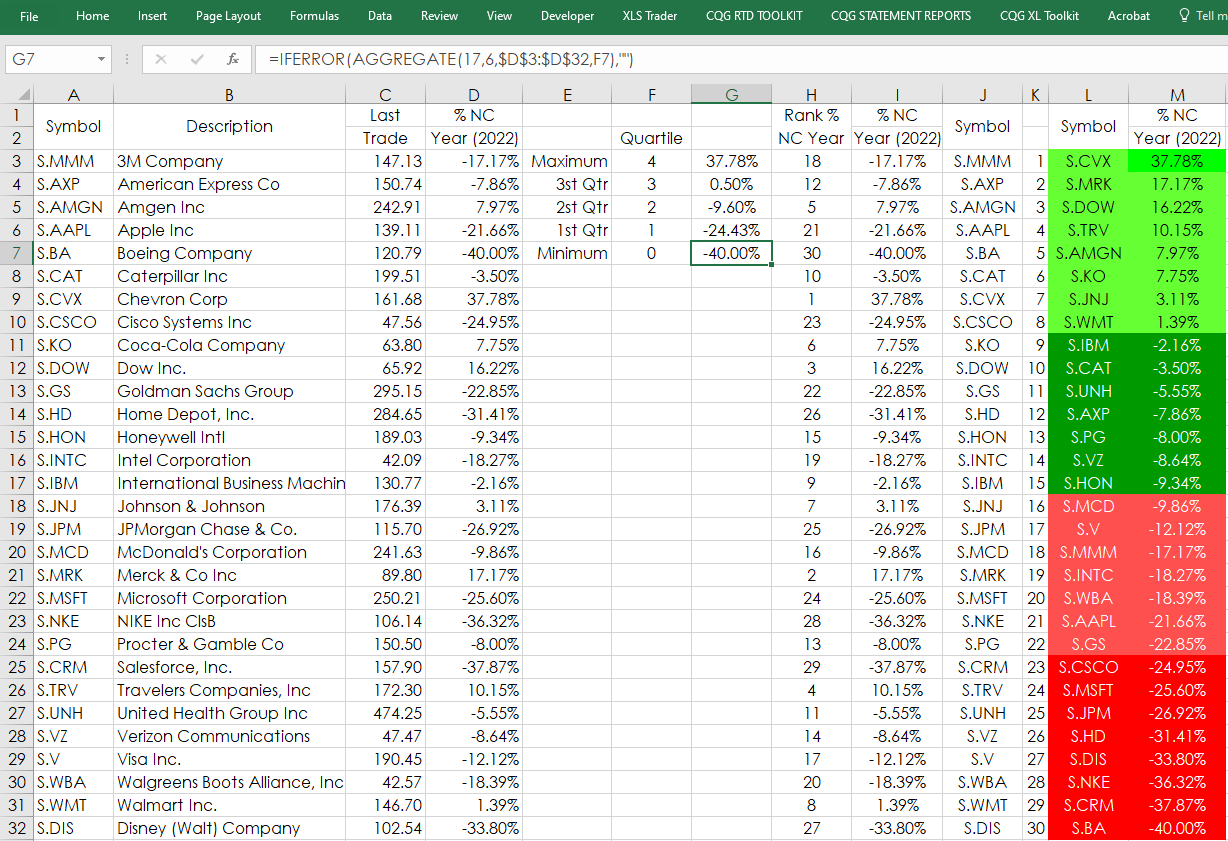
The Excel AGGREGATE function returns an aggregate calculation such as AVERAGE, COUNT, COUNTA, MAX, MIN, PRODUCT, etc., applied to a list of data while optionally ignoring hidden rows and errors.… more
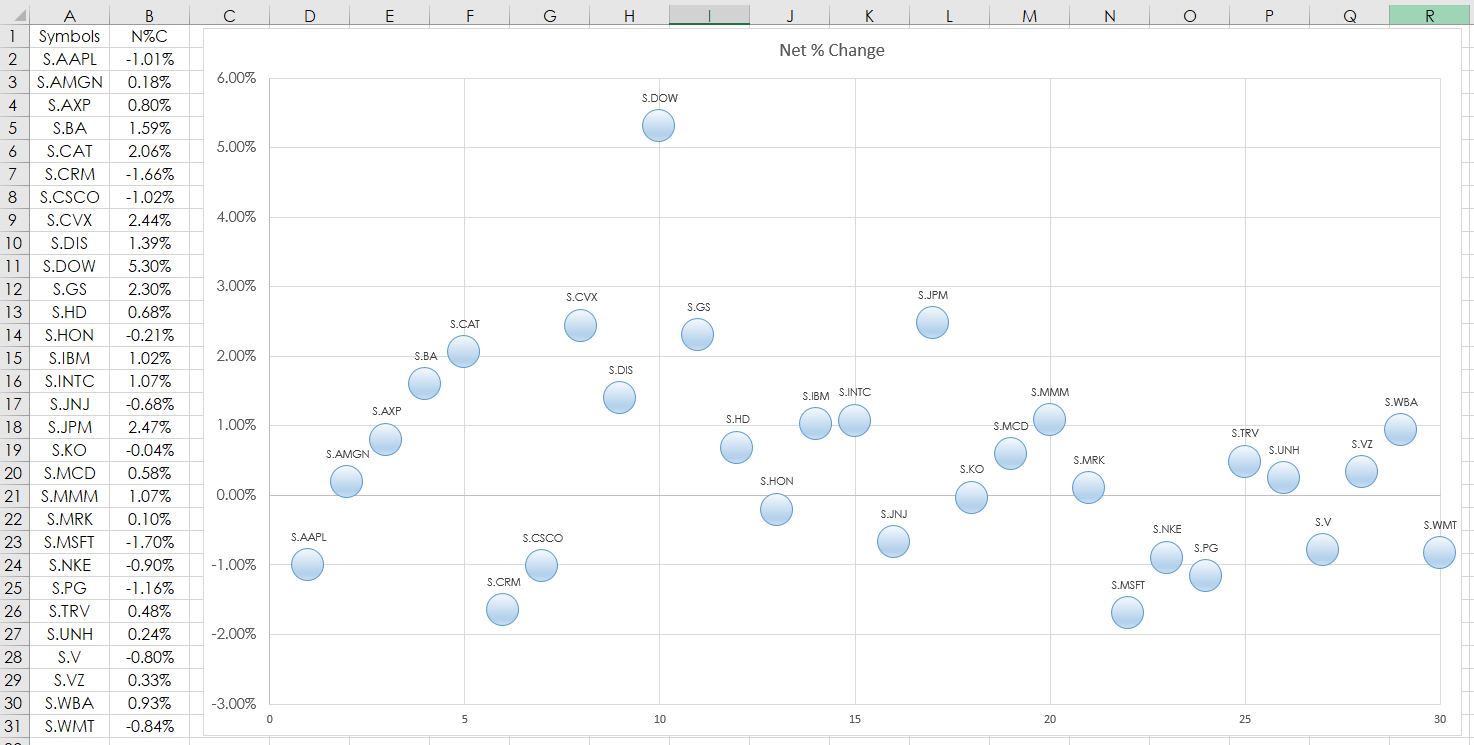
This post details using the Microsoft® Excel “Scatter Plot” Chart to track market performance. In this example, RTD formulas are used to pull in the percent net change of the 30 stocks that are in… more
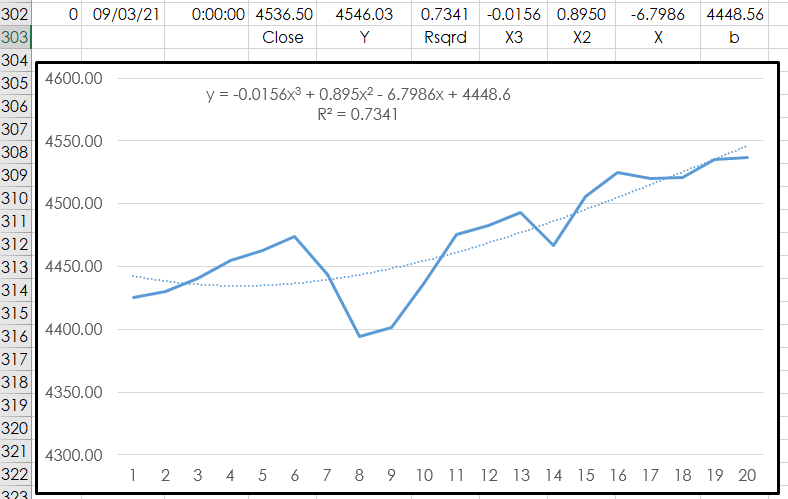
This article walks you through using Microsoft® Excel’s LINEST function to determine the three coefficients and y-intercept of a 3rd order polynomial function over the past 20 bars of closing… more
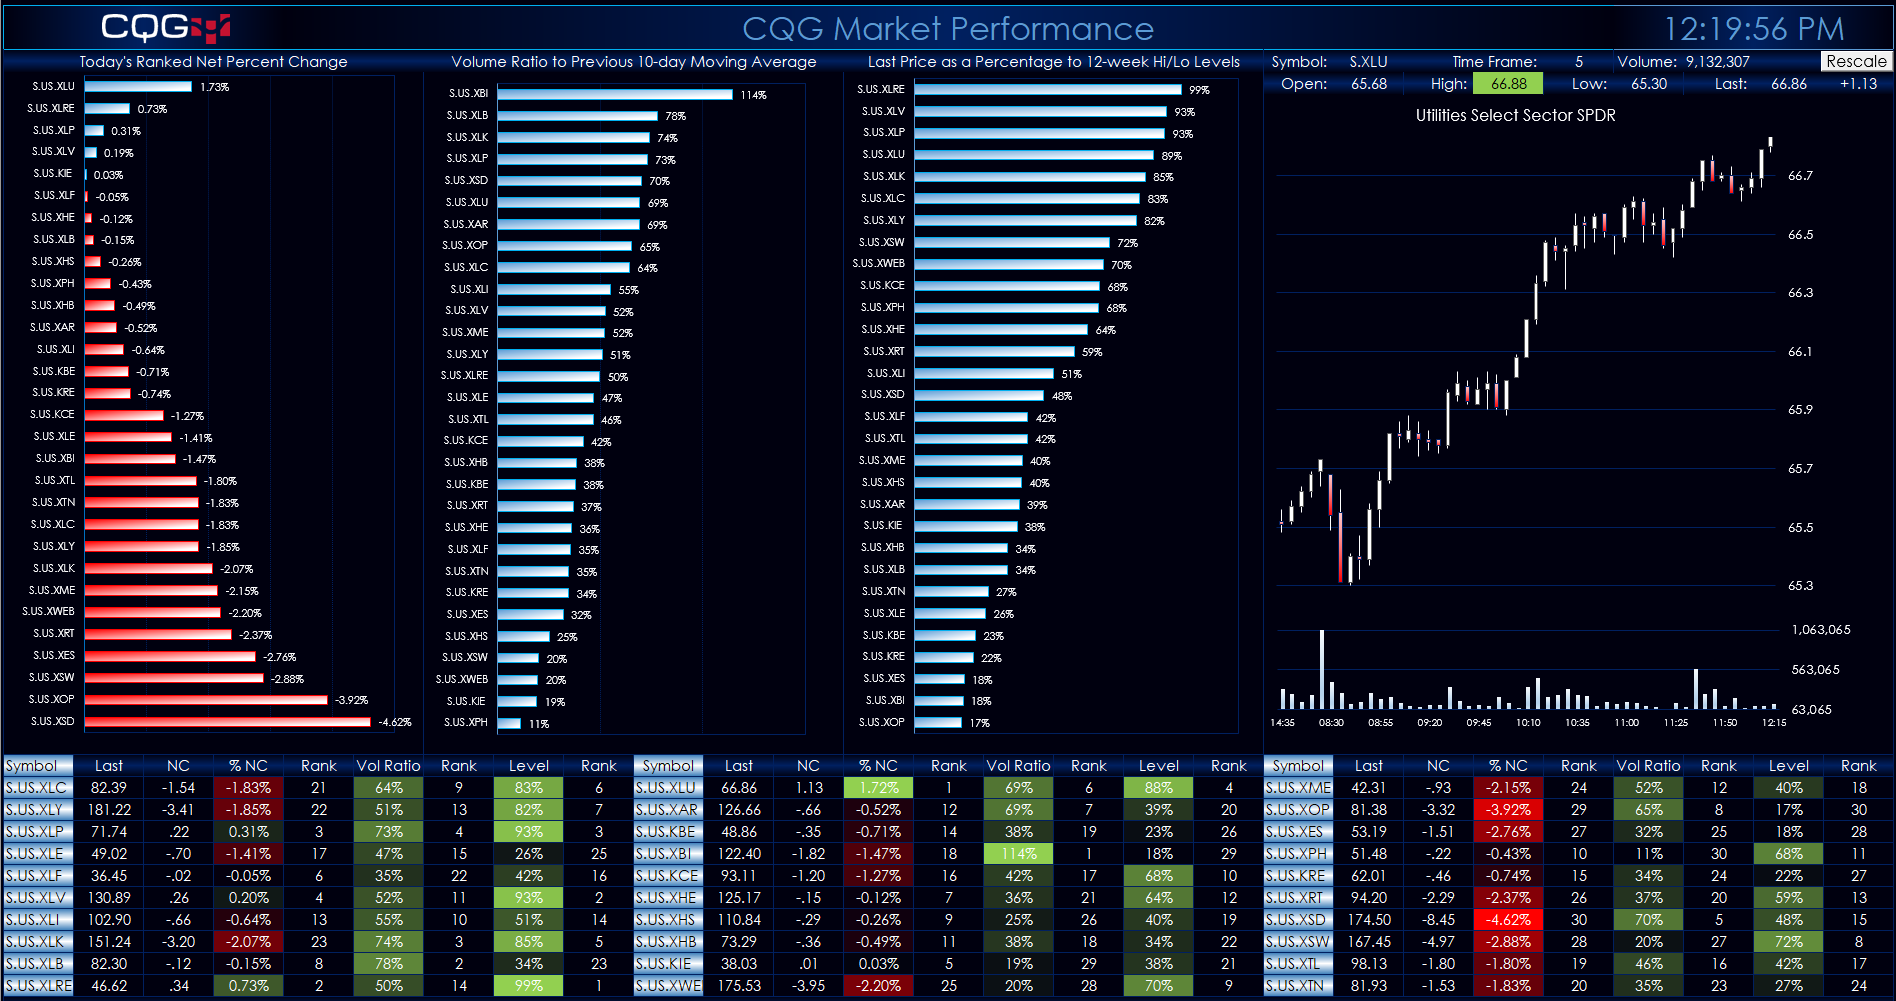
This Microsoft® Excel Dashboard comes frontloaded with 30 Sector and Industry symbols. However, you can enter in whatever symbols you like using the Symbols tab. The long description of the symbol… more
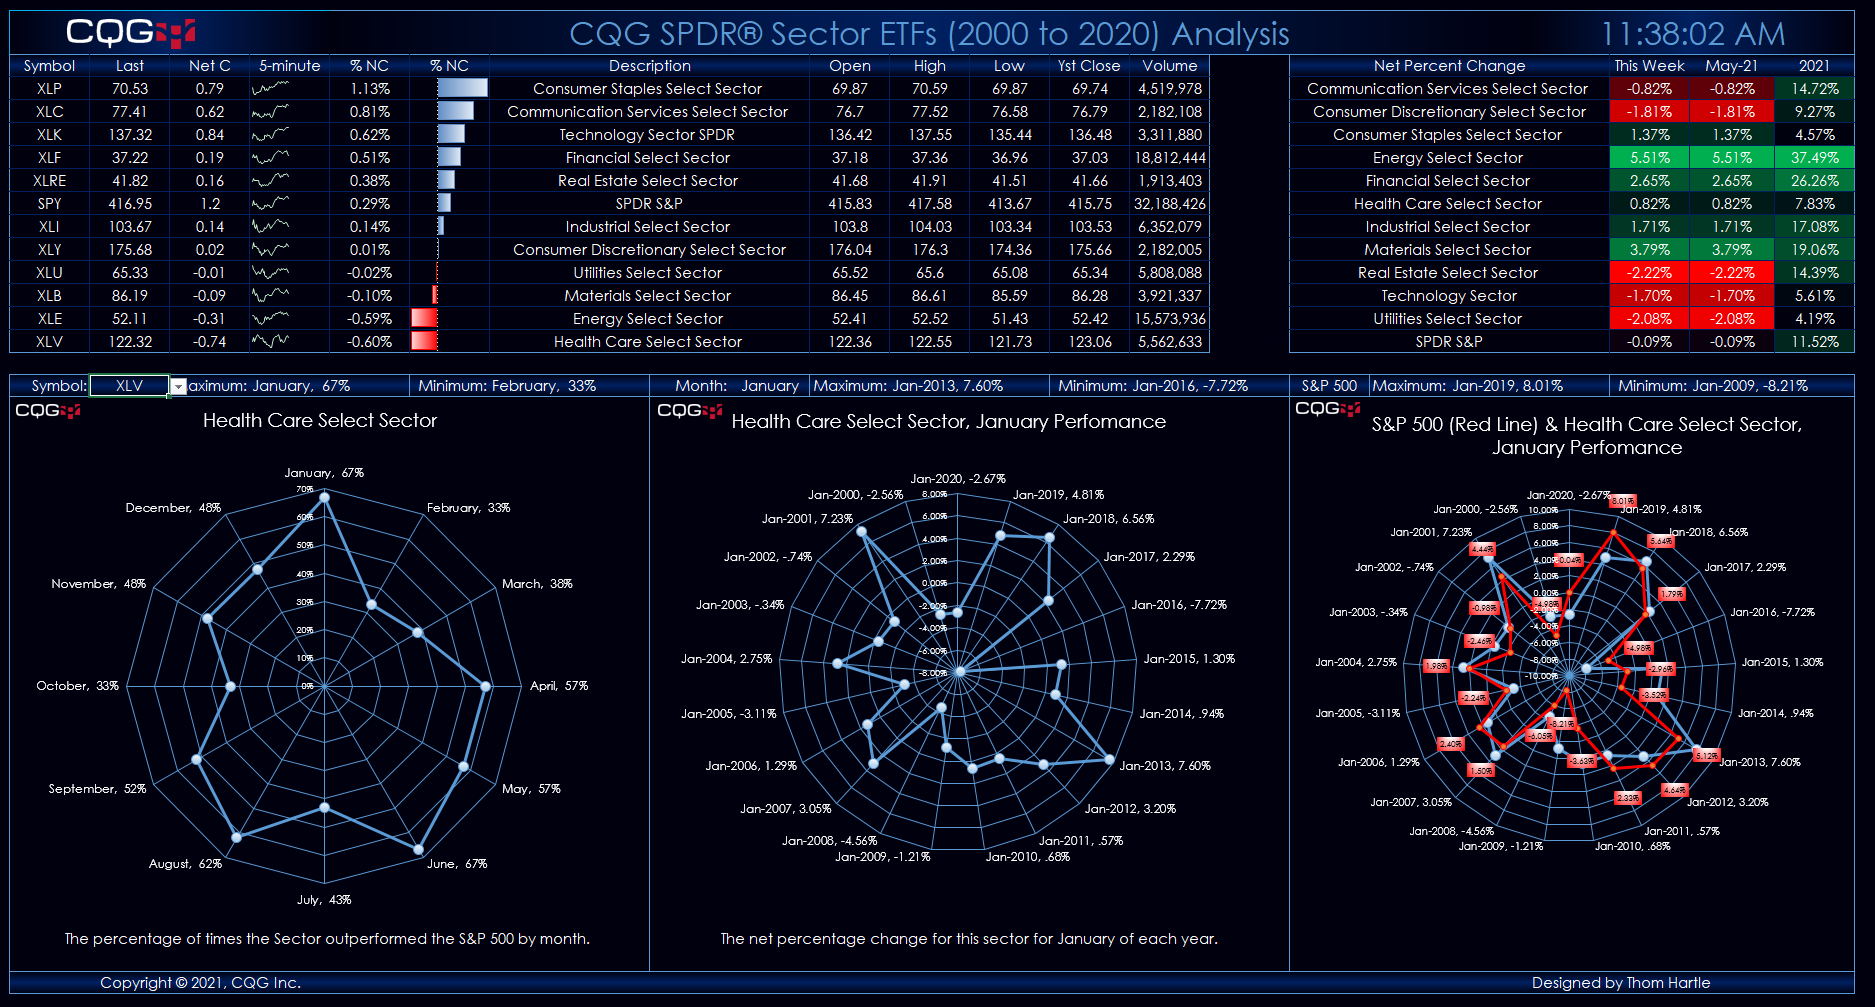
SPDR® Sector ETFs Analysis Dashboard This Microsoft® Excel dashboard provides analysis of S&P Sectors based on ETFs. The collection of ETFs are:
Symbol Description XLC Communication… more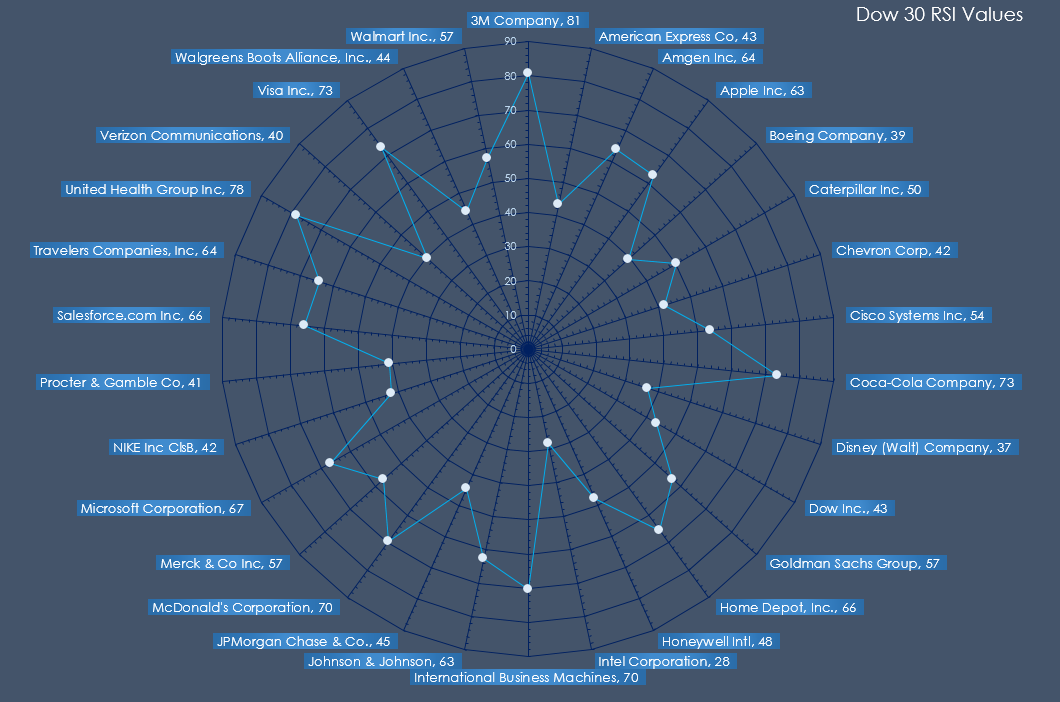
Microsoft® Excel offers the Radar Chart. This chart does not use the typical X-axis versus Y-axis. Instead, the radar chart is a graphic display of multivariate data in the form of a two-… more
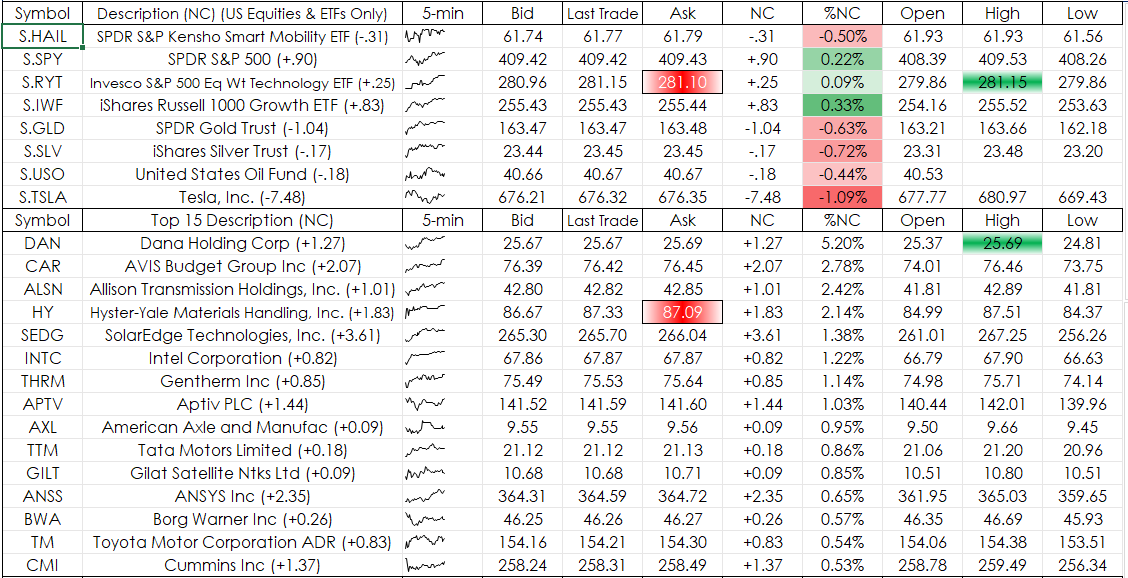
Sparklines have been available beginning with Microsoft® Excel 2010. A Sparkline is a simple chart that is displayed within a cell or a group of merged cells. Sparklines are a nice addition to a… more
In this article, we outline how to pull historical market data into Excel while excluding data from days when the market was in a holiday session.
Holiday sessions are trading dates, but… more
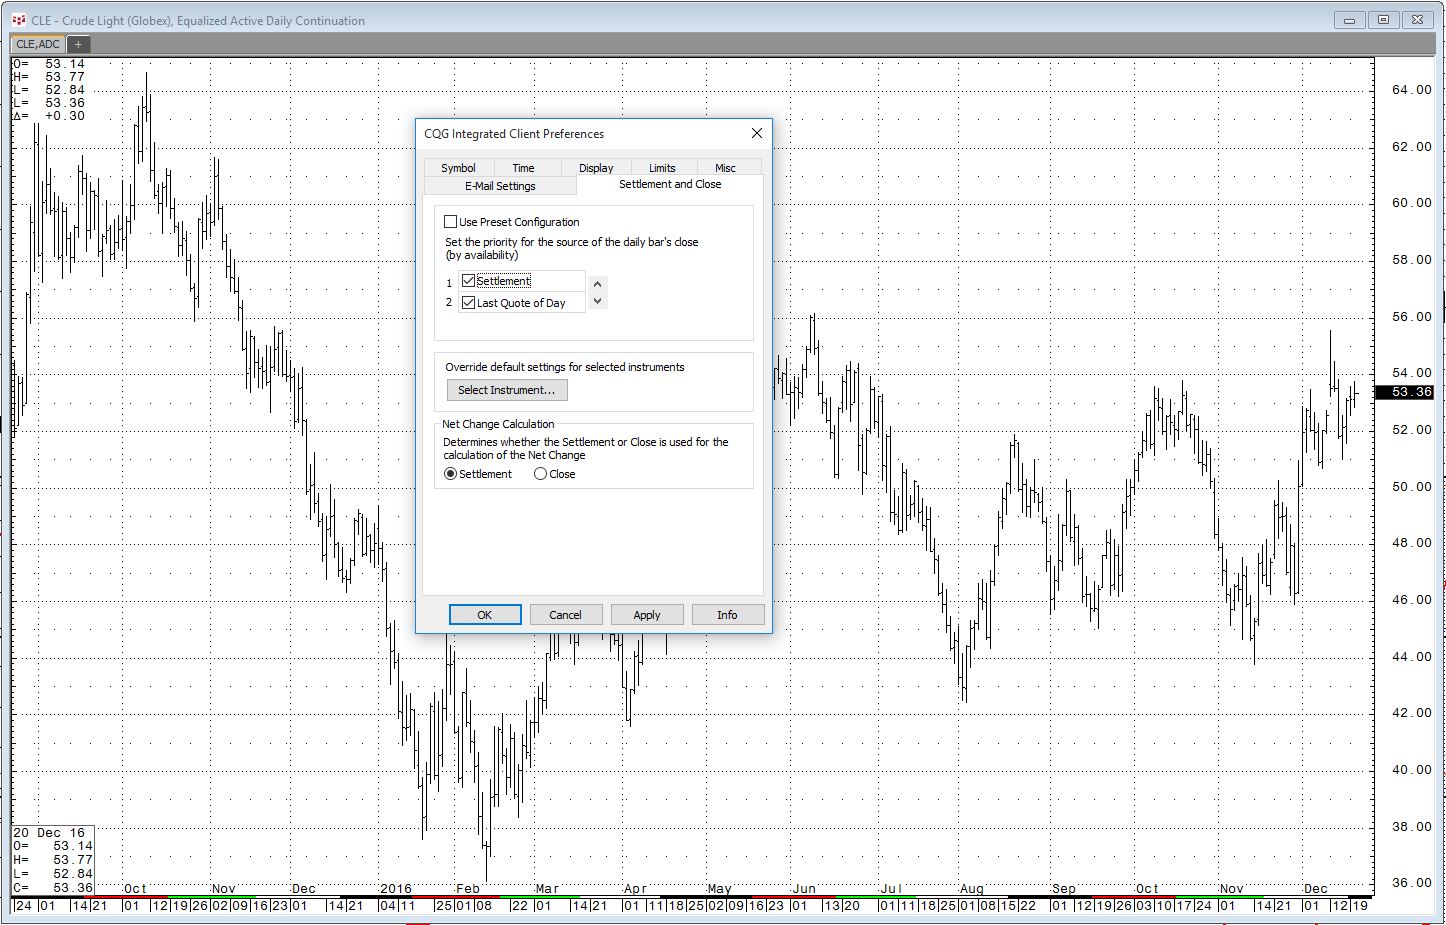
A common request is an RTD formula to pull historical settlement prices for a particular market. There is a “Contract Data” RTD formula for settlement:
=RTD("CQG.RTD", ,"ContractData", "CLE… more