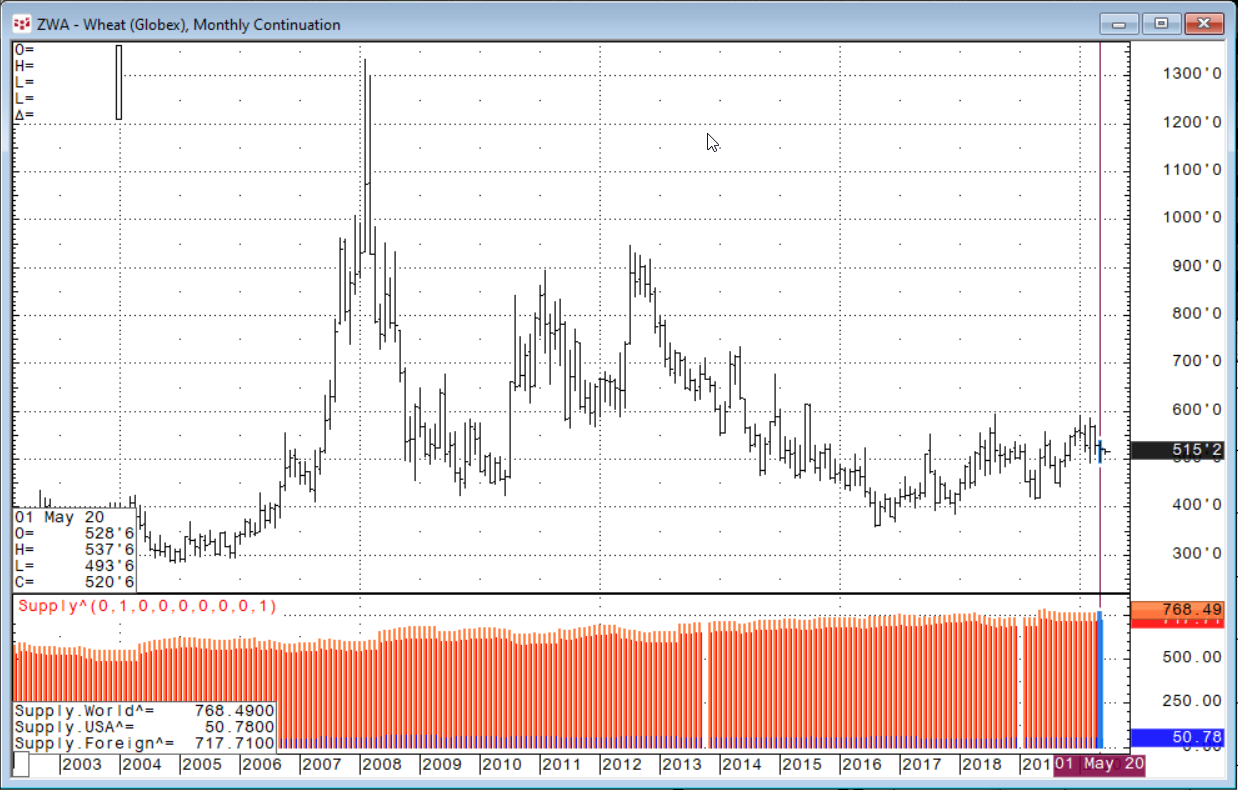
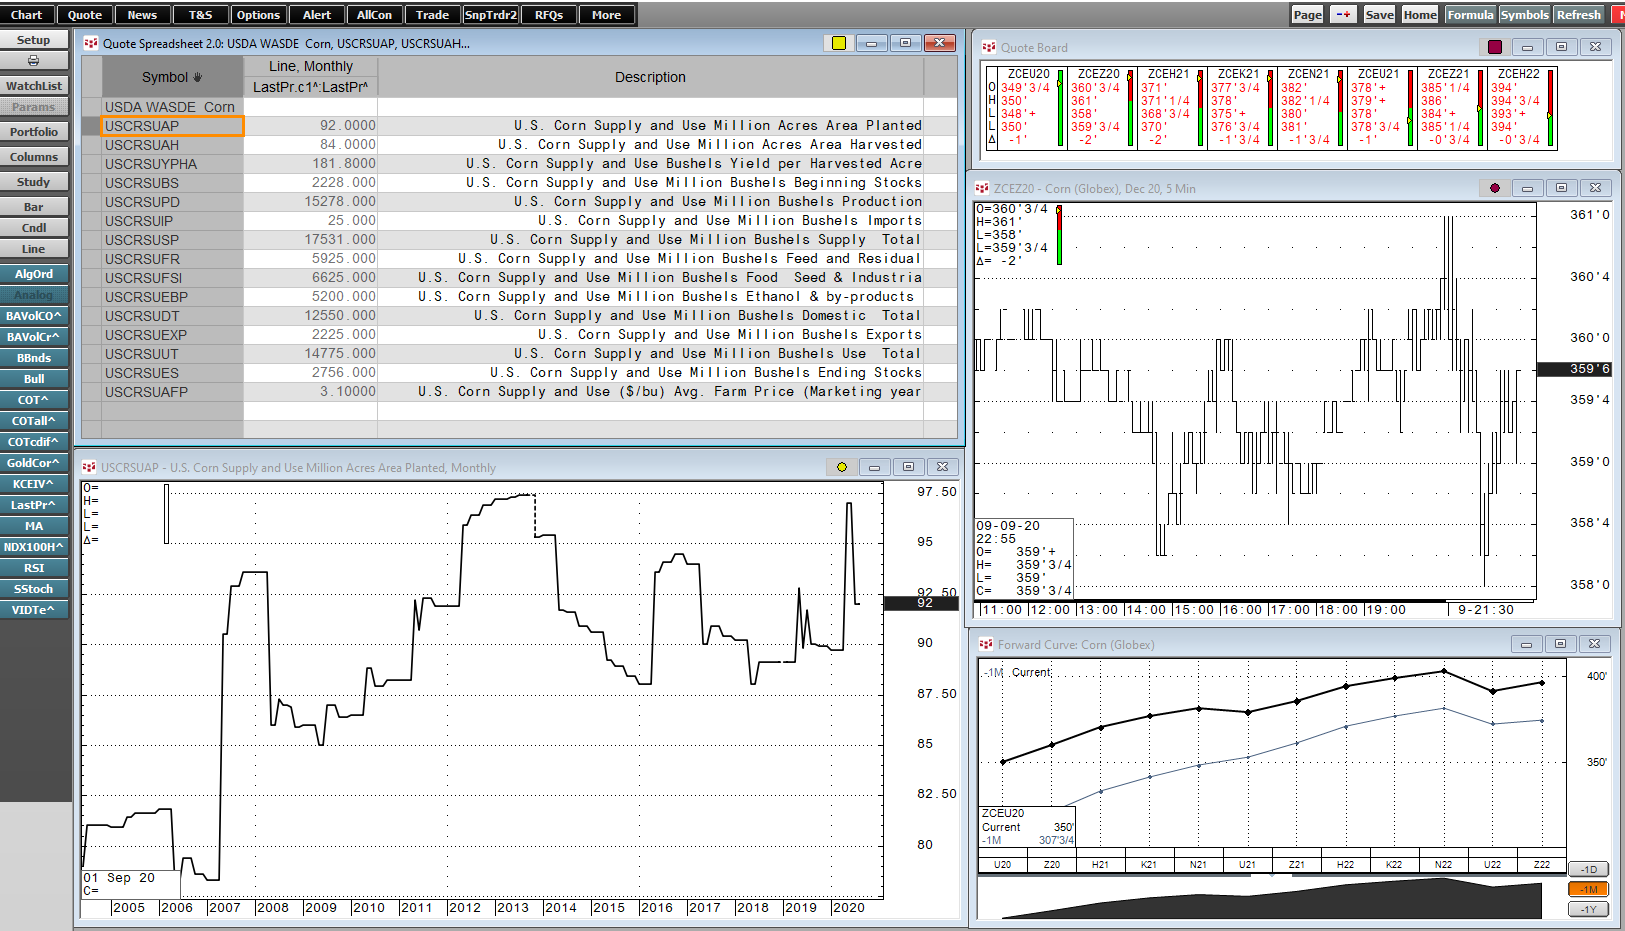
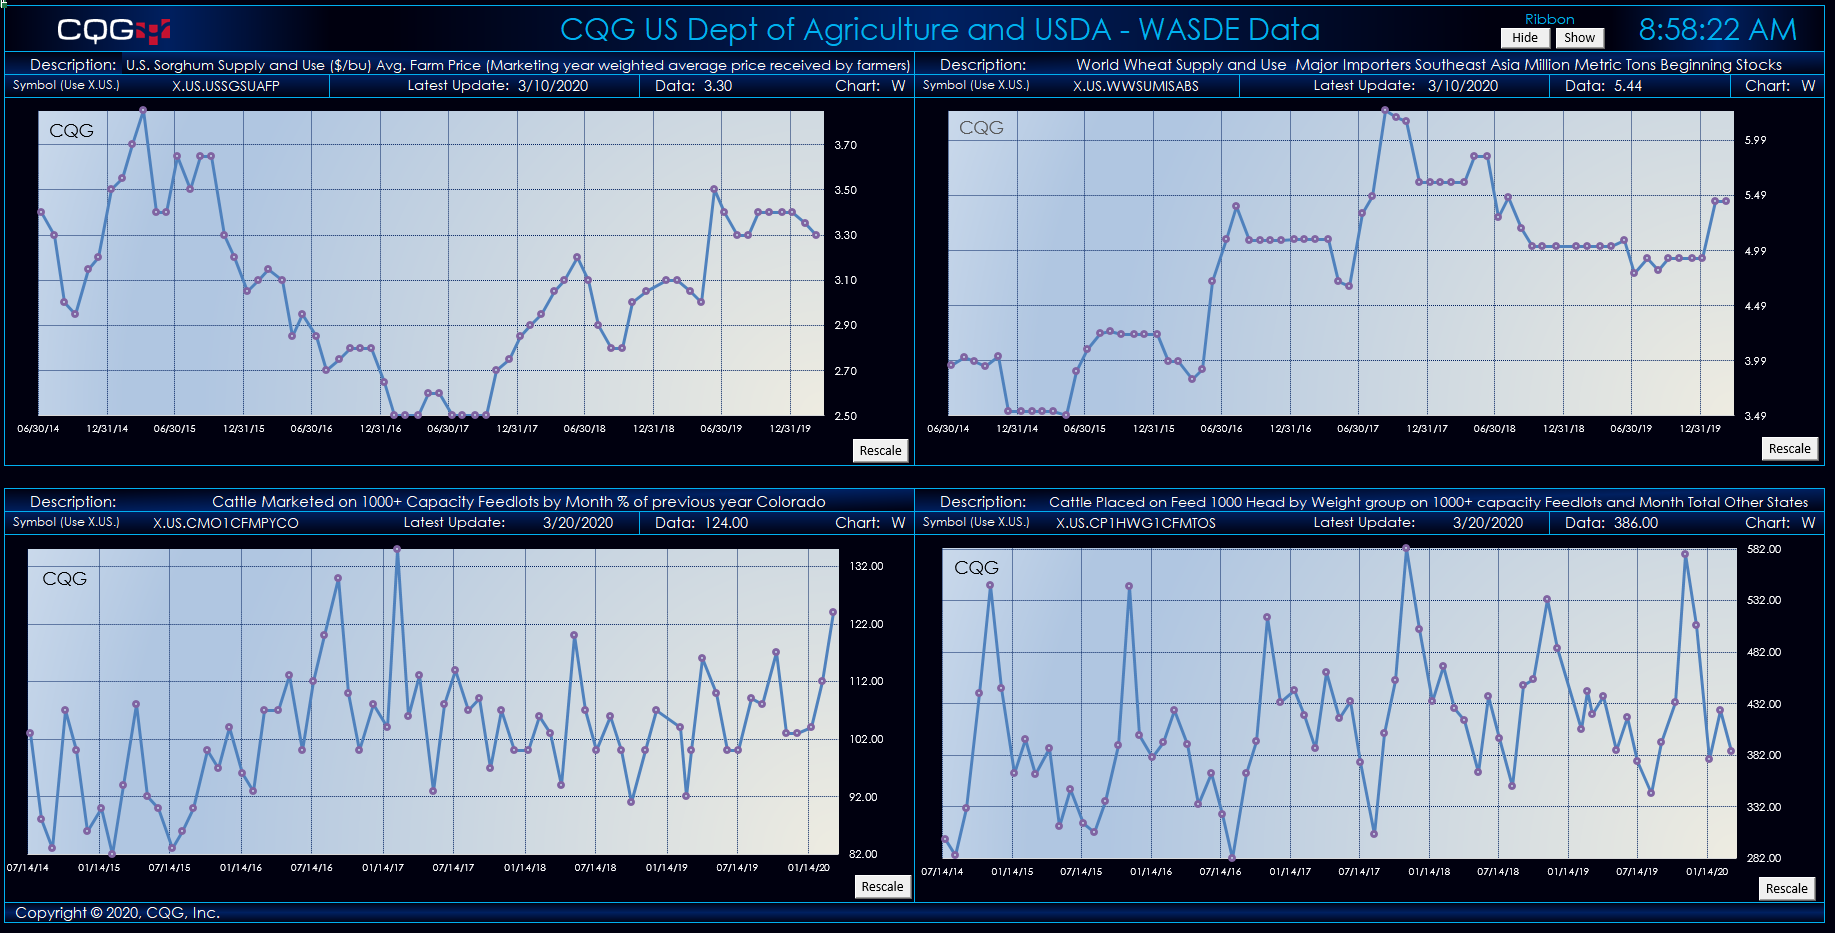
United States Department of Agriculture-World Agriculture Supply and Demand Estimates reports are a critical component to gaining insight into both the international and domestic demand and supply… more
Workspaces
The CQG XL Toolkit Add-In for Microsoft Excel® pulls today's market data, orders data and open positions data into Excel via the Internet. Historical data is not available. CQG products do not… more
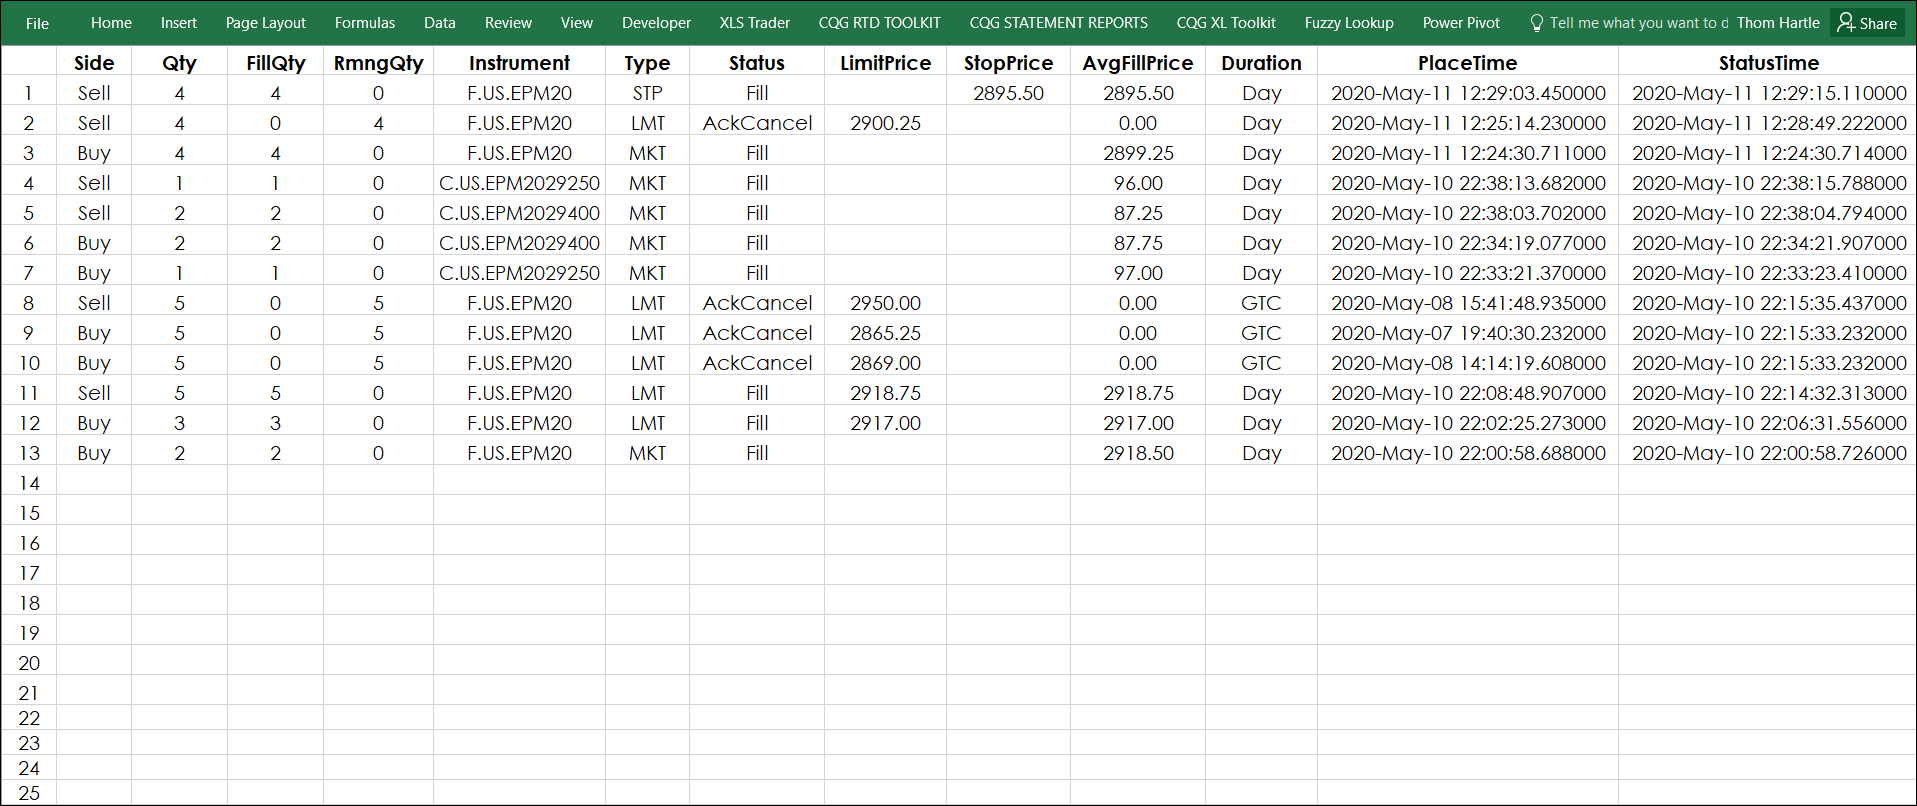
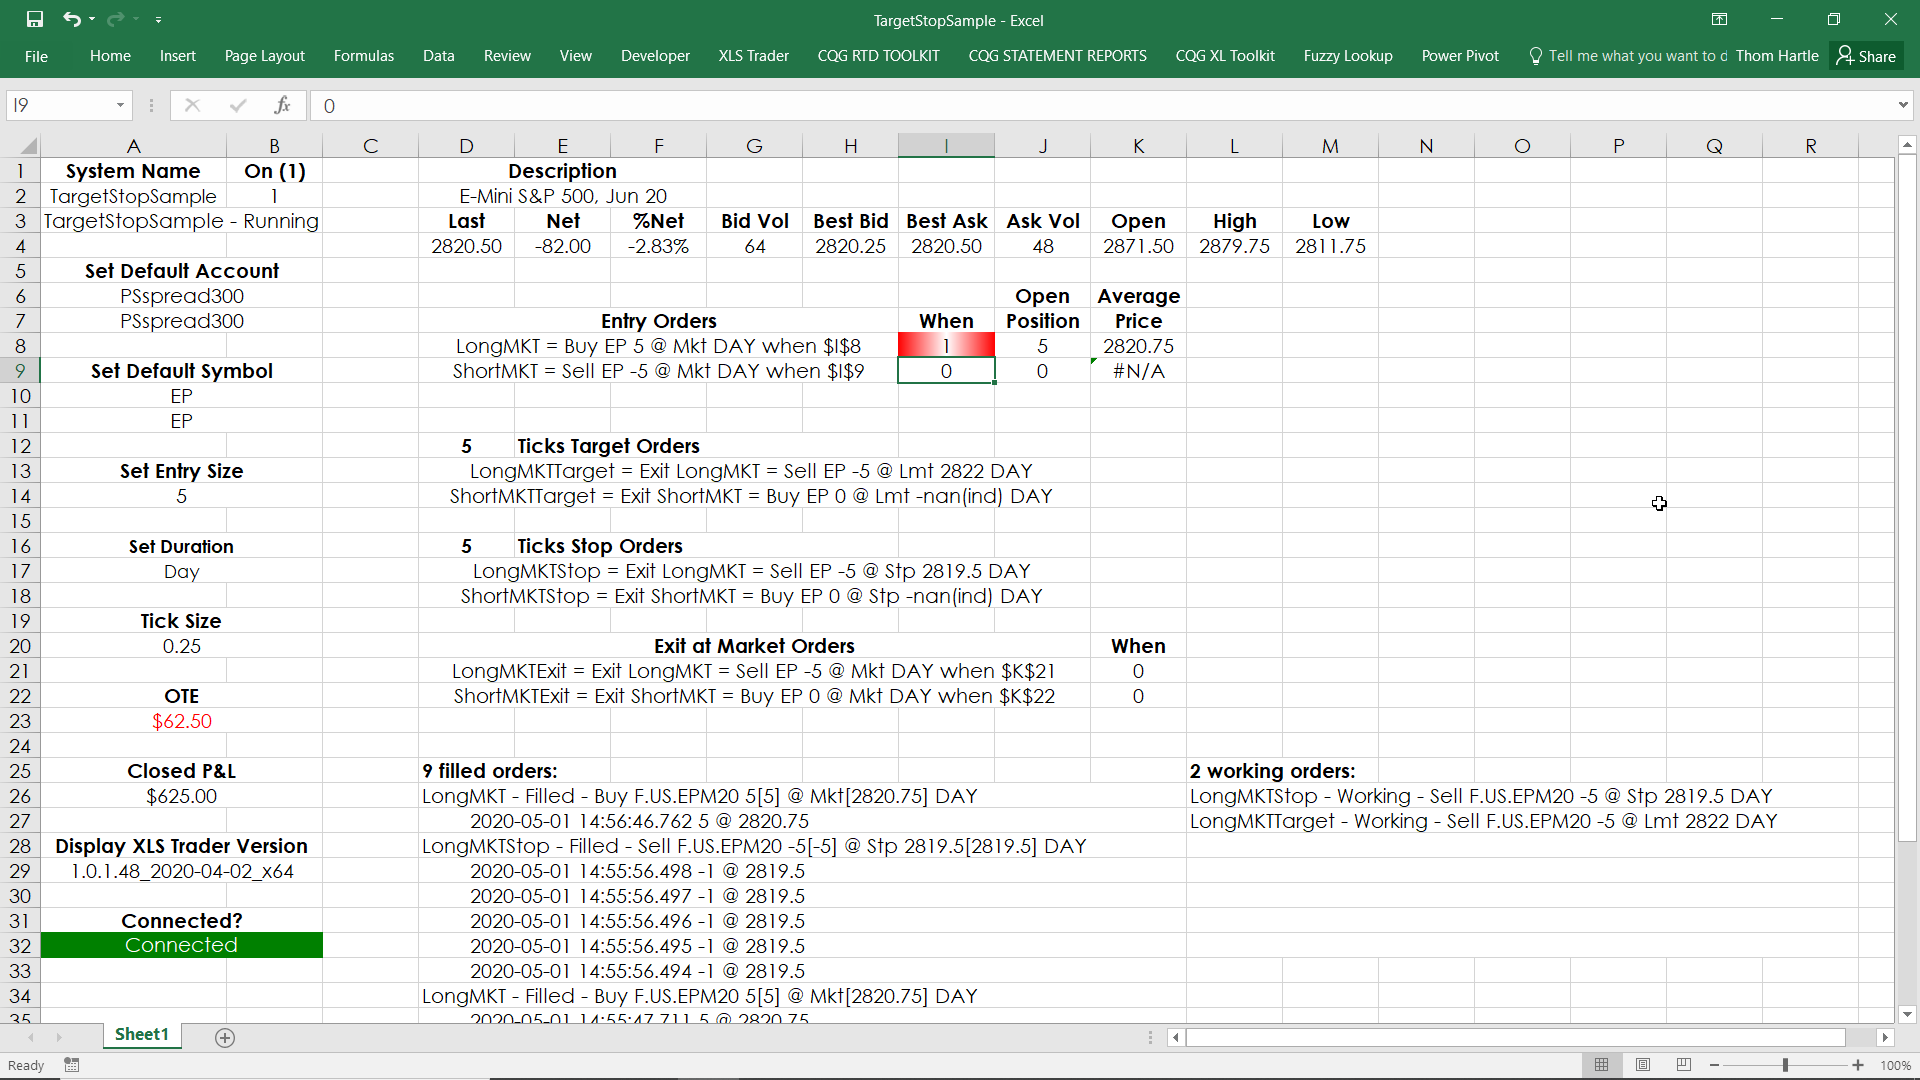
This sample XLS Trader worksheet uses market orders to enter into positions. When filled, XLS Trader will automatically enter in a target and a stop order, which are OCO orders (one cancels the… more
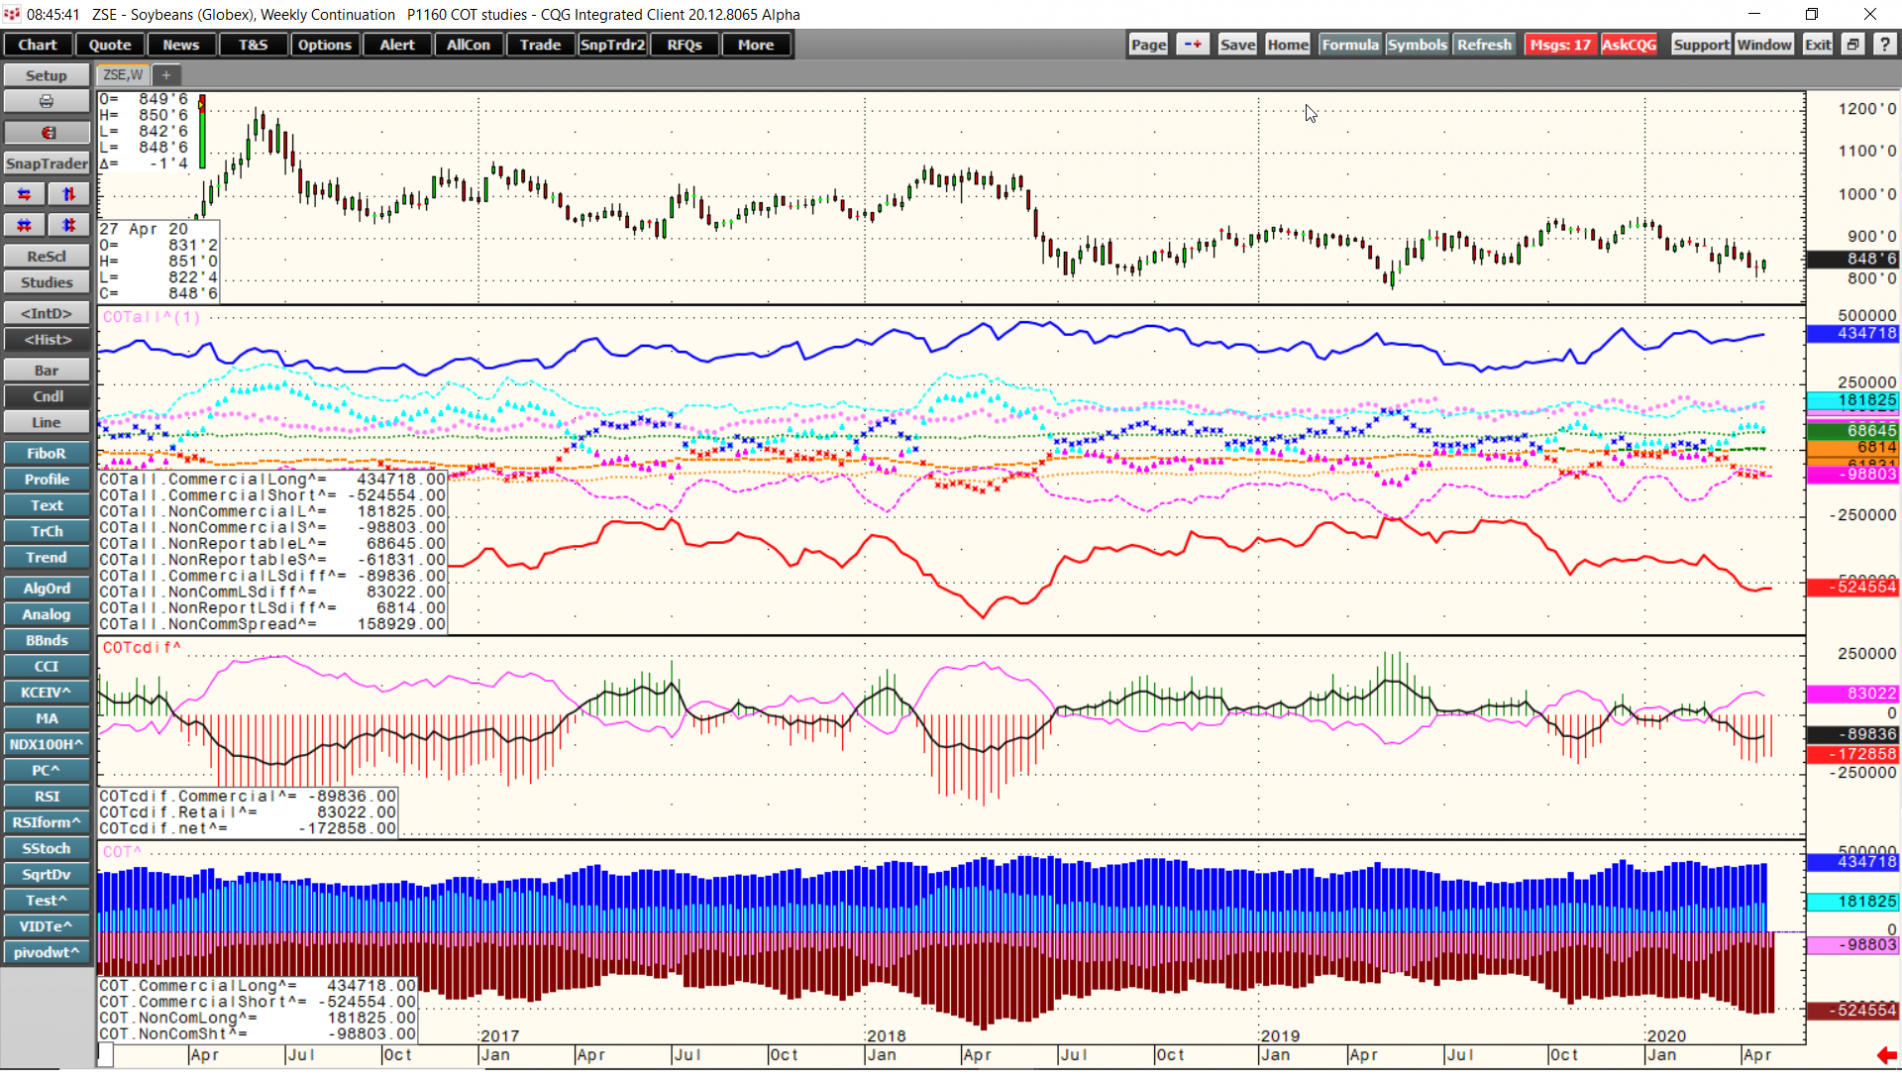
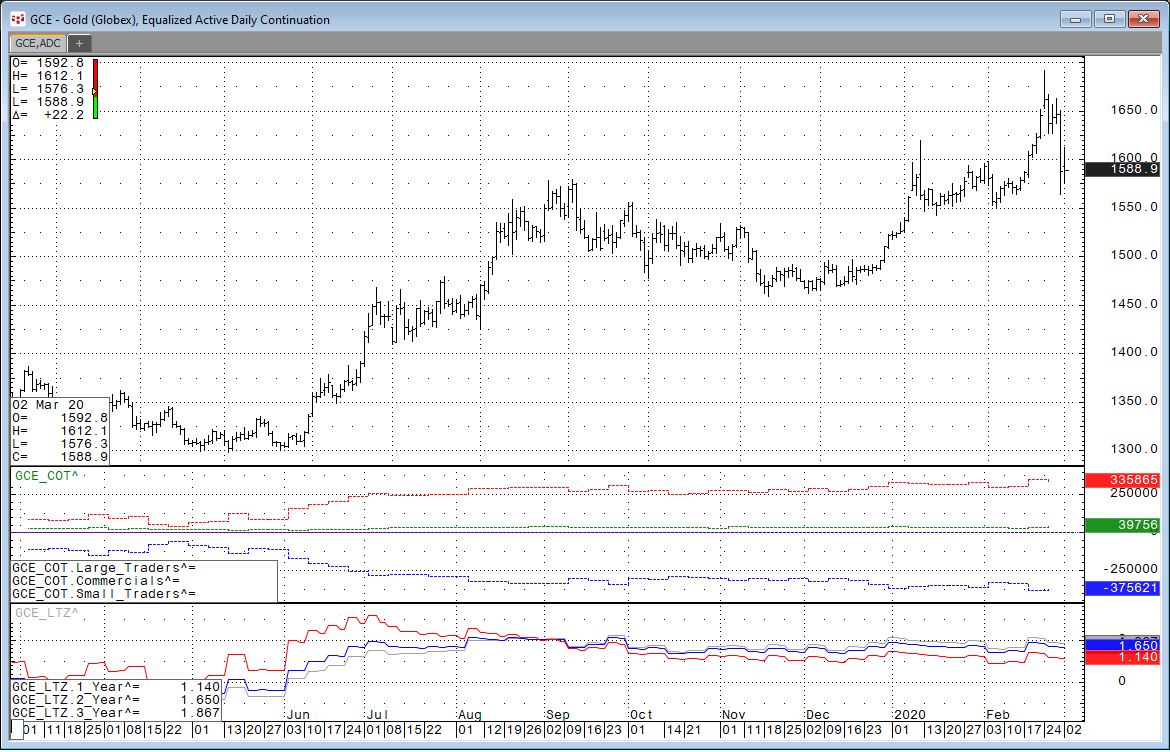
CQG Product Specialist Jim Stavros has created a downloadable CQG PAC that has three new CFTC COT Studies designed to aid in analysis of the COT reports: COTAll, COTcDiff and COT.
COTAll… more
XLS Trader offers CQG Integrated Client customers the ability to route and manage orders directly from Microsoft Excel®. Now, you can create models within Excel that can be the basis for… more
CQG has added the World Agricultural Supply and Demand Estimates (WASDE) data to the data feed. Published monthly by the United States Department of Agriculture (USDA), the World Agricultural… more
CQG has added United States Department of Agriculture (USDA) data and the World Agricultural Supply and Demand Estimates (WASDE) data to the data feed. Look for the data under the Exchanges list… more
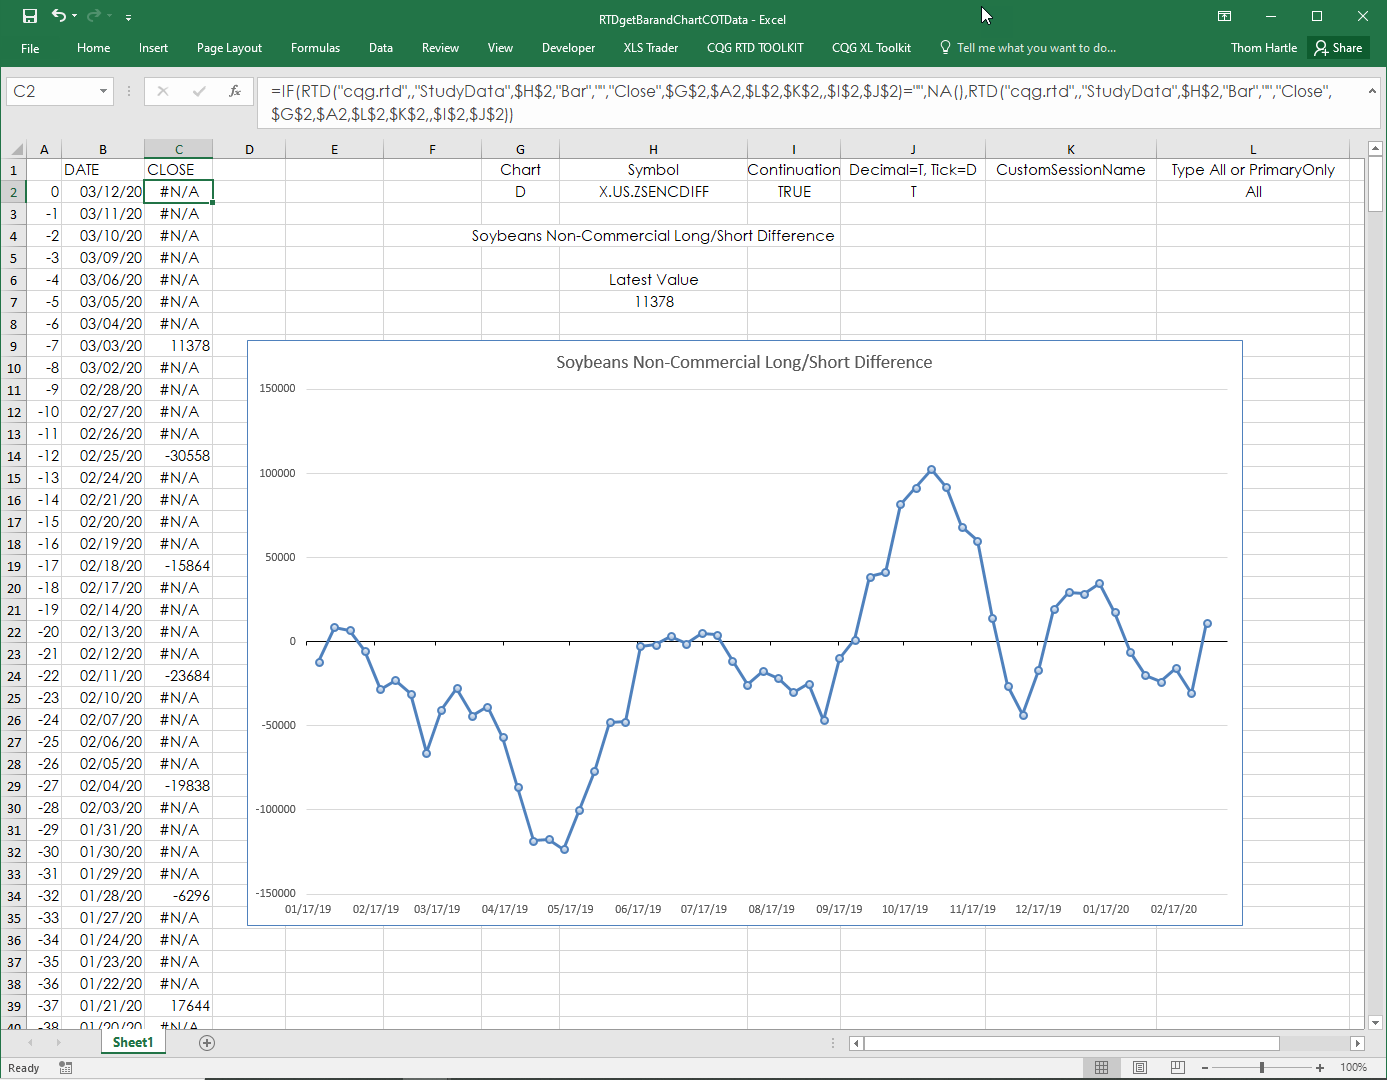
CQG has added the CFTC Commitment of Traders data to the data feed. You can read about working with COT symbols here.
If you are interested in pulling the latest COT updates and historical… more
CQG has added the CFTC Commitment of Traders reports to the data feed. Under Exchanges in the CQG Symbol Finder you can find “CFTC Commitment of Traders.”
An easy way to find the… more
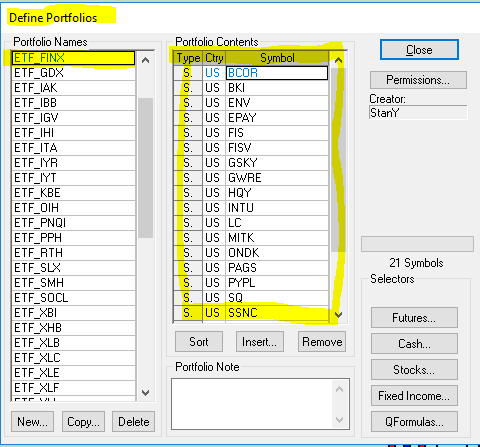
The pac files available below for download represent equity sectors. ;Each sector is composed of specific Exchange Traded Funds (ETF). Each EFT contains a portfolio of the individual equities that… more
