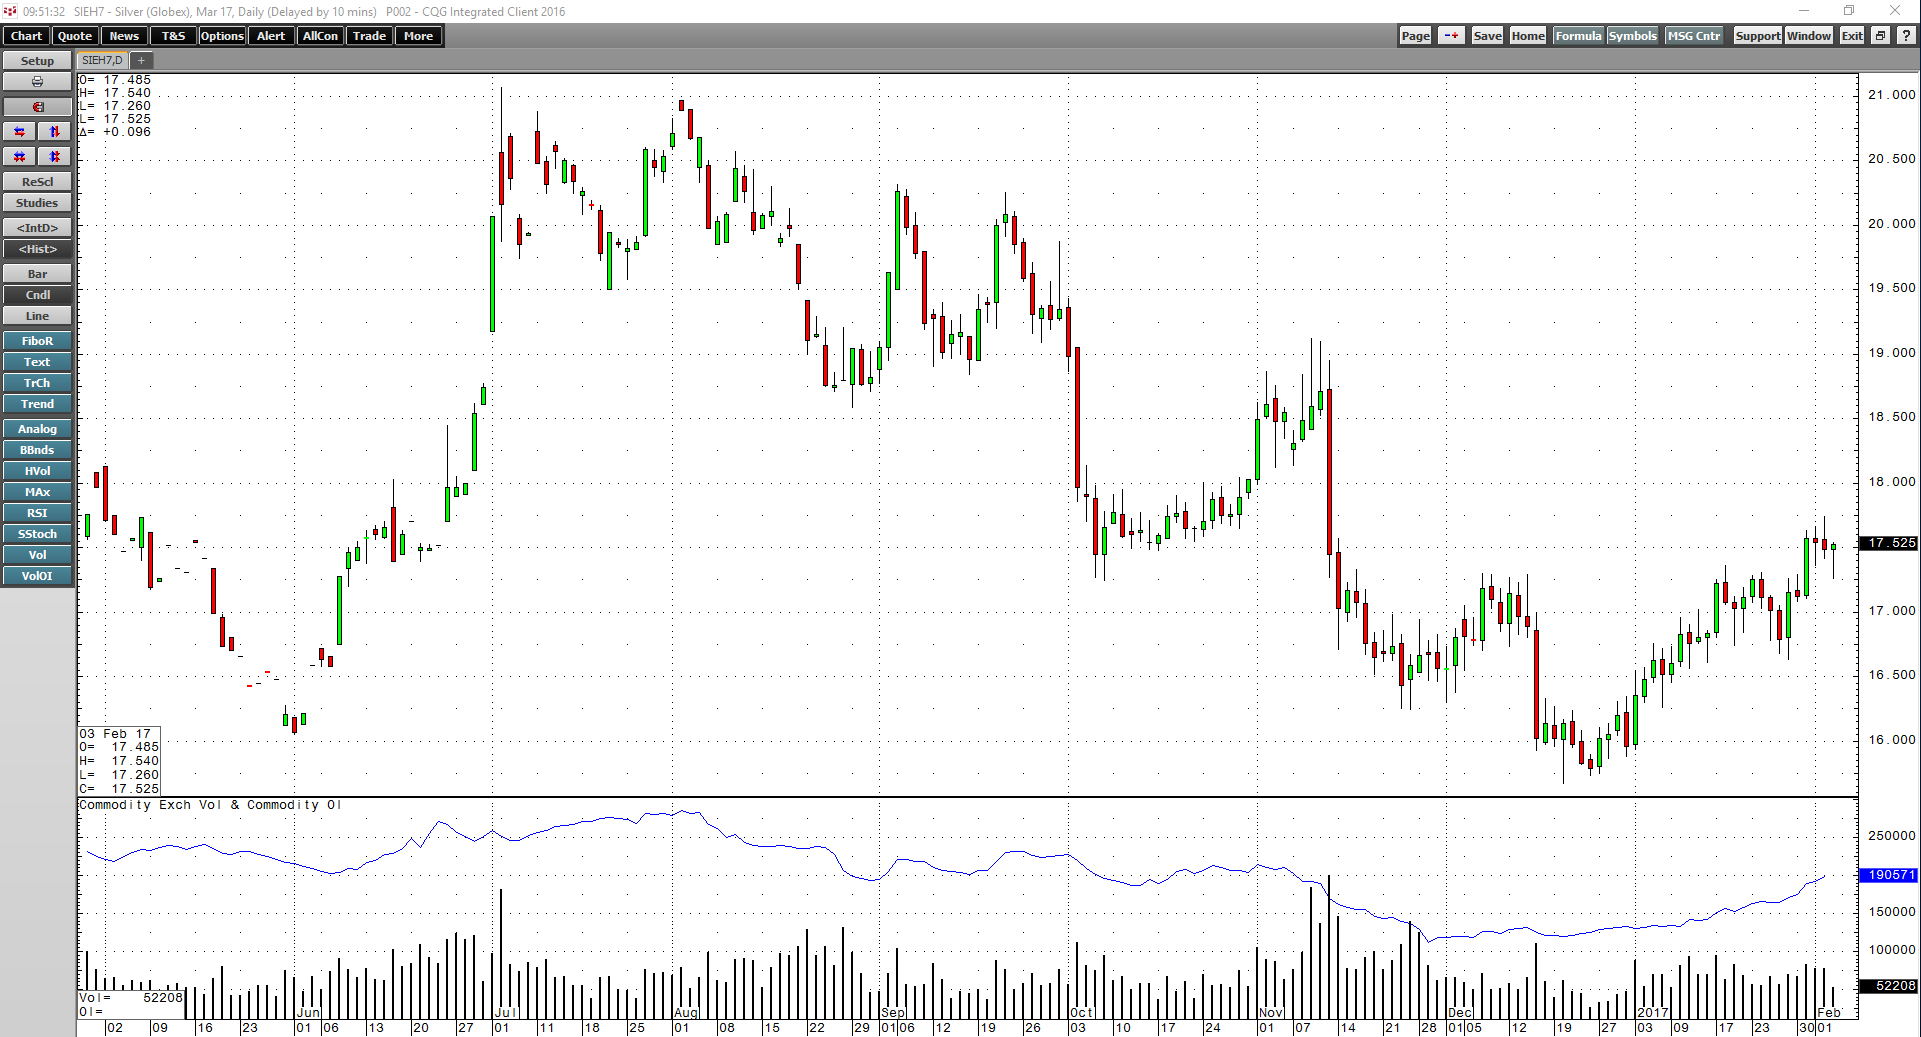
After Election Day in November, it looked like the rallies in gold and silver that took place over the course of 2016 were over and done. Nearby gold futures fell to lows of $1,123.90 and silver… more
Alli Brennan, CQG Director of Marketing and Product Management, recently authored an article for TabbFORUM titled Finnovation – The Hot Topic With Great Impact.
Brennan writes:
… more
This Microsoft Excel® dashboard displays market data for crude oil spreads traded on the ICE platform using a matrix-style format. The outrights are along the top row and the start of each… more
This Microsoft Excel® dashboard displays market data for crude oil spreads traded on the ICE platform using a matrix-style format. The outrights are along the top row and the start of each… more
This CQG M dashboard layout displays a portfolio of symbols from the Americas (available with a subscription to the CME Globex feed on CQG) in a heat-map style. Tapping on a quote pushes the… more
CQG formulas include a crossover feature, and CQG can determine the number of completed bars back since a signal occurred. For example, using “Barssince(EP xabove Ma(EP,Sim,20),1,300)” as the… more
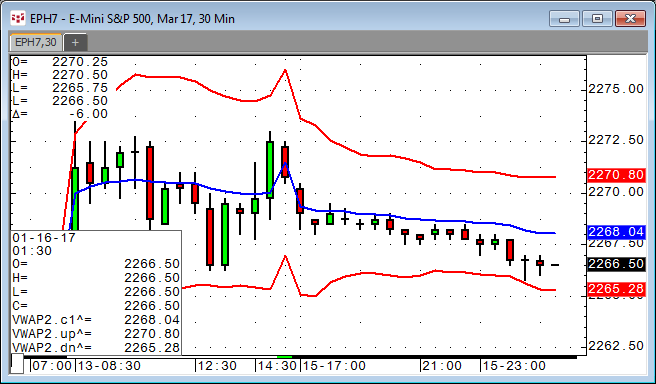
Here is a special version of the Volume-Weighted Average Price (VWAP) study including standard deviation bands.
VWAP is the volume-weighted average price for a futures contract… more
This Microsoft Excel® dashboard displays key market information for contracts traded on the CME Exchange and the Globex platform. The markets are grouped by these products:
Equity Indices… moreKase and Company, Inc. today announced a major update of its award-winning StatWare® indicators. These indicators are available in CQG Integrated Client through CQG’s Charting API.
The… more
In this webinar, Cynthia Kase unveils the latest version of Kase StatWare, which uses CQG’s Charting API. Watch the recording to learn how to strengthen your trading techniques and bring your… more


