
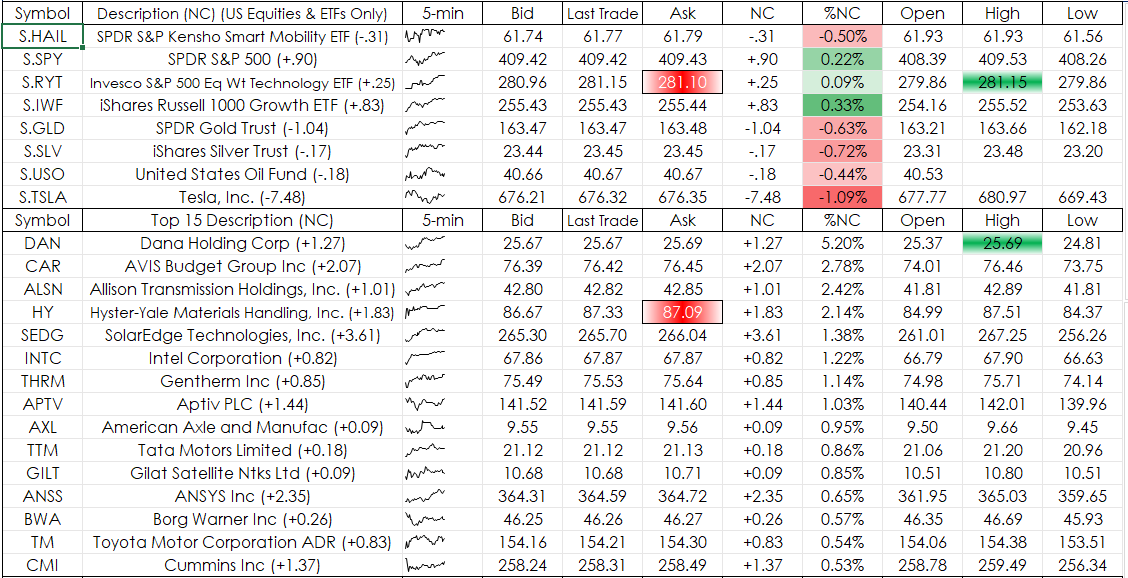
Sparklines have been available beginning with Microsoft® Excel 2010. A Sparkline is a simple chart that is displayed within a cell or a group of merged cells. Sparklines are a nice addition to a… more

Presented by Financial Repression Authority.
CQG Integrated Client
Get a 2-week free trial
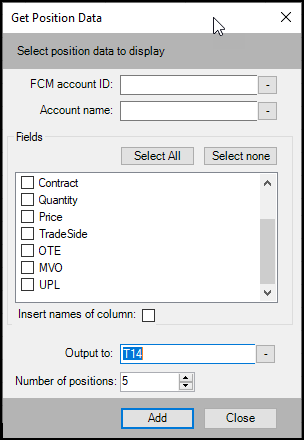
This updated Excel CQG RTD Toolkit Add-in is automatically installed with CQG IC 21-12-8042 Beta and higher. The updates are to the Orders and Positions tabs. New features and benefits include you… more

The AskCQG toolbar button has been updated.
Click the button and your browser will open to the CQG Support page and at the bottom right is a Zendesk chat window connecting you to… more
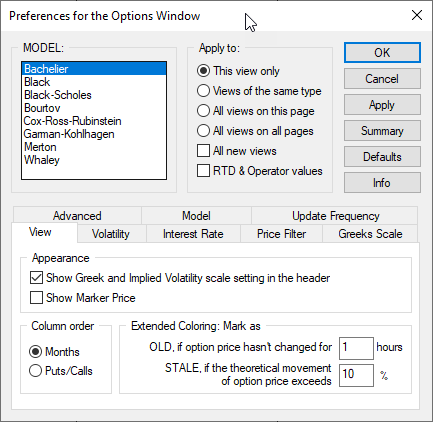
On April 21, 2020 the CME clearing house switched the options pricing and valuation model to Bachelier to accommodate negative prices in the underlying futures and allow for listing of option… more

The AskCQG toolbar button has been updated.
Click the button and your browser will open to the CQG Support page and at the bottom right is a Zendesk chat window connecting you to… more
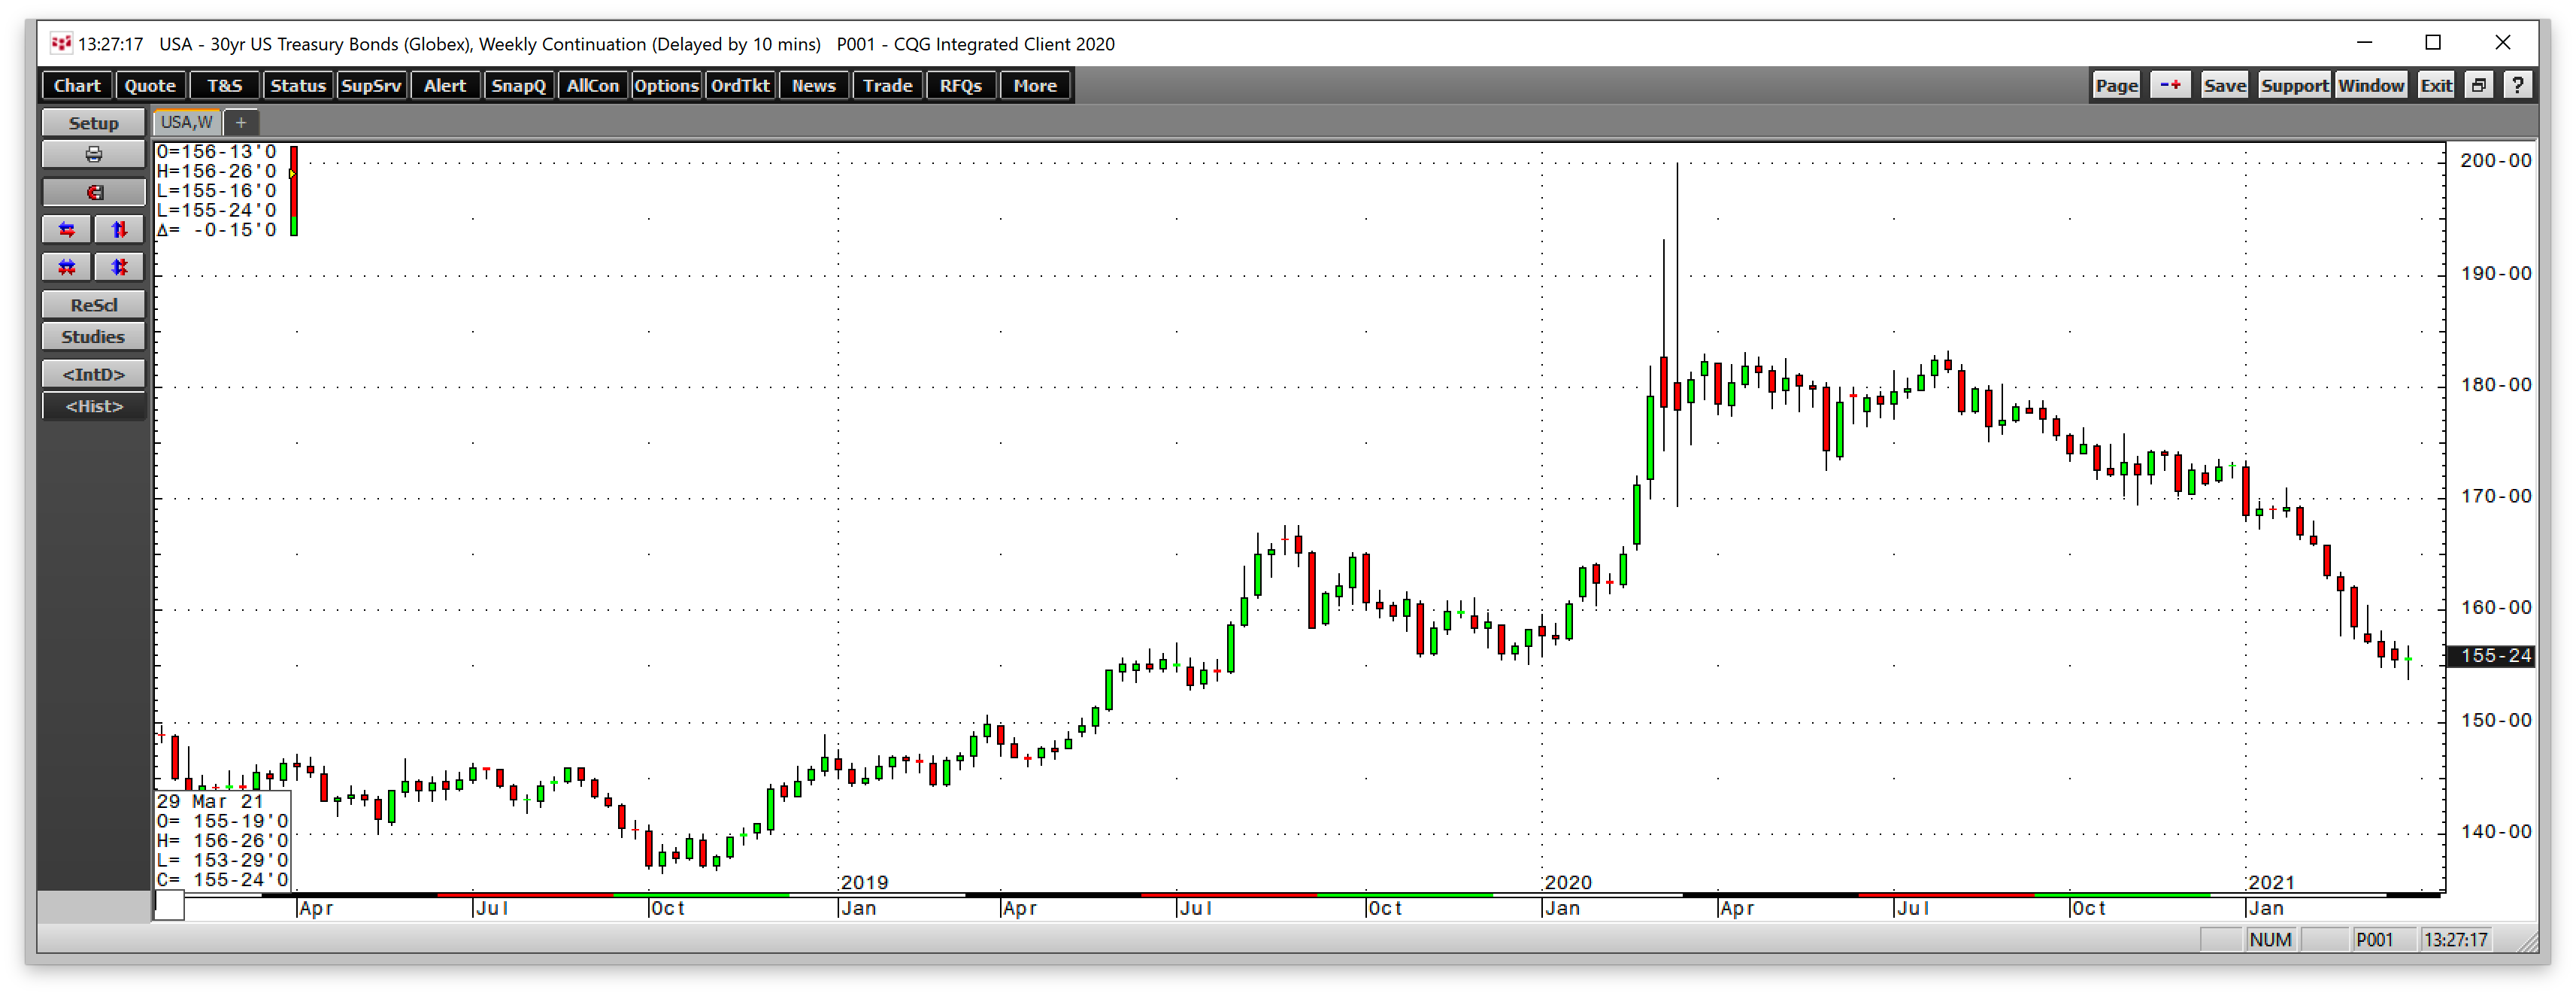
The raw material markets asset class moved higher in the first quarter of 2021 after a volatile 2020 when the pandemic caused a massive selloff early and a huge turnaround that pushed some prices… more

Petroleum prices increased in a holiday shortened week as key influences were somewhat mixed. A surge in refinery utilization to a one year high as Gasoline demand exceeds that of last year at… more
Petroleum prices ended the week mixed, settling near unchanged despite exceptional volatility with broad outright price swings throughout the week. WTI fell 0.7%, Brent gained 0.1% while RBOB… more

Presented by Financial Repression Authority.
CQG Integrated Client
Get a 2-week free trial