In early October it looked like the price of crude oil was heading for triple-digit territory on the back of sanctions on Iran that were coming in early October. At the same time, the price of natural gas futures had been consistently failing on each attempt to climb above the $3 per MMBtu level on the nearby NYMEX futures contracts.
Over the past 60 days, the fortunes of both energy commodities changed dramatically. An overabundance of longs on the oil futures market and shorts in the natural gas futures arena were reminded that expecting the unexpected in these markets and protecting against significant losses is imperative.
Crude oil plunge from the early October high
The price of NYMEX crude oil futures traded to the highest level since 2014 at $76.90 on October 3, and then turned lower.
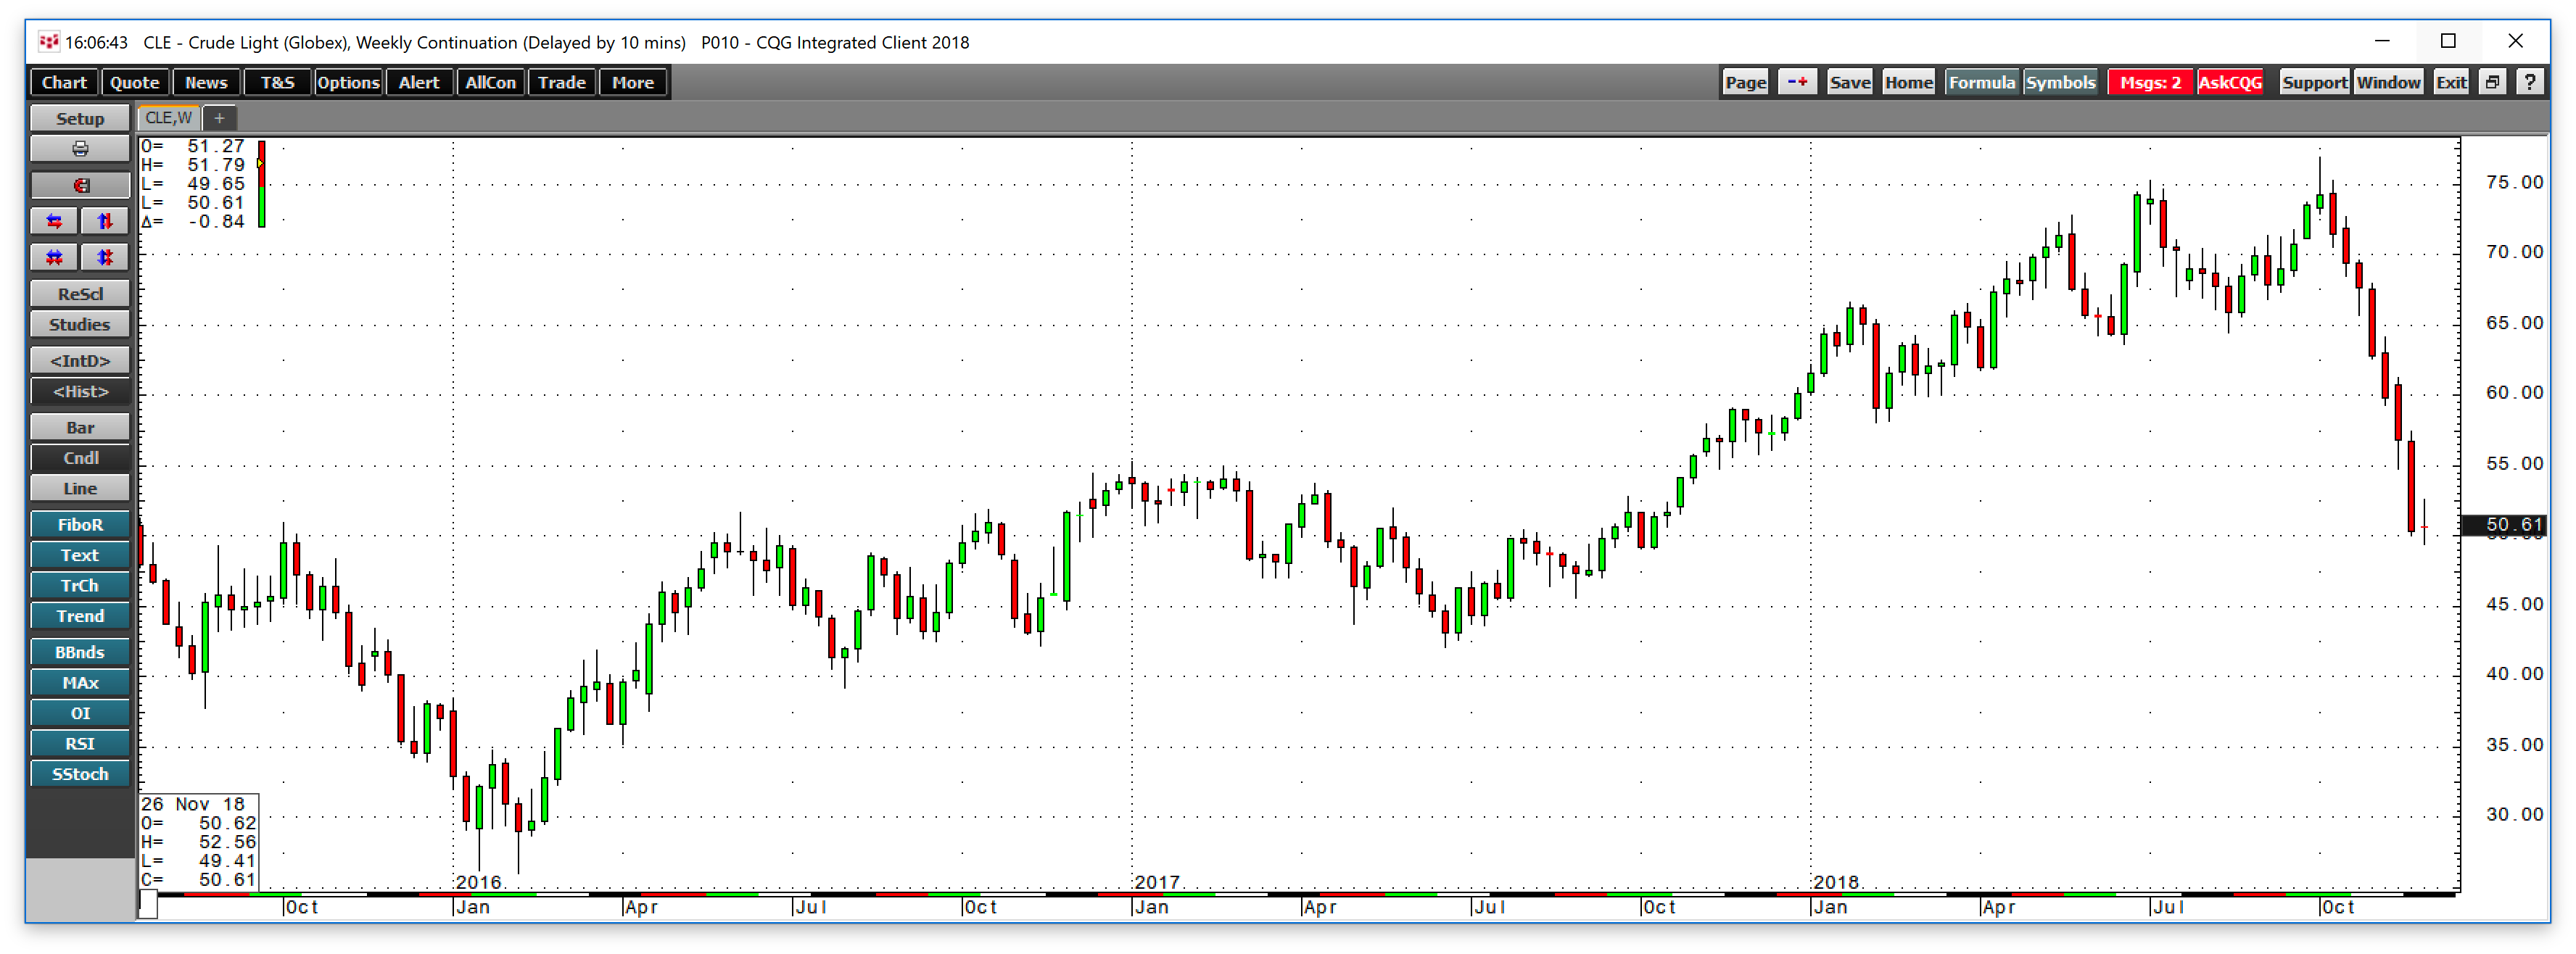
The weekly chart highlights the decline which took the price lower for seven consecutive weeks and to a low of $49.41 on the nearby futures contract on November 30, a drop of 35.7 percent. Crude oil traded to its lowest level in over a year since the week of October 9, 2017. January crude oil settled at $50.93 per barrel on the final day of trading in November, not far from the recent low which came on November 30.
Fundamentals and politics combine to push the price lower
U.S. production of crude oil rose to 11.7 million barrels per day, the highest in history according to the Energy Information Administration. With the number of rigs in operation growing, inventories in the U.S. rose for ten straight weeks starting in late September as stockpiles climbed by 56.5 million barrels over the period as reported by the EIA in their weekly data reports.
At the same time, two issues facing the Middle East combined to push the price of the energy commodity lower. While new sanctions on Iran took effect in early November, exemptions to some of the countries that rely on Iranian exports disappointed market participants who held long positions and caused selling. Moreover, the murder of Washington Post journalist and Saudi national Jamal Khashoggi resulted in problems for the Royal Family and Crown Prince Mohamed bin Salman.
Increasing supplies from the U.S., exemptions for Iranian oil exports, and increased production from Saudi Arabia turned out to be a toxic bearish cocktail for the oil futures market.
As crude oil was on its way to highs in late September and early October, many traders and investors were looking for a return to levels not seen since 2014 at over $100 per barrel. At the same time, each rally in the natural gas futures market ran into selling at over the $3 per MMBtu level.
Natural gas explodes in the prelude to the winter season
Natural gas reached a high at $3.661 in February 2018 and quickly moved back below the $3 level.

The weekly chart of nearby NYMEX natural gas futures illustrates the price of the energy commodity traded in a range between $2.53 and $3.053 per MMBtu from mid-February until the end of September. Each attempt to move above $3 attracted selling from market participants who believed that record production and massive reserves in the Marcellus and Utica shale regions of the United States had changed the dynamics of the market. However, in late September the price broke out above the technical resistance level at just over $3.05 reaching $3.368 per MMBtu during the week of October 8. After a gentle pullback to the $3.102 level, the price gapped higher at the beginning of November and blew through technical resistance levels at the February 2018 high and the December 2016 peak at $3.994 like a hot knife through butter. The nearby futures contract moved to a high at $4.929 per MMBtu which was the highest price since 2014. The next technical level in the natural futures market stands at the February 2014 peak at $6.493 per MMBtu. On November 30, the nearby futures contract settled at $4.612 per MMBtu, not far from the highs.
Inventories and the weather lift the price of the energy commodity to its highest price since 2014
Cold weather conditions early in the season caused the demand for natural gas to increase over the recent weeks. Meanwhile, the energy commodity moved from the injection to the withdrawal season with the lowest level of stockpiles in years. The most recent data from the EIA shows that inventories of the energy commodity are at a level that is significantly below last year and the five-year average for the natural gas market heading into the peak season for demand.
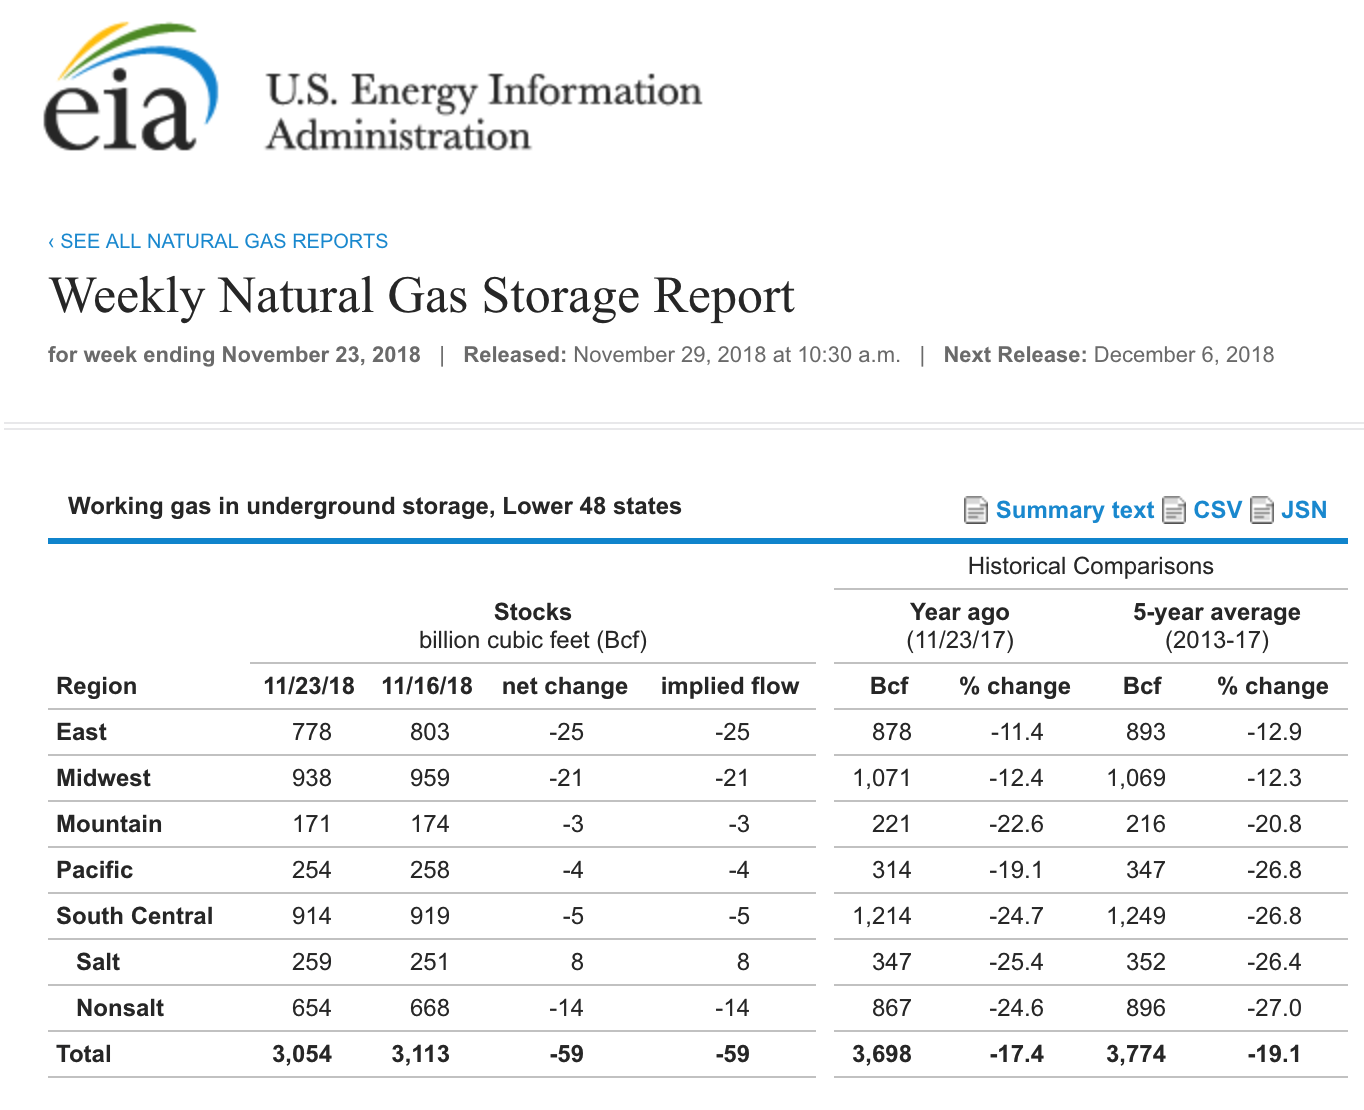
Source: U.S. Energy Information Administration, November 29, 2018; available at: http://ir.eia.gov/ngs/ngs.html
As the chart shows, on November 29 the EIA reported that as of November 23 inventories of natural gas were 17.4 percent below last year and 19.1 percent below the five-year average for this time of the year. The combination of cold weather conditions and the lowest inventories in years lit a bullish fuse in the natural gas futures market which remains near the $4.50 per MMBtu level. In late November 2013, stocks stood at 3.775 trillion cubic feet (tcf), and as of the latest EIA report they were at 3.054 tcf, 721 billion cubic feet lower than they were leading into the season when the price rose to just under the $6.50 per MMBtu level. Therefore, if the cold weather conditions persist, demand could take stocks to dangerously low levels before the beginning of the next injection season which will start sometime in March 2019.
The lesson - Expect the unexpected in markets
The price of crude oil imploded and natural gas exploded partially because market participants read the fundamentals wrong and became overstimulated on the wrong sides of each market. A popular pairs trade, long crude oil, and short natural gas turned into a disaster for some market participants. The open interest metrics in both markets is a sign of the painful results for those caught on the wrong side of either or both markets. Open interest is the total number of open long and short positions in a futures market.

The daily chart shows that the open interest in NYMEX crude oil dropped from 2,258,199 contracts on October 3, the day it hit its high, to 2,037,138 contracts on November 29. The decline of 221,061 contracts or 9.8% is a sign that market participants exited risk positions. While some of the liquidations resulted in profits for shorts, the trajectory of the move to the downside is a sign that many others scrambled to exit long positions.

Ironically, the open interest metric in the natural gas futures market reached a record high on October 4 at 1,699,571 contracts, the day after crude oil hit its peak. It is possible that the pair trade of long oil and short gas led to the increase in the metric. Meanwhile, at 1,272,749 contracts on November 29, open interest has declined by 426,822 contracts or 25.1% since early October. Again, some longs have taken profits, but many shorts found themselves scrambling for an exit as the price of natural gas blasted off to the upside and took out technical resistance levels on its way to almost $5 per MMBtu.
At the beginning of October, the overwhelming market sentiment was that oil was heading for triple-digit territory and gas was a sale at any price over $3 per MMBtu. The price action over October and November is a reminder or a lesson that we should always expect the unexpected in the volatile world of futures trading and investing.