Gold, silver,… more
Metals
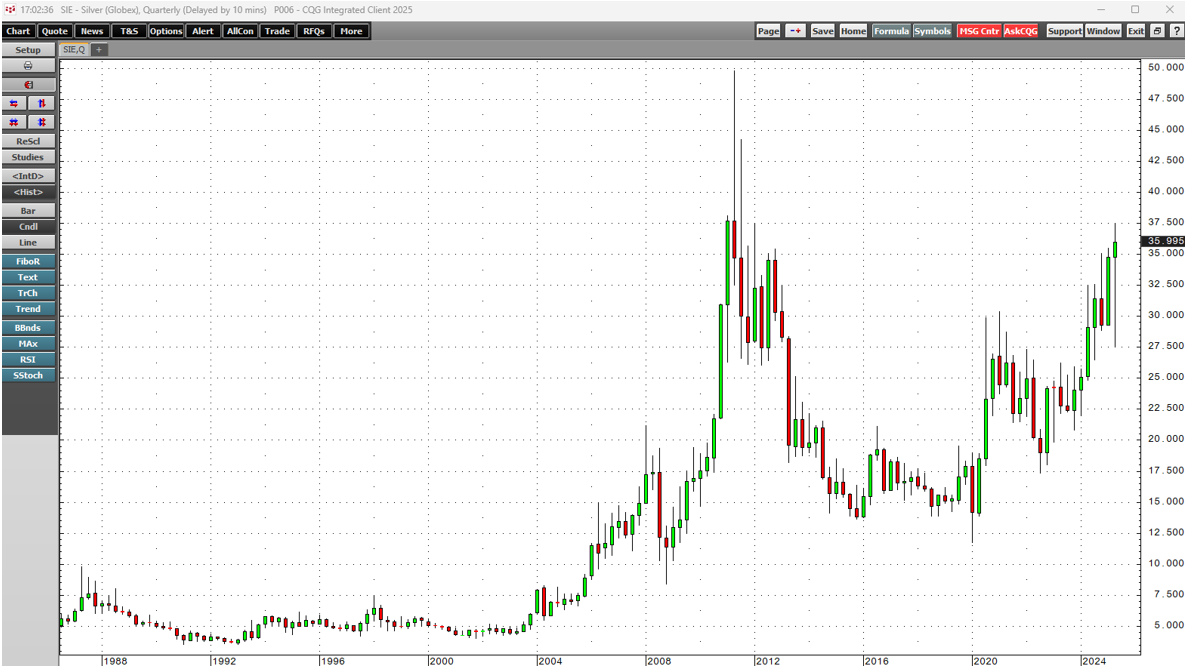
Precious… more
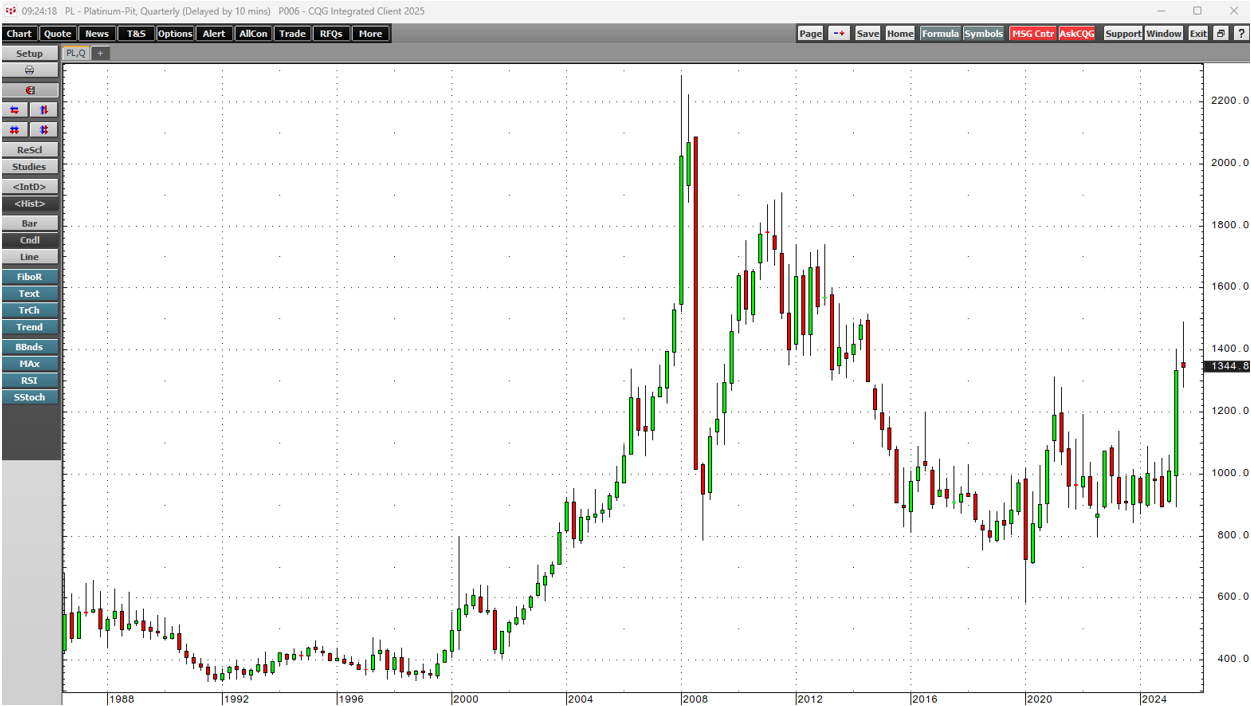
NYMEX platinum futures reached their all-time high in 2008 at $2,308.80 per ounce. Meanwhile, the NYMEX palladium futures rose to a record high of $3,380.50 in 2022.
For nearly a decade, the… more
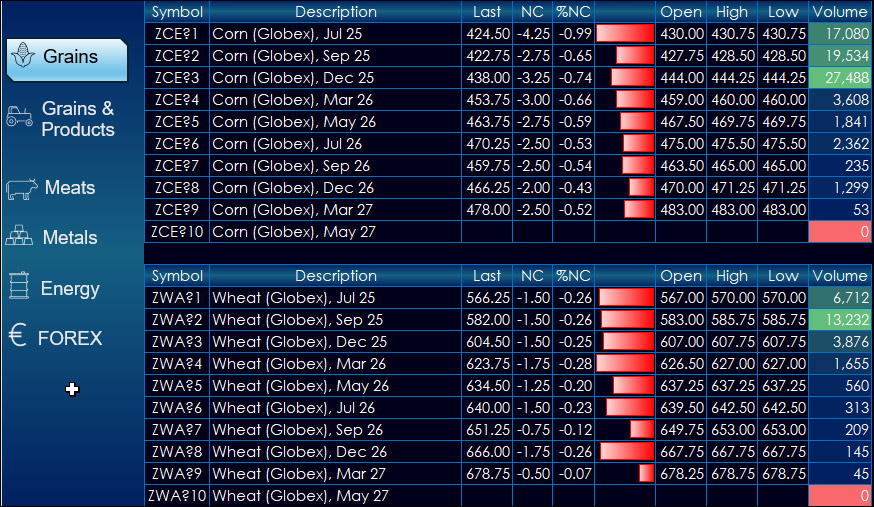
This dashboard provides market data for CME products. The dashboard uses a navigation bar instead of tabs.
The left-hand side provides market data for products. The right-hand side… more
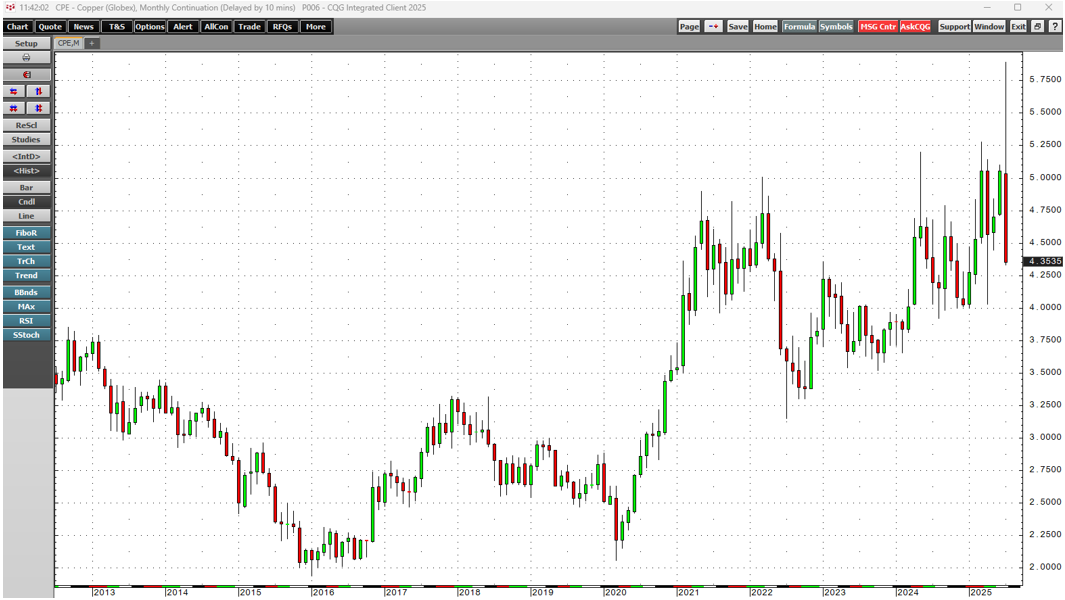
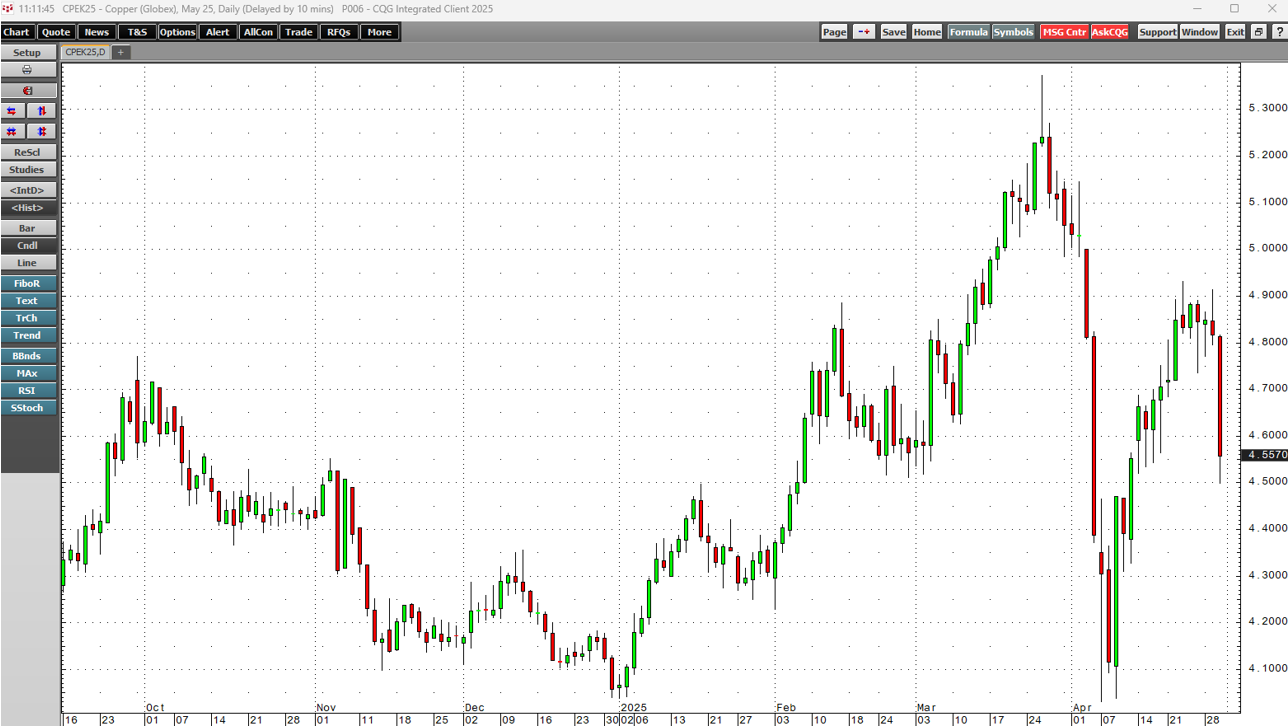
March and April 2025 were hair-raising rollercoaster months for the copper market. While the COMEX futures rose to new highs, eclipsing the May 2024 peak in March, the LME forwards did not… more
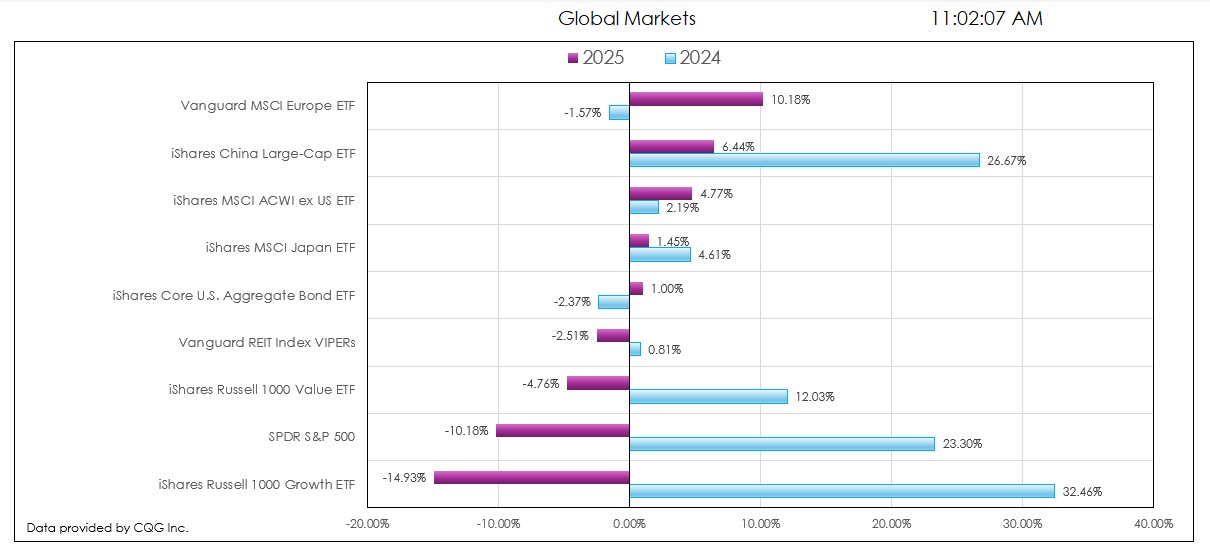
This post details the downloadable Excel Market Performance Dashboard's features and functions. The dashboard has seven tabs (the first is data and the other tabs display a chart and a table of… more
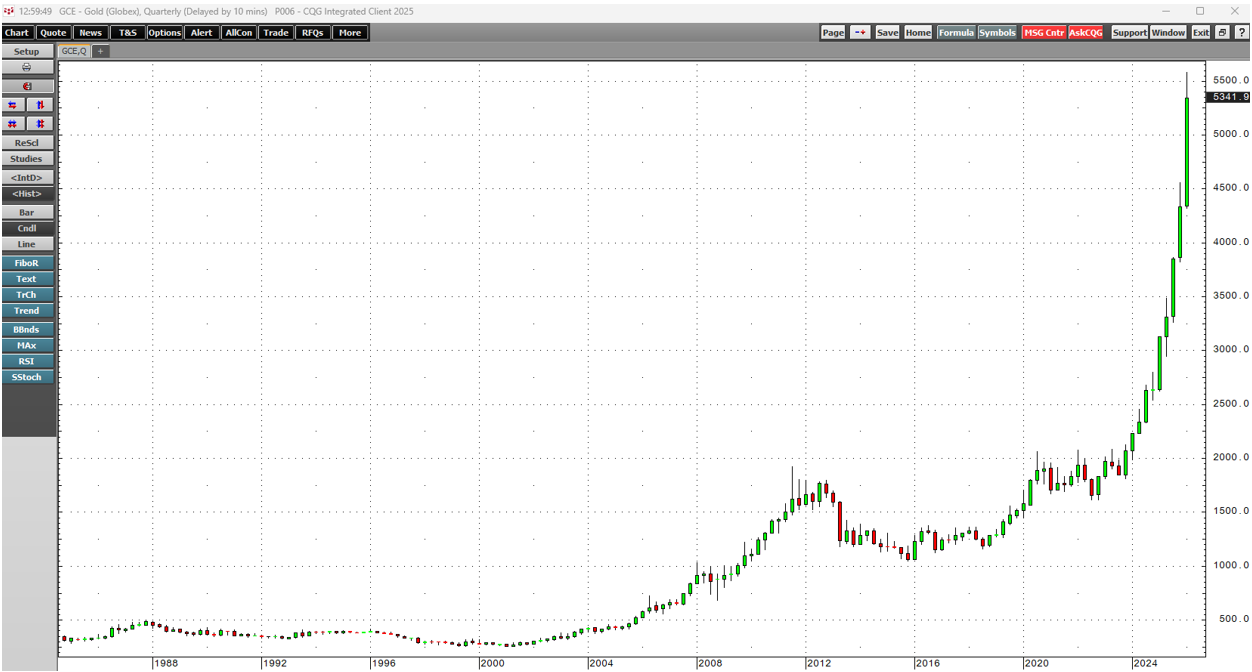
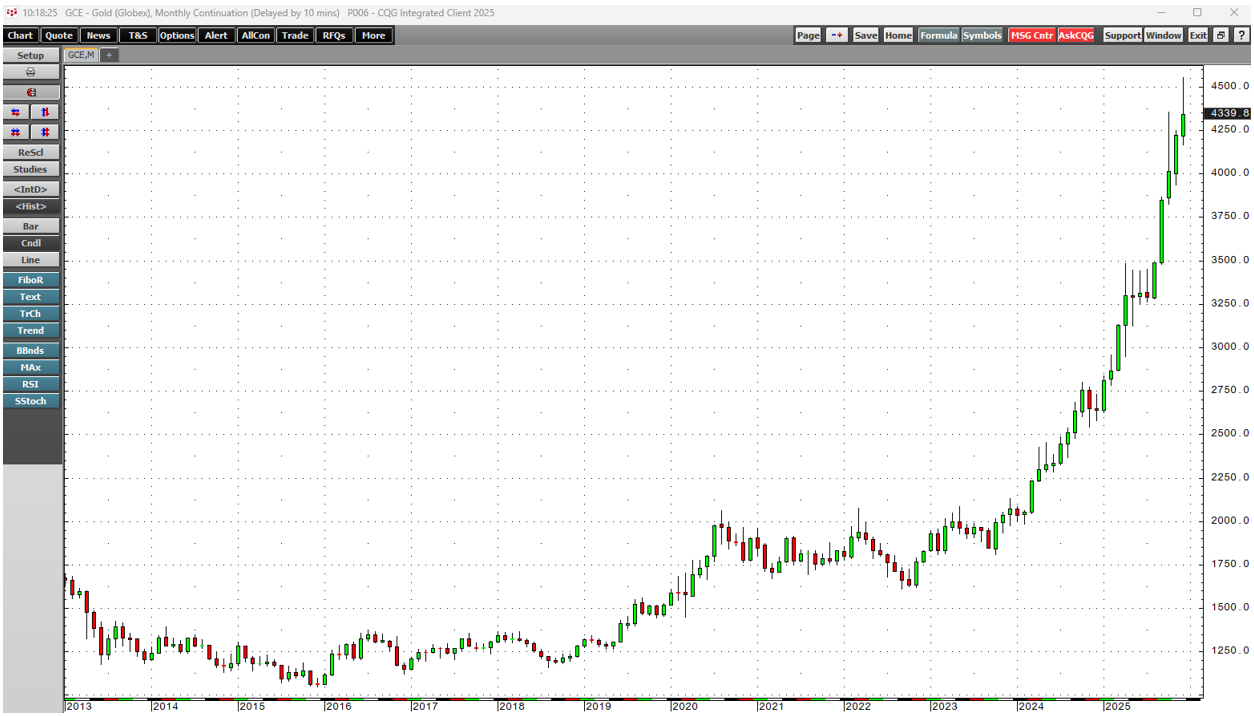
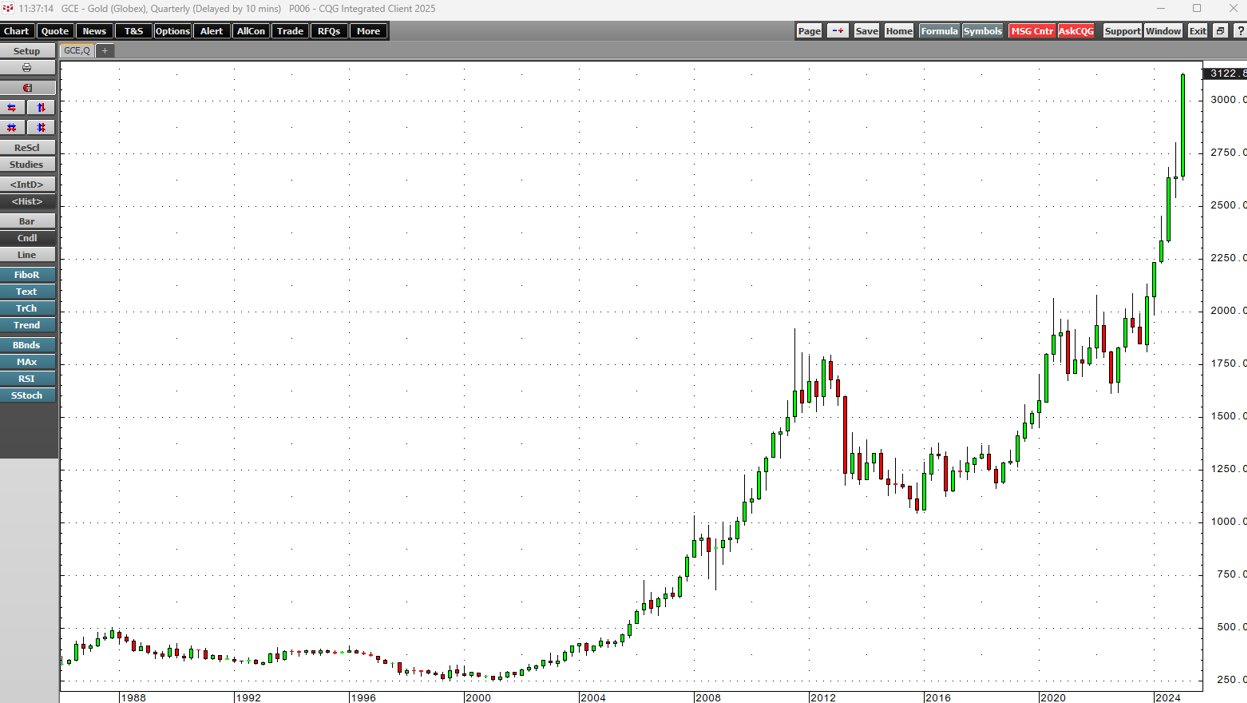
Gold continues to be a bullish beast. After reaching new all-time highs in 2020, 2021, 2023, and 2024, the precious metal has increased its upward momentum in 2025.
Gold has not traded below… more
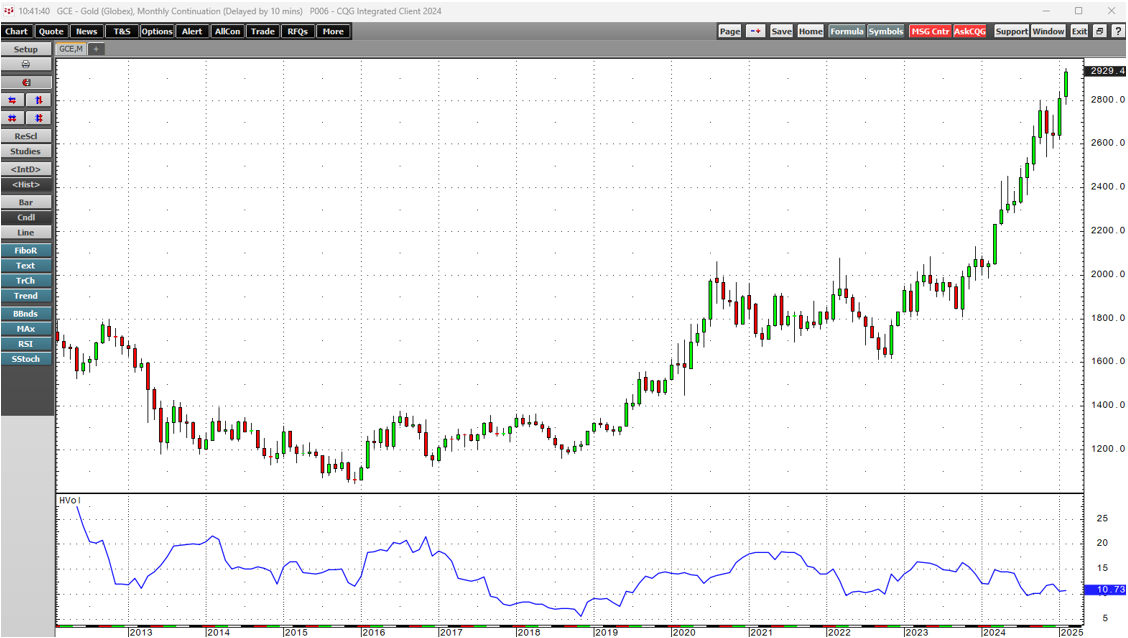
Gold reached another nominal high in February 2025 when the continuous COMEX futures contract price rose to over $2,945 per ounce. Over the past year, copper, gold, coffee, cocoa, and frozen… more
