Gold continues to be a bullish beast. After reaching new all-time highs in 2020, 2021, 2023, and 2024, the precious metal has increased its upward momentum in 2025.
Gold has not traded below $1,000 per ounce since 2009, under $1,500 per ounce since 2020, and below $2,000 per ounce since 2024. Gold is now above $3,000 per ounce, reaching its most recent peak in March 2025.
Gold is the world's oldest means of exchange, and its appreciation against all currencies is a commentary on the value of foreign exchange instruments. The trend is always a trader or investor's best friend, and gold's short, medium, and long-term path of least resistance remains higher as the markets move into the second quarter of 2025.
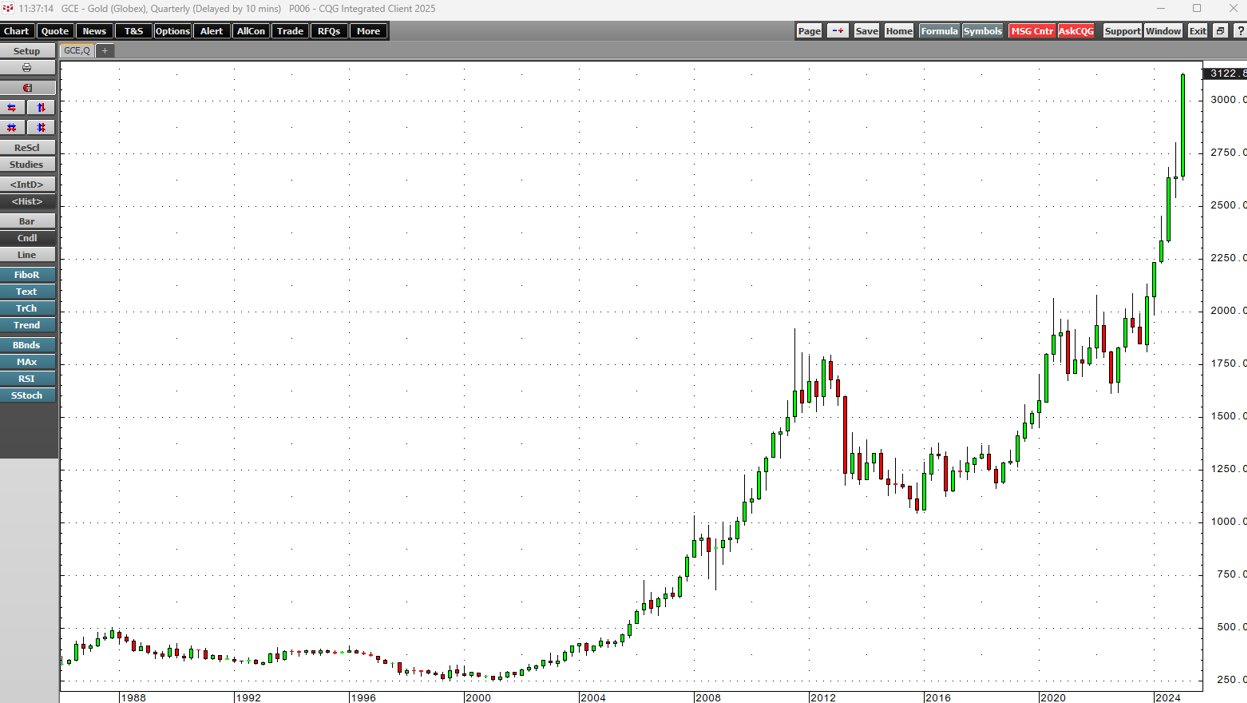
New highs in gold as the yellow metal eclipses $3,100 per ounce
The quarterly chart highlights gold's ascent since the 1999 $252.50 per ounce bottom.
The chart shows that after putting in a bullish key reversal pattern on the quarterly chart in Q4 2023, where the gold futures fell below the Q3 2023 low and closed above the Q3 2023 high, the precious metal has posted six consecutive quarterly gains. The parabolic price action has taken gold over $3,100 per ounce to a continuous contract high of $3,132.50 in March 2025.
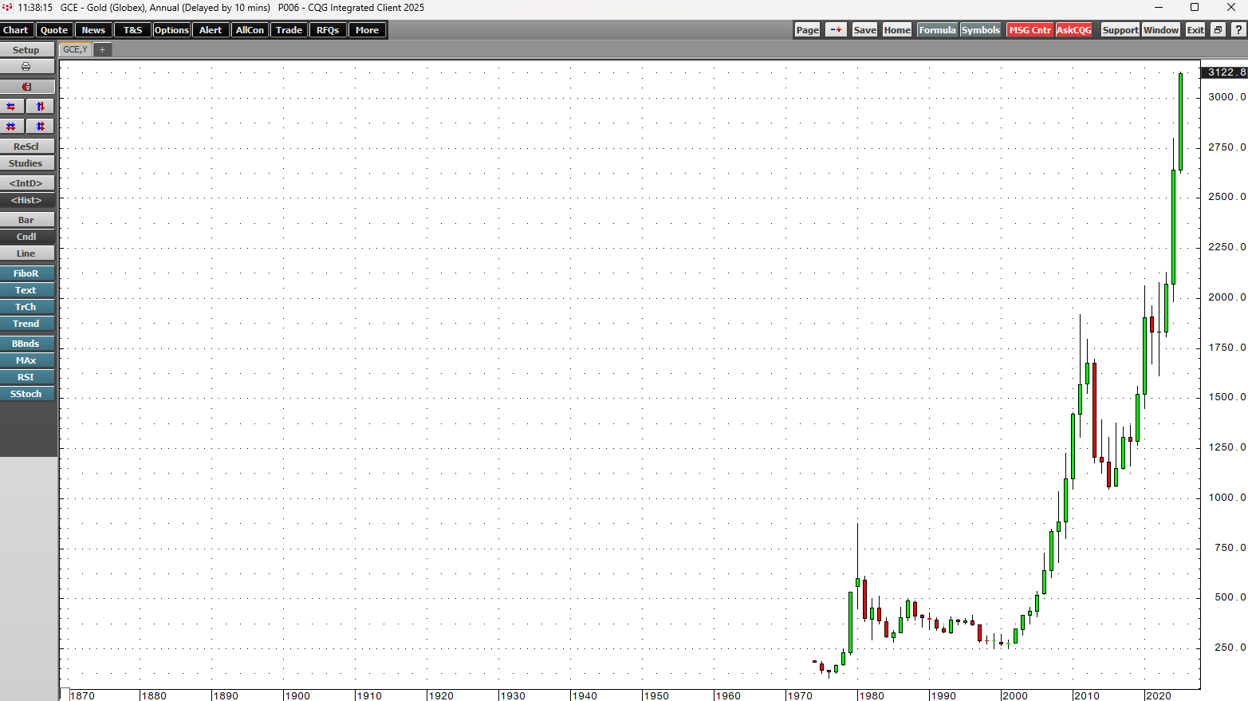
Gold is in uncharted territory, but an inflation adjustment to the 1980 high suggests an upside target
While the rally thrust gold into uncharted territory in March 2025, the annual chart shows that gold's record higher before 2007 was $875 per ounce.
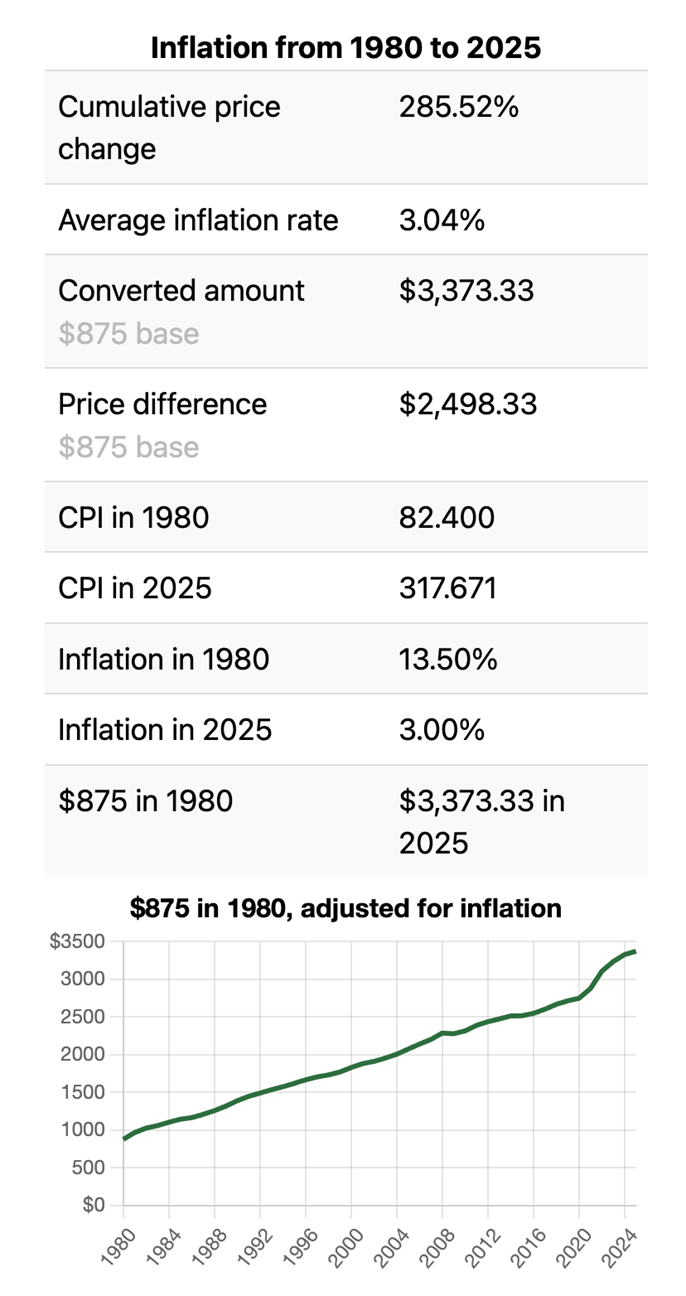
With gold reaching new highs identifying technical resistance is challenging. Meanwhile, when adjusted for inflation, the 1980 $875 peak could offer insight into gold's upside target.
Source: CPI Inflation Calculator
The inflation calculator shows that the $875 1980 high is worth just under $3,375 per ounce in 2025, which could be gold's next upside target. Above that level, gold would truly be in uncharted territory.
Gold's ascent reflects the descent of fiat currencies
The U.S. dollar is the world's reserve currency and the pricing mechanism for gold and many other commodities. Meanwhile, gold has rallied to record highs in all fiat currencies, including the dollar. Fiat currencies reflect the full faith and credit in the countries issuing their legal tender. Gold's rally tells us that all fiat foreign exchange instruments are losing value against the precious metal.
Central banks and governments validate gold's role in the worldwide financial system by holding gold reserves and classifying the precious metal as a foreign currency reserve. Over the years, central banks have been net buyers, increasing gold reserves and further validating gold's role as a precious reserve asset.
Silver has the potential for a parabolic rally
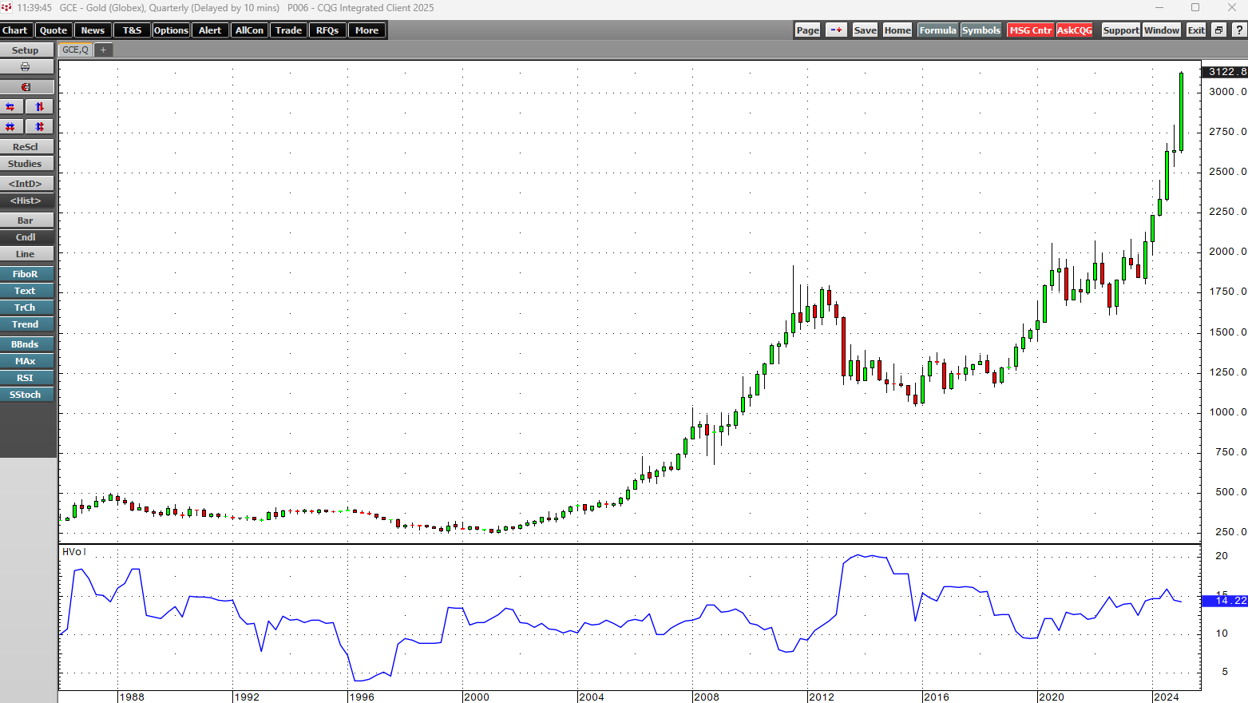
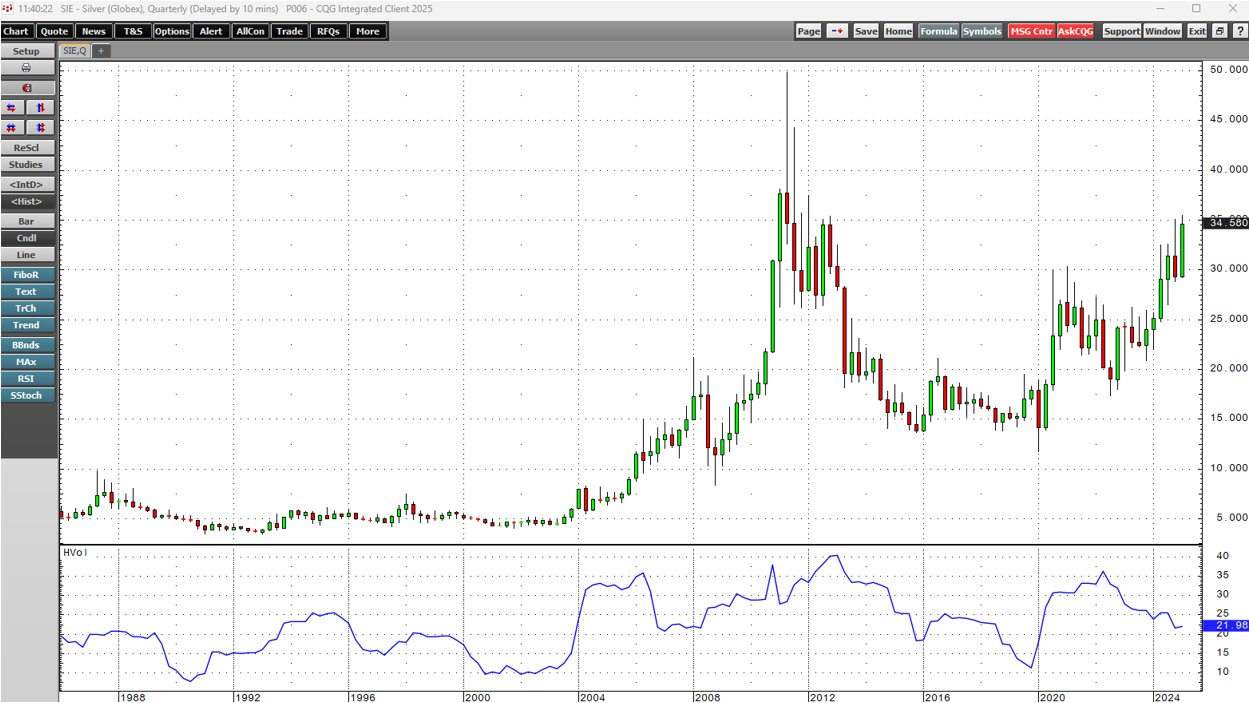
Silver is more volatile than gold.
The chart shows that gold's quarterly historical volatility is at the 14.22% level.
Silver's quarterly historical volatility at 21.98% is considerably higher than gold's. While governments and central banks previously held silver reserves, silver's penchant for volatility ended its use as a reserve asset.
Meanwhile, silver prices above the $34 per ounce level in late March are attractive. As gold's sibling, silver remains substantially below its record 1980 $50.36 high and the slightly lower $49.82 2011 peak.
Silver has room to rally, based on gold's price action and the bullish trend that has taken silver higher from the 2020 pandemic-inspired $11.74 low. Silver futures put in a bullish key reversal pattern on the quarterly chart in Q1 2020 and have made higher lows and higher highs over the past five years.
Tariffs are impacting the gold and silver markets
Tariffs under the Trump administration have significantly impacted on gold and silver prices in 2025. In my late February CQG article on silver, I concluded:
While silver has been in a bullish trend since the March 2020 low, buying silver on price weakness has been optimal, and I expect that to continue. Silver could be on a path to challenge the 2011 and 1980 highs, but historical volatility suggests that there will be plenty of ups and downs along the way. Until silver breaks above the critical technical resistance levels, accumulating silver on price weakness is likely the optimal investment and trading path.
I explained how tariffs have distorted gold and silver prices, writing:
Tariffs distort commodity prices as they create trade barriers. Gold and silver's most liquid markets are in London, as precious metals dealers offer allocated and unallocated gold and silver trading. The allocated precious metals have specific bar numbers in vaults. The unallocated precious metals are a book entry backed by physical holdings. London is the home of the wholesale physical bullion market, regulated by the Bank of England. The COMEX futures market in the United States has a delivery mechanism and U.S. vaults. The uncertainty of tariffs on gold and silver flowing into the U.S. has created significant volatility in EFP transactions, or the difference between prices for gold and silver in London and futures prices in the United States. Gold has been in a bullish trend since 1999, and silver has been in a bullish trend since 2020. The tariff threat has only supported a bullish path of least resistance. The leading precious metals have flowed from Europe to the United States over the past weeks.
Central bank gold holdings make governments a lender of last resort in the gold market. However, silver is another story, as there is no liquidity option if a parabolic move in silver develops. As gold becomes more expensive, market participants could turn to silver as the potential for a challenge of the 1980 and 2011 highs increases.
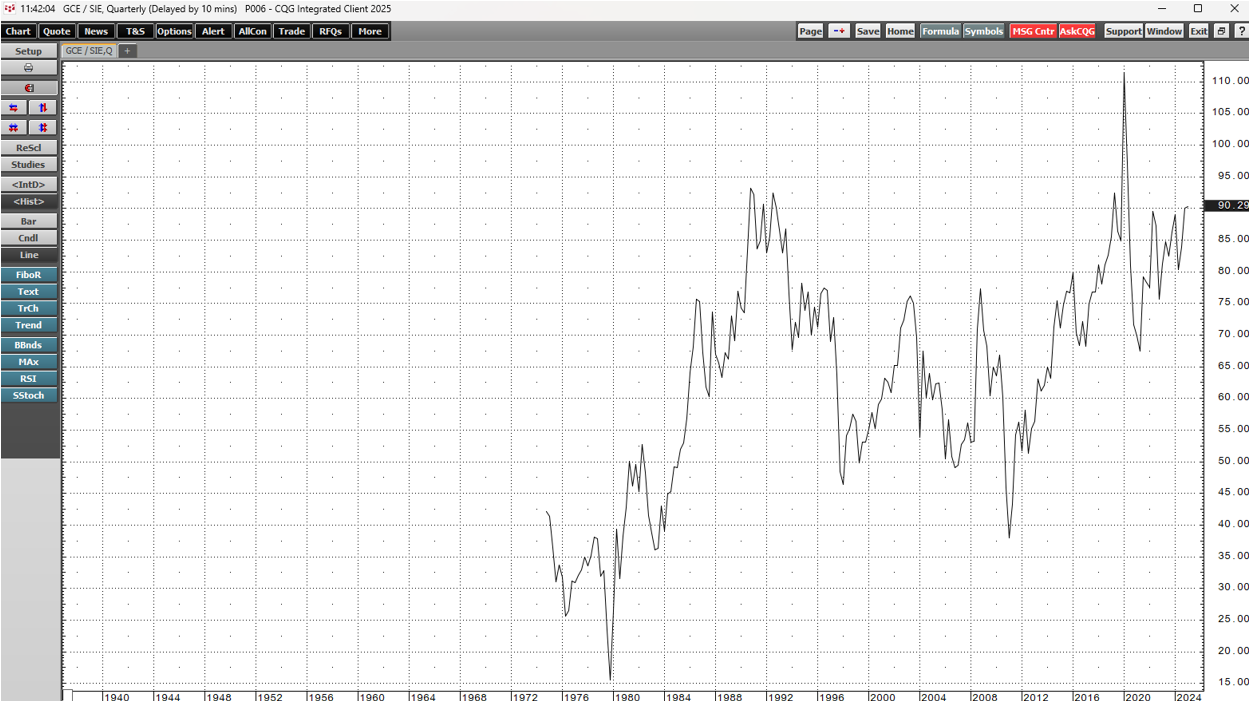
The first Egyptian Pharaoh, Menes, established the gold-silver ratio at 2.5 parts silver to one part gold in 3200 BCE. In modern times, the metric measuring the number of ounces of silver value in each ounce of gold value has been as low as 15.50 ounces of silver to one ounce of gold in 1979 and as high as 111.50 ounces of silver against the yellow metal in 2019.
The chart shows that over the 90:1 level, silver is historically inexpensive compared to gold in 2025.
Gold has been a bullish freight train, and standing in front of the current trend has been a mistake for years. Silver has the potential to go parabolic in the current environment. The bottom line is that the leading precious metals, with long histories as means of exchange, will continue to be more precious in 2025, with more gains likely over the coming months.
