Gold reached another nominal high in February 2025 when the continuous COMEX futures contract price rose to over $2,945 per ounce. Over the past year, copper, gold, coffee, cocoa, and frozen concentrated orange juice futures have reached new record peaks.
Meanwhile, gold's record high was nominal, as the 1980 inflation-adjusted $875 peak translates to would equate to a much higher price in 2025:
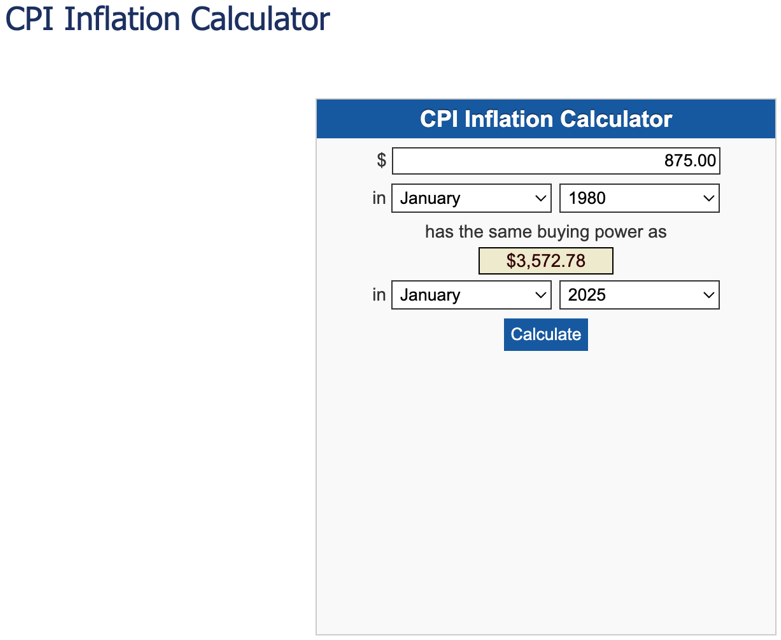
Source: bls.gov
The chart shows the 1980 gold peak would equal nearly $3,575 when adjusted for inflation in 2025. Therefore, gold's ascent could continue over the coming weeks, months, and perhaps years.
Meanwhile, silver remains significantly below its 2011 and 1980 highs around the $50 per ounce level. Silver has been in a bullish trend over the past years, but the current environment could ignite an explosive rally in the second-leading precious metal that tends to be more volatile than gold.
Tariff threats have caused gold and silver distortions
During the 2024 presidential campaign, President Trump told the world about his preference for tariffs over taxes. The 47th U.S. President did not wait long to announce tariffs on three of the U.S.'s largest trading partners. In early February, the Trump administration leveled 25% tariffs on neighboring Canada and Mexico and an additional 10% tariff on China. The three countries are leading precious metals producers. Mexico is the leading producer, with nearly twice the silver output of second-place China. Canada is the 17th leading silver-producing country.
Tariffs distort commodity prices as they create trade barriers. Gold and silver's most liquid markets are in London, as precious metals dealers offer allocated and unallocated gold and silver trading. The allocated precious metals have specific bar numbers in vaults. The unallocated precious metals are a book entry backed by physical holdings. London is the home of the wholesale physical bullion market, regulated by the Bank of England. The COMEX futures market in the United States has a delivery mechanism and U.S. vaults. The uncertainty of tariffs on gold and silver flowing into the U.S. has created significant volatility in EFP transactions, or the difference between prices for gold and silver in London and futures prices in the United States. Gold has been in a bullish trend since 1999, and silver has been in a bullish trend since 2020. The tariff threat has only supported a bullish path of least resistance. The leading precious metals have flowed from Europe to the United States over the past weeks.
Four reasons the current environment is more bullish for silver than gold
Reason number one is historical volatility.
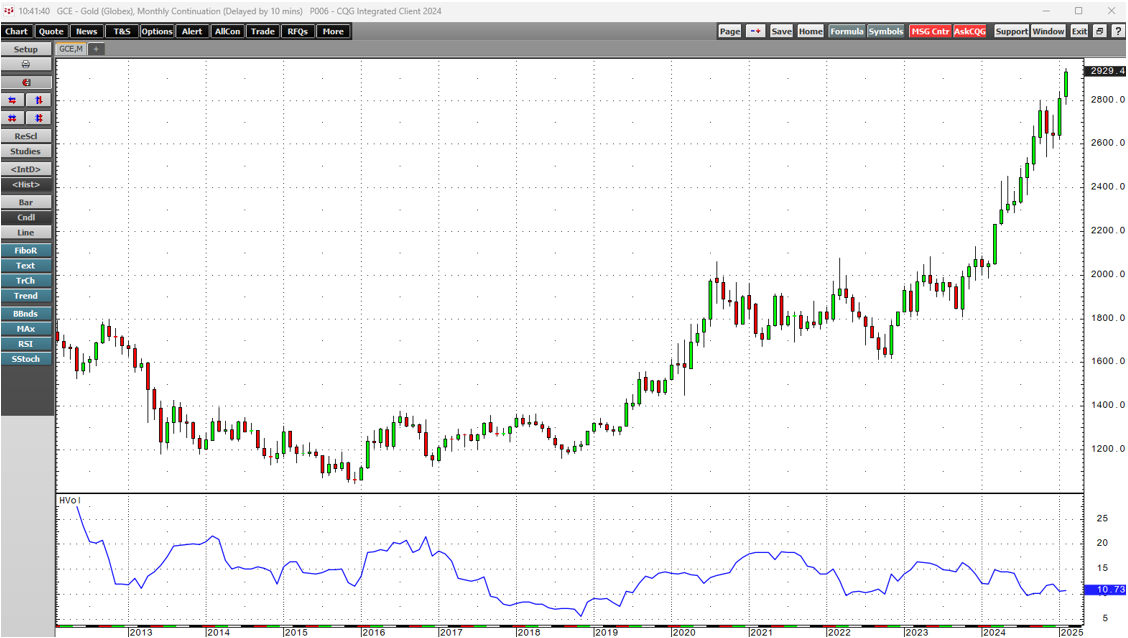
The monthly chart shows that monthly historical gold volatility is at the 10.73% level.
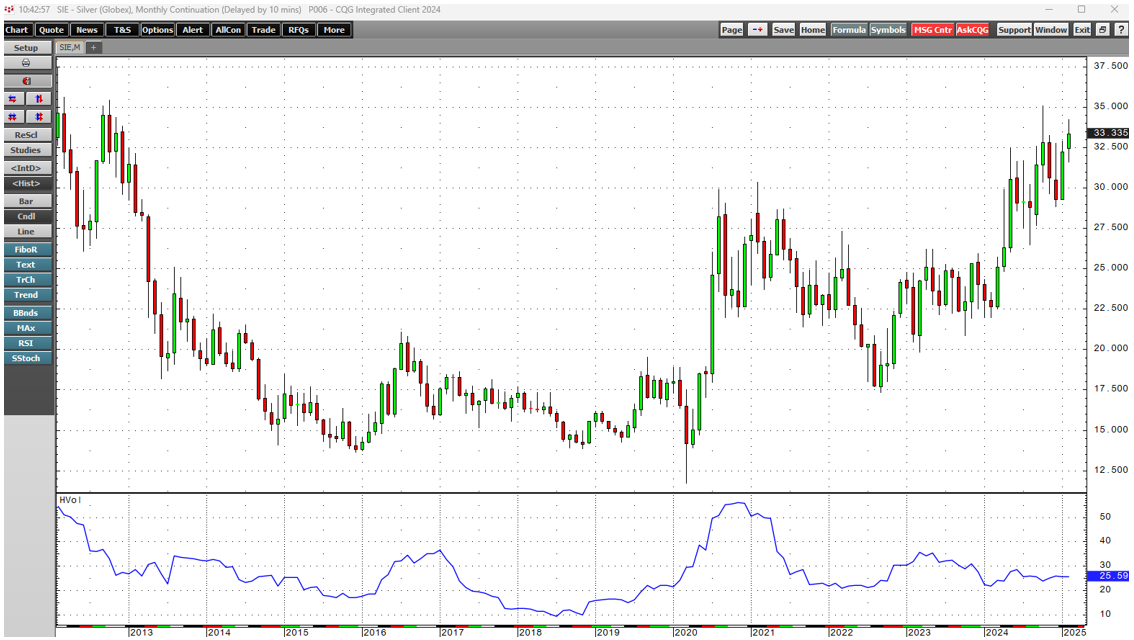
Silver's monthly price variance metric is more than double gold's at the 25.59% level.
Silver's penchant for volatility makes it more likely to experience explosive or implosive price action.
Reason number two is that central banks worldwide own gold as a reserve asset, validating its role in the global financial system. With significant holdings, central banks and governments are lenders of last resort to the gold market. The official sector abandoned silver as a reserve asset long ago. Moreover, it is easier to transport gold than silver because it often travels by ocean vessel, requiring time, as it is a far bulkier commodity. There are over 88 ounces of silver value in one ounce of gold value at the current price level. Therefore, the current tightness caused by tariff threats could have a far more bullish impact on silver's price.
Reason number three is silver's role as a speculative asset. When silver eclipses critical technical support or resistance levels, a herd of buying or selling tends to descend on the market. Silver's current bullish trend suggests that the next technical break will be on the upside.
Reason four is that silver and gold have been making higher lows and higher highs despite a relatively strong U.S. dollar and high long-term interest rates, which tend to be bearish factors for precious metals. The bullish price action during a period of dollar strength and bond market weakness reveals underlying strength in the precious metals.
Silver has been in a bullish trend since March 2020
The continuous silver futures contract reached a spike pandemic-inspired $11.74 per ounce low in March 2020.
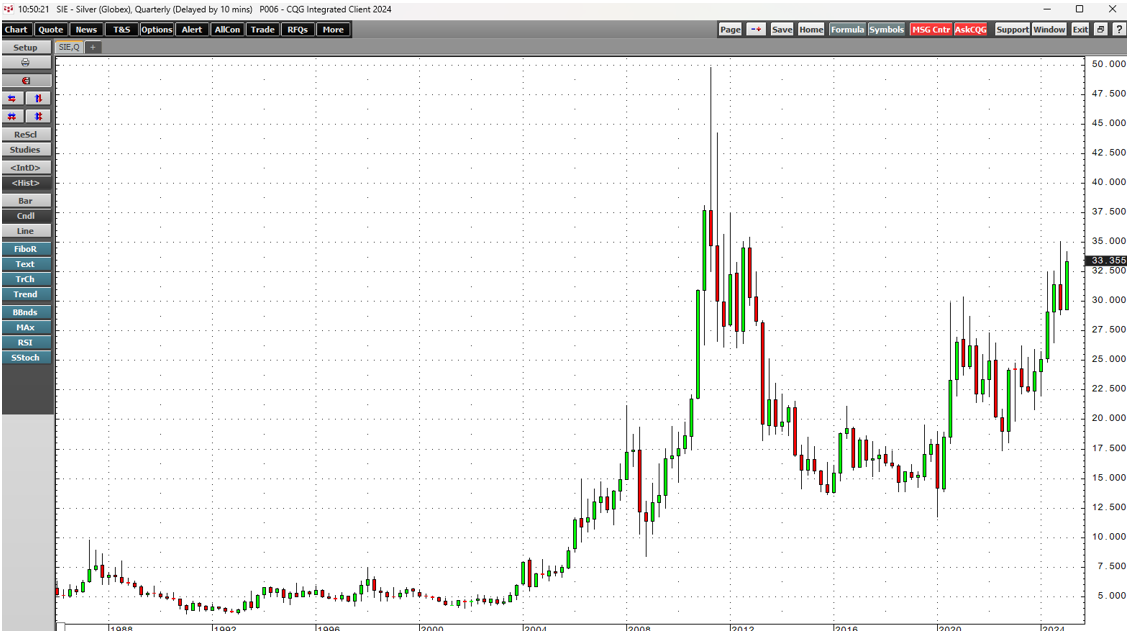
The quarterly chart highlights the pattern of higher lows and higher highs over the past five years that took silver futures to their latest $35.07 high in October 2024.
The levels to watch over the coming weeks and months
At over $33 per ounce, silver remains a stone's throw from the October 2024 high, the highest price since October 2012.
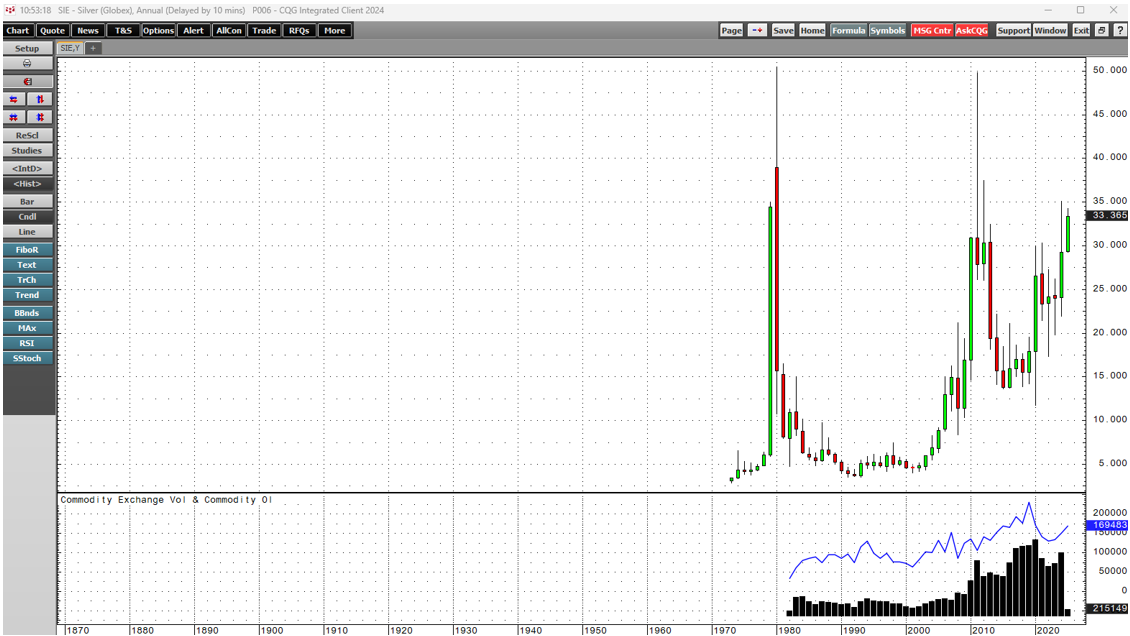
The annual chart indicates silver's significant technical milestones in February 2025. Above the late 2024 high, the January 2012 $37.48 peak is the gateway to a challenge of the 2011 $49.82 high and the 1980 $50.36 record peak. Long-term technical support stands below the $20 per ounce level. Rising open interest since 2022 validates the bullish trend.
Like gold, the 1980 high adjusted for inflation yields a far higher price target for silver.

Source: bls.gov
The chart shows silver's inflation-adjusted target from 1980 is above $200 per ounce in 2025. While it is unlikely silver will reach this level, the 1980 nominal $50.36 peak is a logical target. Given the rallies in gold, cocoa, coffee, and orange juice markets, silver could be the next commodity that experiences a parabolic rally.
Expect a wild ride in the silver market
Silver is not for the faint of heart, as it has experienced boom-and-bust price action for over a half a century. Even the most aggressive bull markets rarely move in straight lines, and silver is no exception. Silver futures reached $35.07 in October 2024, before correcting over 17.7% to a $28.855 low in December 2024.
While silver has been in a bullish trend since the March 2020 low, buying silver on price weakness has been optimal, and I expect that to continue. Silver could be on a path to challenge the 2011 and 1980 highs, but historical volatility suggests that there will be plenty of ups and downs along the way. Until silver breaks above the critical technical resistance levels, accumulating silver on price weakness is likely the optimal investment and trading path.