From their website:
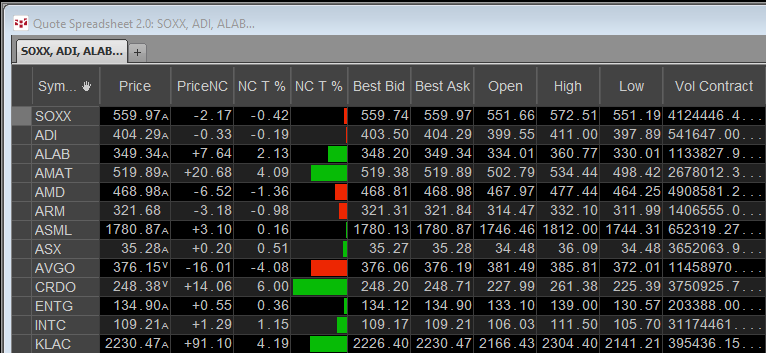
The iShares Semiconductor ETF seeks to track an U.S. equity index of companies in the semiconductor sector. The fund offers a way to invest in companies across the… more
From their website:
The iShares Semiconductor ETF seeks to track an U.S. equity index of companies in the semiconductor sector. The fund offers a way to invest in companies across the… more

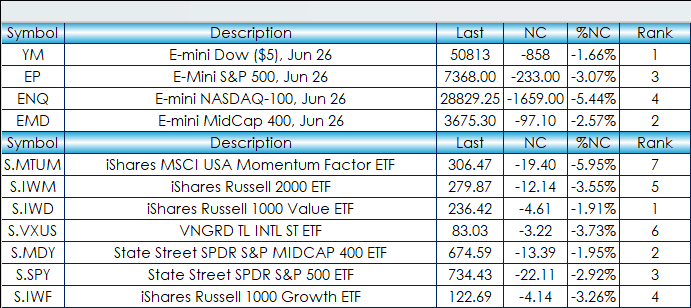
This midweek look shows the Nikkei 225 (Osaka), Jun 26 contract, with a loss of -4.72%. The best performer in the US market is the E-mini Midcap, Jun 26 contract showing a gain of -0.23%.… more
This post offers a sample spreadsheet with typical RTD formulas used for building a market quotes dashboard. You can download the dashboard and enter in symbols. All capital letters are required.… more
This midweek look shows the Nikkei 225 (Osaka), Jun 26 contract, with a gain of +2.89%. The best performer in the US market is the E-mini NASDAQ 100, Jun 26 contract showing a gain of +0.80… more
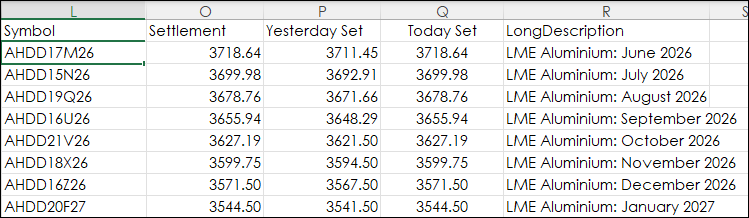
The London Metal Exchange (LME) is the world center for the trading of industrial metals. The majority of non-ferrous metal futures business is transacted on the LME platforms.
The LME… more
This midweek look shows the Nikkei 225 (Osaka), Jun 26 contract, with a gain of +2.68%. The best performer in the US market is the E-mini NASDAQ 100, Jun 26 contract showing a gain of +1.40… more
From the iShares website:
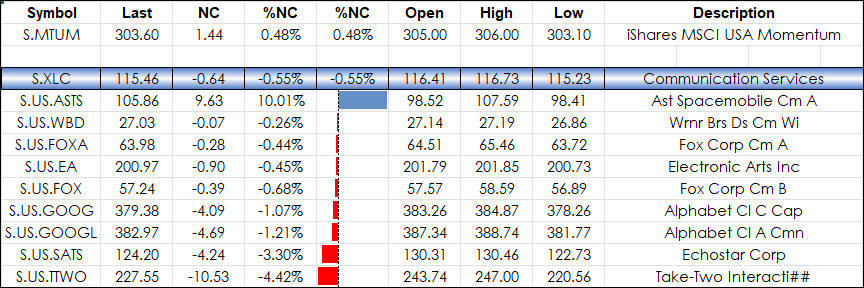
The iShares MSCI USA Momentum Factor ETF (Symbol: MTUM) seeks to track an index of U.S. stocks exhibiting relatively high price momentum. The fund offers a way to… more
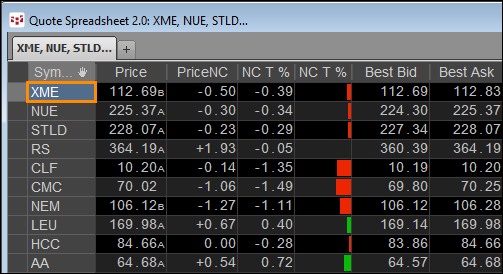
This post details a CQG PAC that is a CQG page that can be downloaded and installed to track the day’s performance of the holdings of the SPDR® S&P® Metals & Mining ETF.
From The… more
This midweek look shows the Nikkei 225 (Osaka), Jun 26 contract, with a loss of -1.11%. The best performer in the US market is the E-mini Dow, Jun 26 contract showing a gain of +0.74%. The… more
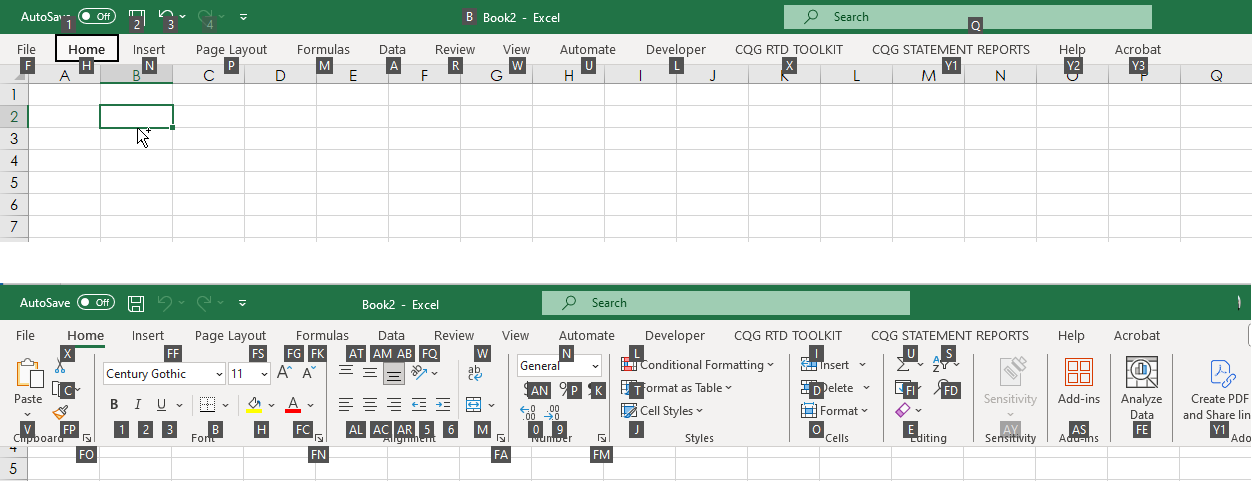
Knowing Excel Shortcuts will increase your efficiency with designing your Excel dashboards. There is a previous post, "Excel Keyboard Shortcuts," that detailed Excel shortcuts that eliminated… more