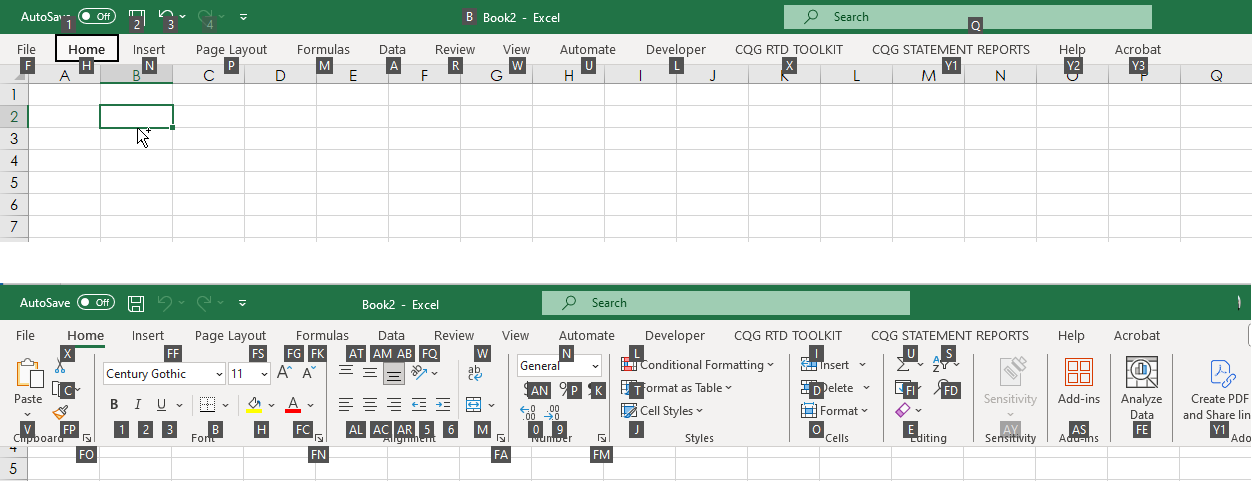
If you use Microsoft® Excel as part of your workflow with CQG IC or QTrader then you may or may not be using Excel keyboard shortcuts. This post details using keyboard shortcuts in Excel 365 to… more
Workspaces
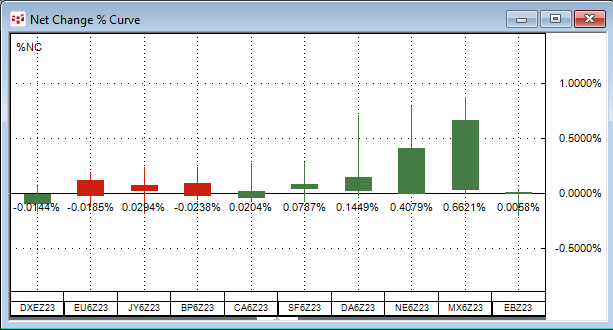
The Net Change Curve chart displays a collection of symbols’ daily net price change or daily net percentage change making it easy to compare on a relative basis each market’s current session’s… more

In this post, the aspects of becoming a good rule-based trader are discussed. But first, an illustrative story...
While attending college I worked in warehouses on Seattle's… more
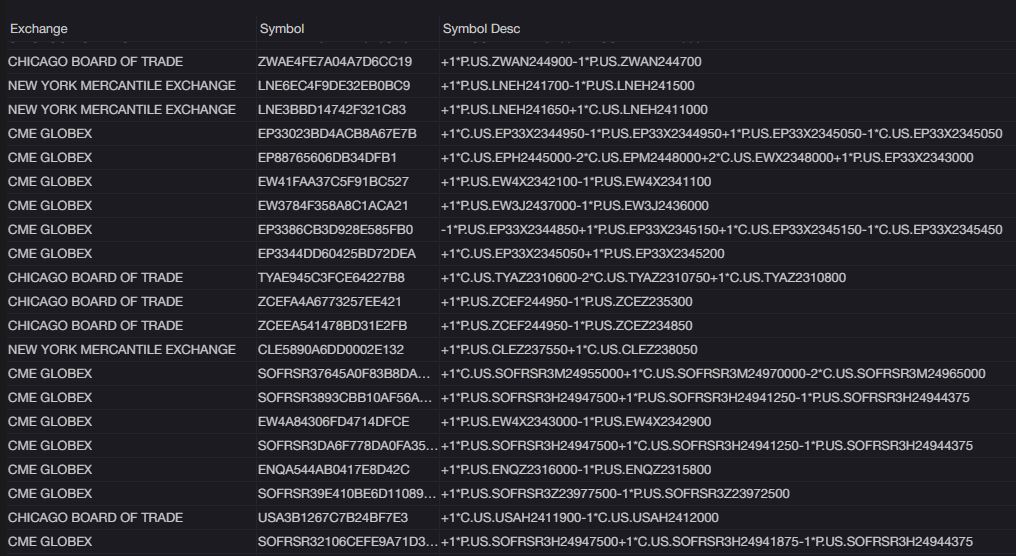
CQG One provides an "Active RFQ" widget. A Request for Quote (RFQ) is functionality provided for traders to access electronic quotes on multi-leg options strategies. It is an electronic message… more
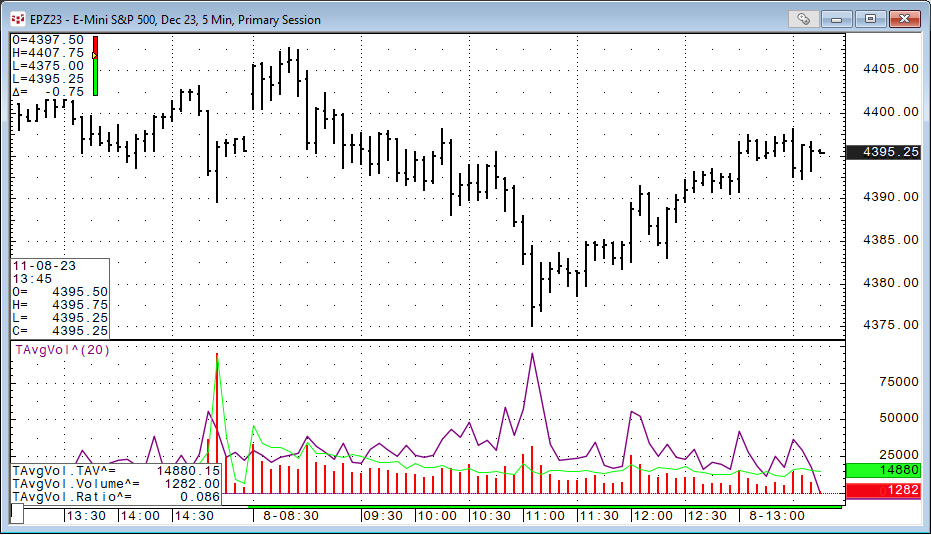
This post details the use of the CQG function: Time Average (TimeAvg), which calculates the average for values taken at the same time of day over the lookback period.
In this example, the… more
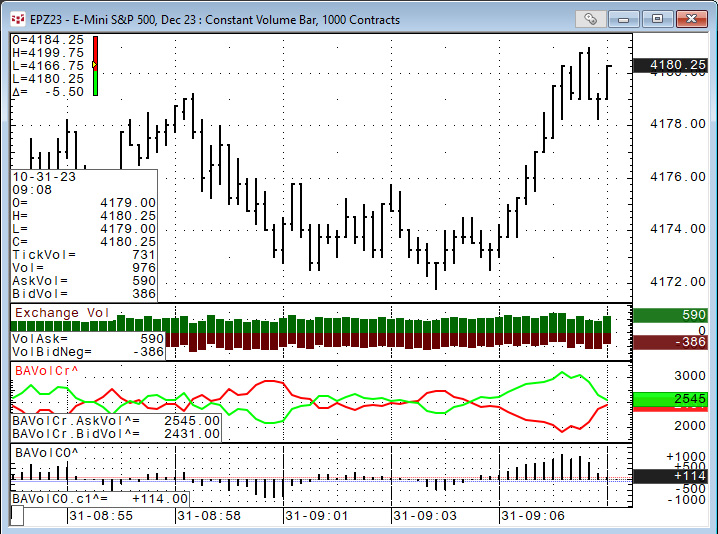
CQG IC and QTrader offer charts that utilize volume for the horizontal scale, not time. The first chart type to discuss is Constant Volume Bars.
Constant Volume Bar (CVB)
The Constant… more
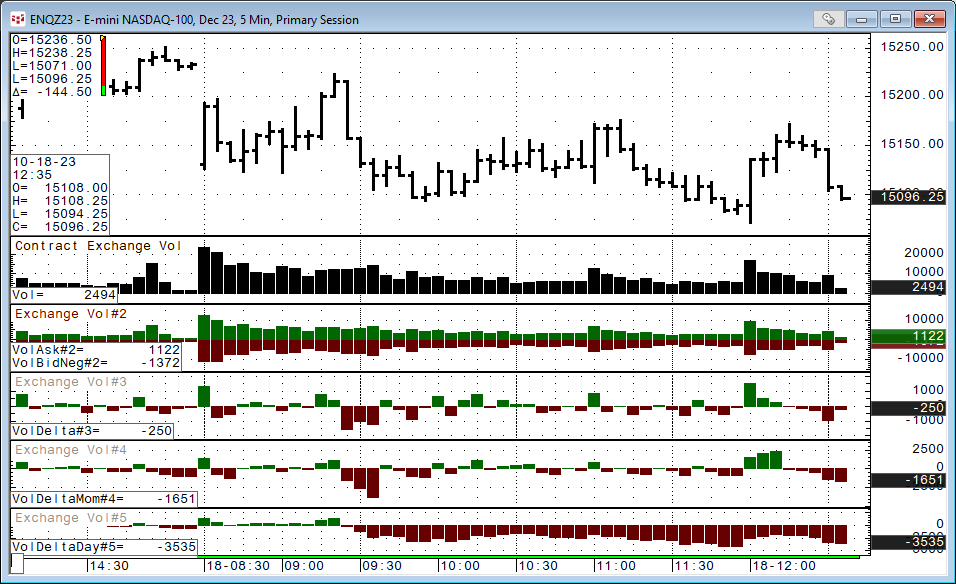
There are a number of volume-based studies available to customers using CQG IC or QTrader. This post walks you through the basic details of the various studies, then correlation analysis is… more
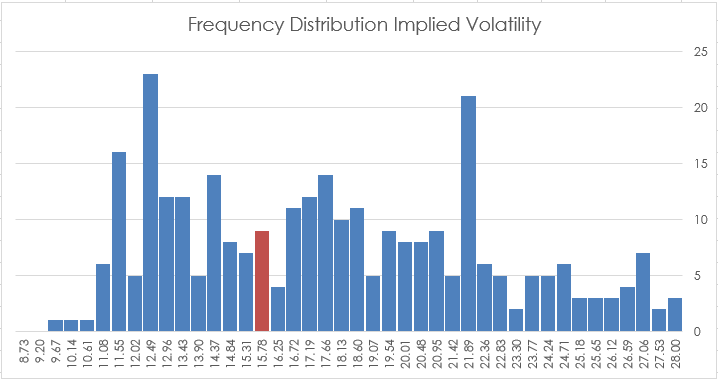
CQG IC and QTrader offer two studies that track volatility: Implied Volatility and Historical Volatility. This post details each study and provides an Excel spreadsheet for tracking the two.
… more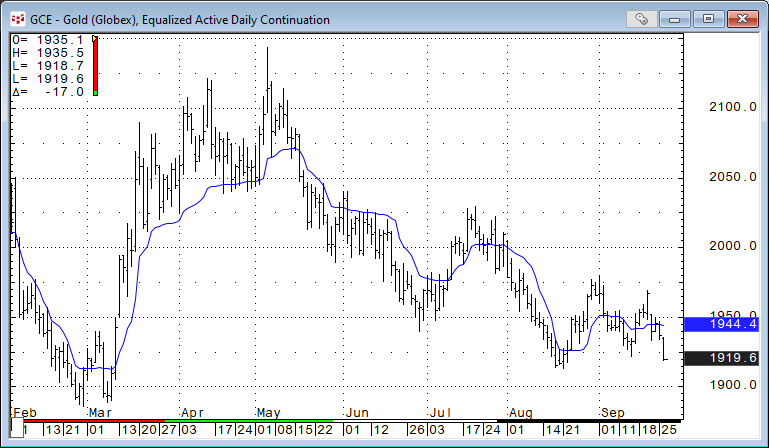
The Adaptive Moving Average (AMA) was developed by American quantitative financial analyst and author Perry J. Kaufman. The AMA study is like the exponential moving average (EMA), except the AMA… more
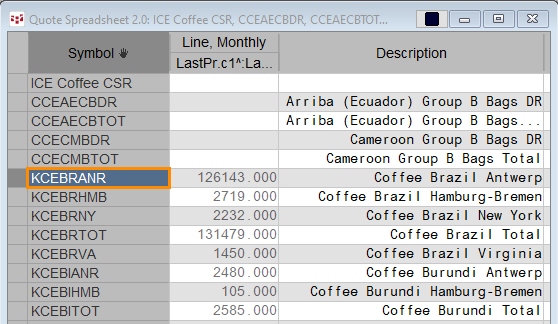
Certified stocks are bags of coffee that have been graded by the ICE exchange by ICE approved graders and are warehoused in exchange approved warehouses around the world. ICE reports the current… more