Updated 06/30/2026 to add ALPHABET CL A CMN (Symbol: S.GOOGL) and remove Verizon Communications (Symbol: S.VZ)
This Microsoft Excel® spreadsheet tracks the constituents of the DJIA Index (… more
Updated 06/30/2026 to add ALPHABET CL A CMN (Symbol: S.GOOGL) and remove Verizon Communications (Symbol: S.VZ)
This Microsoft Excel® spreadsheet tracks the constituents of the DJIA Index (… more
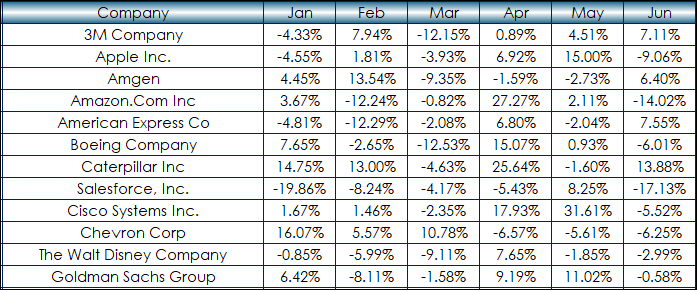
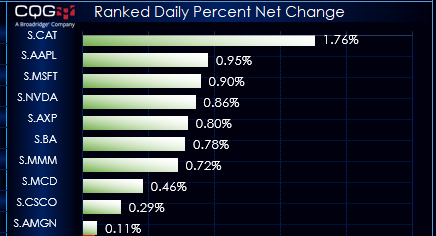
This post details using a nested XLOOKUP function to pull data from a matrix. The matrix displays the monthly percentage net change using a column for the symbols and a row for the months. The RTD… more
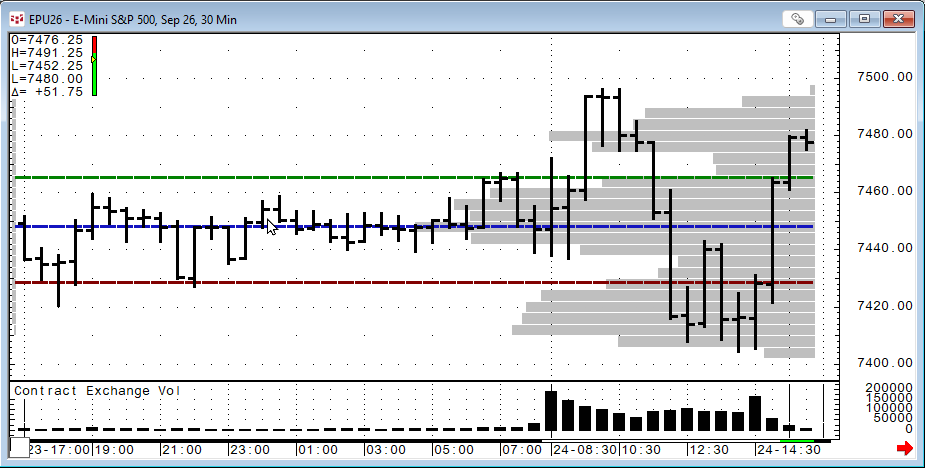
This post details the Market Profile Value Areas (MPVA) study, as well as providing a downloadable Excel sample for pulling MPVA study data into a spreadsheet.
When applied to a chart, the… more
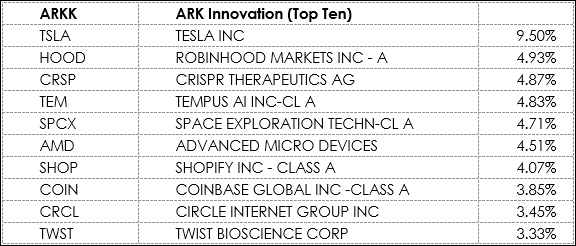
On Workspaces there are four Excel Dashboard for tracking the current session’s performance of four ARK ETFs. The four ETFs added the recent SpaceX IPO: Space Exploration Technologies Corp. Class… more
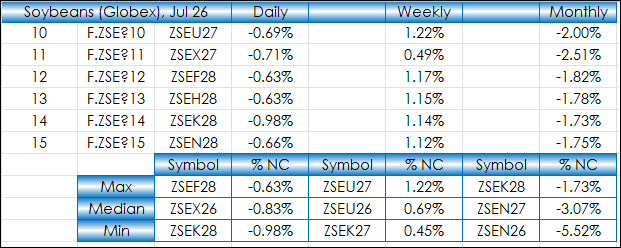
This post walks through using Excel's XLOOKUP with Min, Median, and Max Functions to create a summary table of market performance for the forward curves of Soybeans, Soybean Meal, Soybean Oil,… more
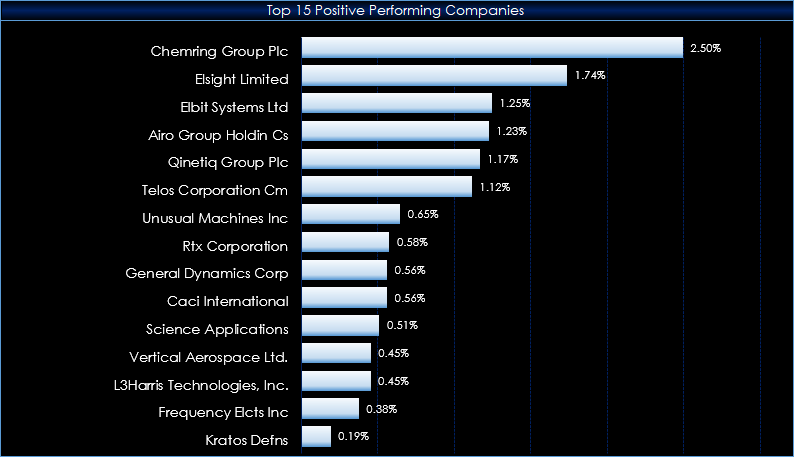
This Excel Dashboard tracks the holdings of the Defiance Drone & Modern Warfare ETF.
From their Web Site:
Modern defense is being reshaped by drones, autonomous systems, and AI-… more
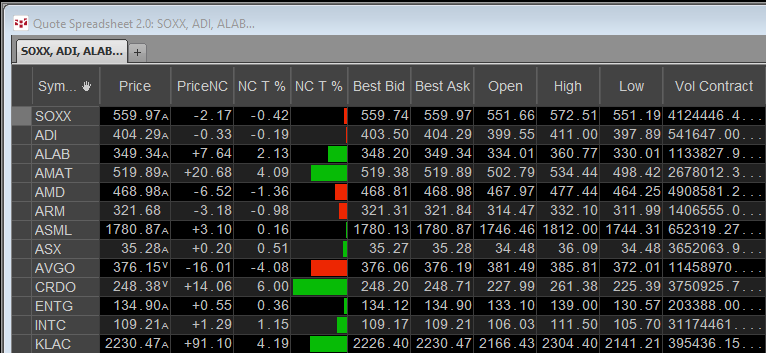
From their website:
The iShares Semiconductor ETF seeks to track an U.S. equity index of companies in the semiconductor sector. The fund offers a way to invest in companies across the… more
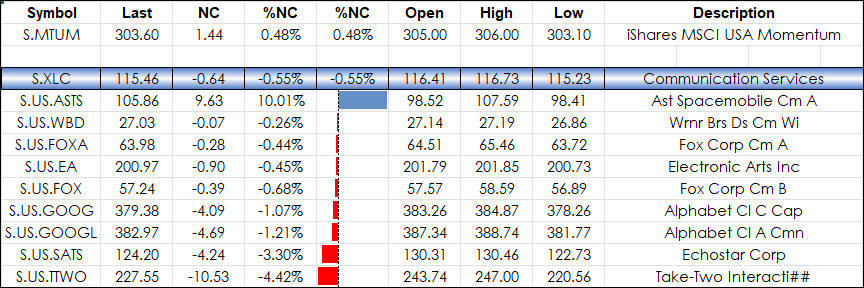
This post offers a sample spreadsheet with typical RTD formulas used for building a market quotes dashboard. You can download the dashboard and enter in symbols. All capital letters are required.… more
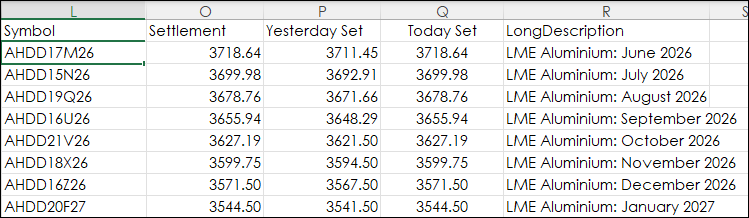
The London Metal Exchange (LME) is the world center for the trading of industrial metals. The majority of non-ferrous metal futures business is transacted on the LME platforms.
The LME… more
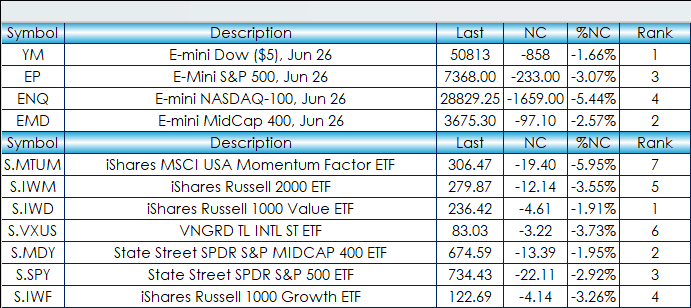
From the iShares website:
The iShares MSCI USA Momentum Factor ETF (Symbol: MTUM) seeks to track an index of U.S. stocks exhibiting relatively high price momentum. The fund offers a way to… more