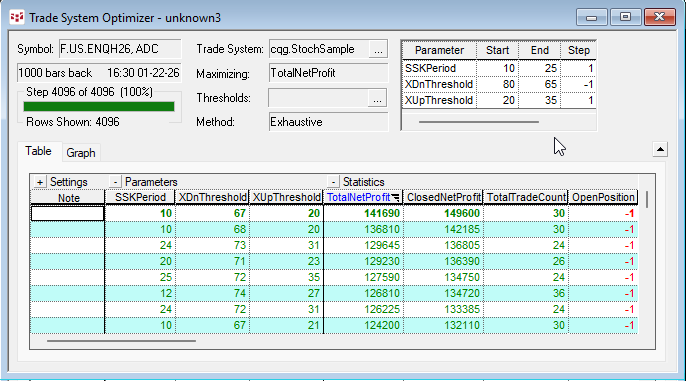
The CQG Trade System Optimizer (TSO) is a module that offers you a tool for testing different parameters of a trade systems and cataloging the results. All combinations of the parameters are… more
Workspaces
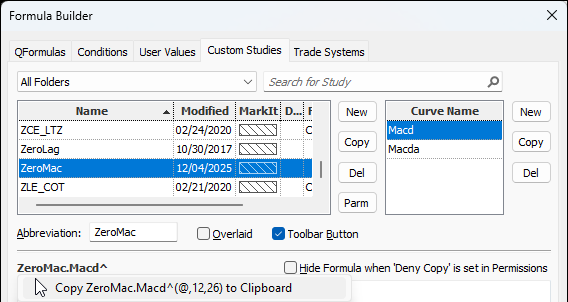
This post details the steps to pulling custom study values into Excel using RTD formulas. First, an overview of RTD formulas and parameters.
When CQG IC or QTrader are installed, a DLL… more
John Ehlers developed the Ultimate Smoother study. https://www.mesasoftware.com/TechnicalArticles.htm The study is a two-pole low-pass digital filter designed to smooth price data while… more
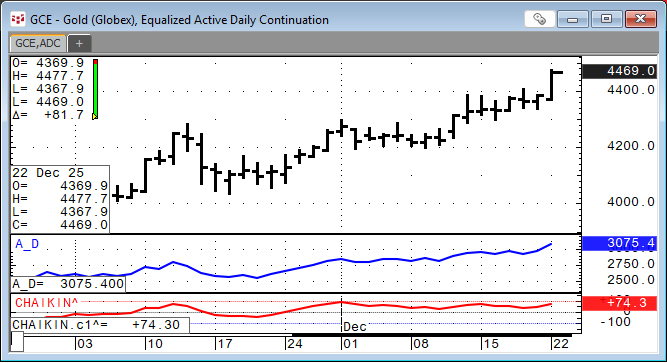
Developed by Marc Chaikin, the Chaikin Oscillator is a technical analysis tool traders and investors use to confirm trends and indicate possible trend reversals. The oscillator uses the… more
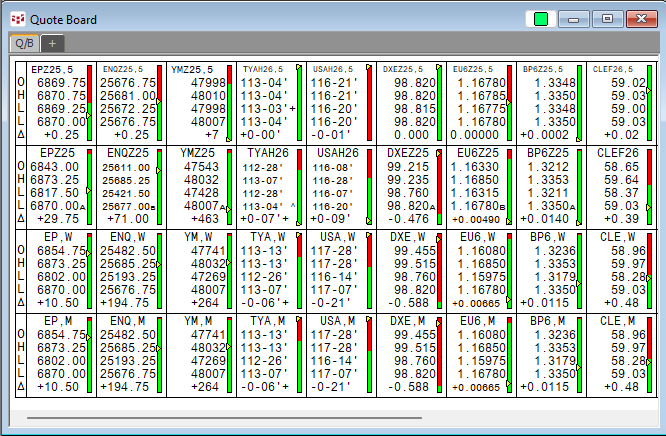
The CQG Quote Board is a classic quote display providing the open, high, low, last, and net change from the prior close.
One feature unique to the CQG Quote Board is a symbol entered… more
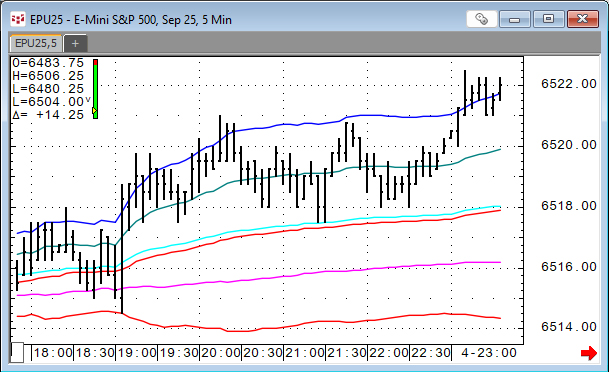
VWAP is the volume weighted average price for a futures contract plotted as a line on the price chart. The calculation is the sum of traded volume times the price divided by the sum of the traded… more
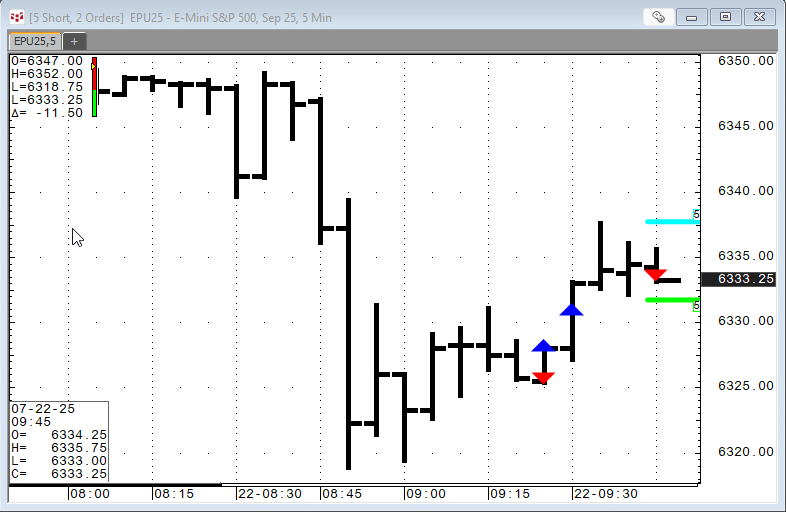
This set of studies provides the Order Display study (indications on a chart for filled and working orders), open trade equity, current position, and profit and loss account… more
This function is available in the Add Study window and in the Formula Toolbox.
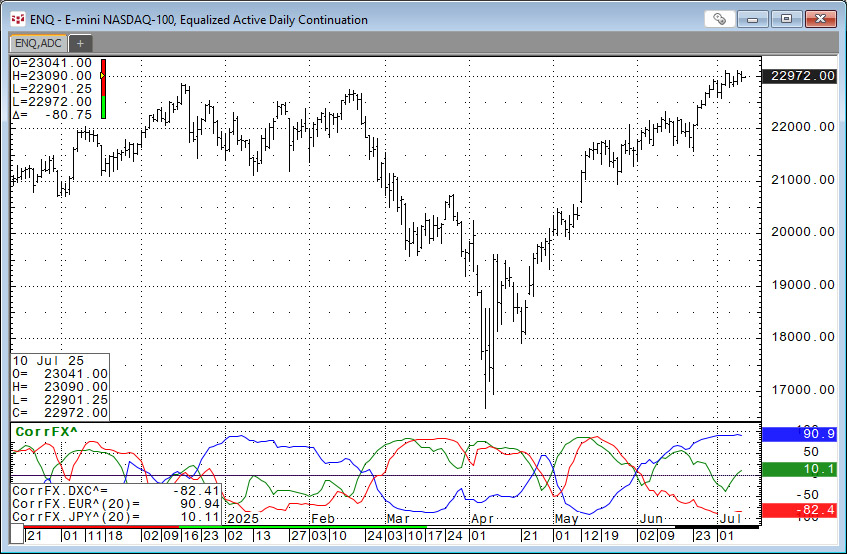
The function measures the strength and direction of the price movement of two symbols over a defined number of… more
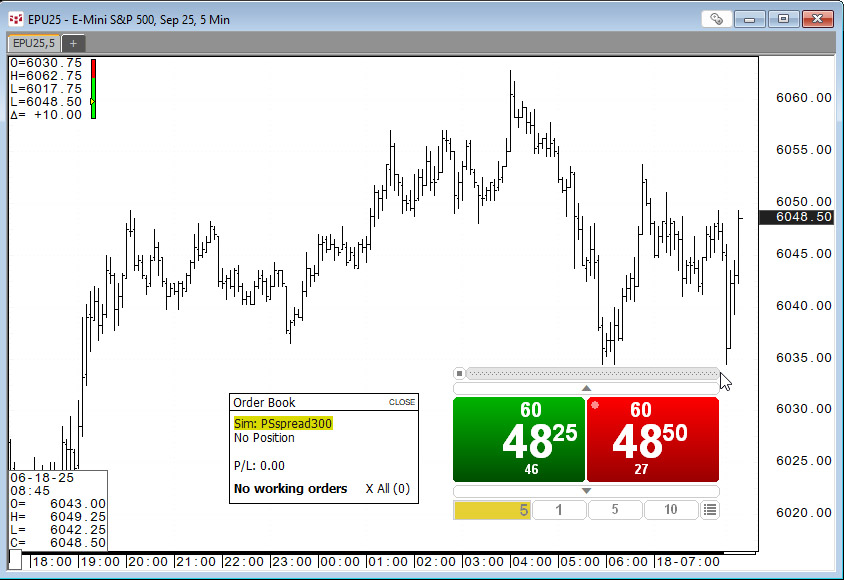
For those who trade based on the price action unfolding on a chart the appropriate trade routing interface is the SnapTrader 2, the topic of this post.
Below, the SnapTrader 2 (horizontal… more
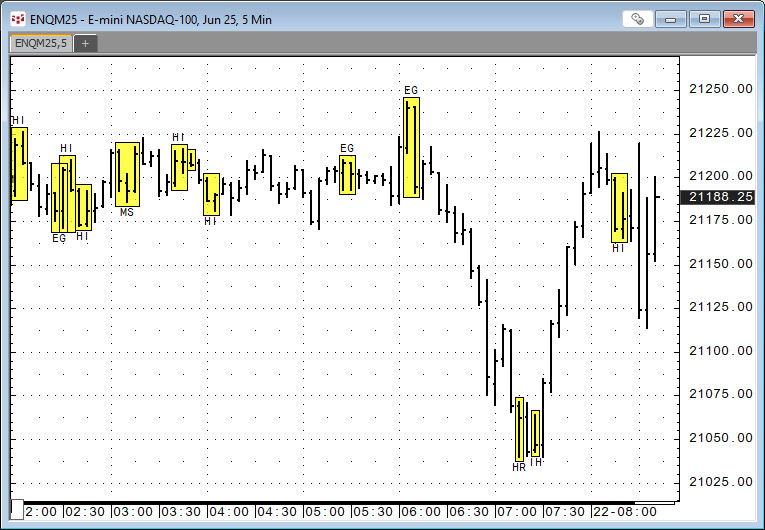
CQG IC and QTrader offer the Candlestick Formations study.
The Candlestick Formations study is a collection of conditions. Candlestick formations appear as overlays on the chart in the… more
