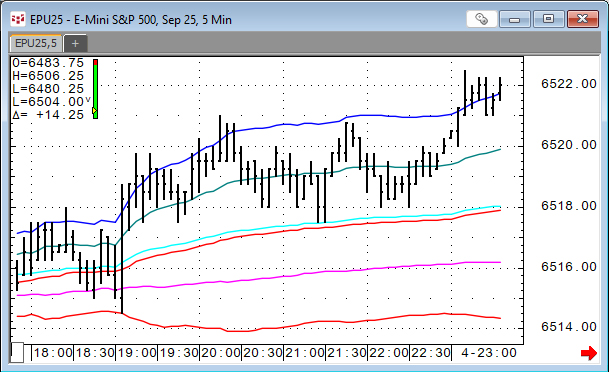
VWAP is the volume weighted average price for a futures contract plotted as a line on the price chart. The calculation is the sum of traded volume times the price divided by the sum of the traded… more
Workspaces
Trading Studies
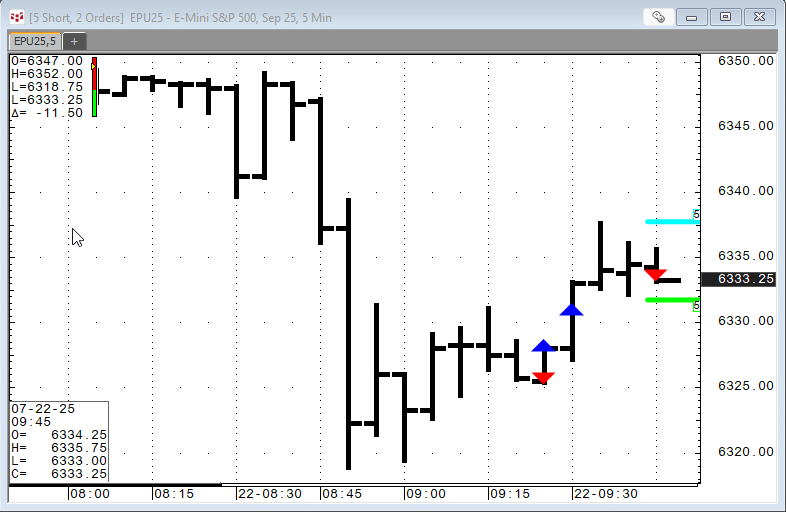
This set of studies provides the Order Display study (indications on a chart for filled and working orders), open trade equity, current position, and profit and loss account… more
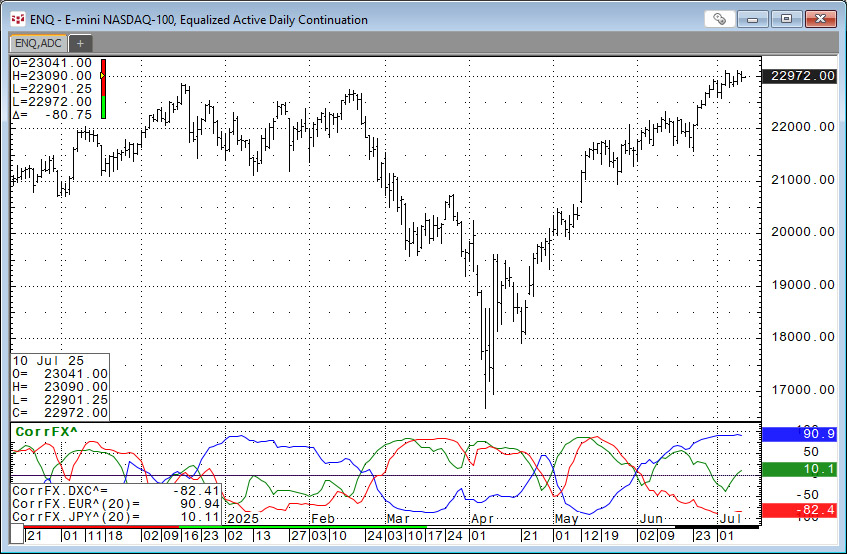
This function is available in the Add Study window and in the Formula Toolbox.
The function measures the strength and direction of the price movement of two symbols over a defined number of… more
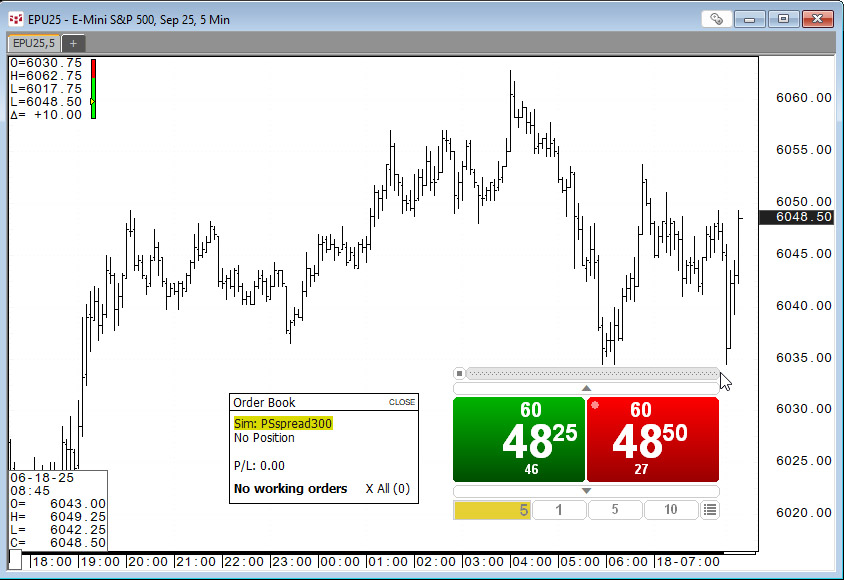
For those who trade based on the price action unfolding on a chart the appropriate trade routing interface is the SnapTrader 2, the topic of this post.
Below, the SnapTrader 2 (horizontal… more
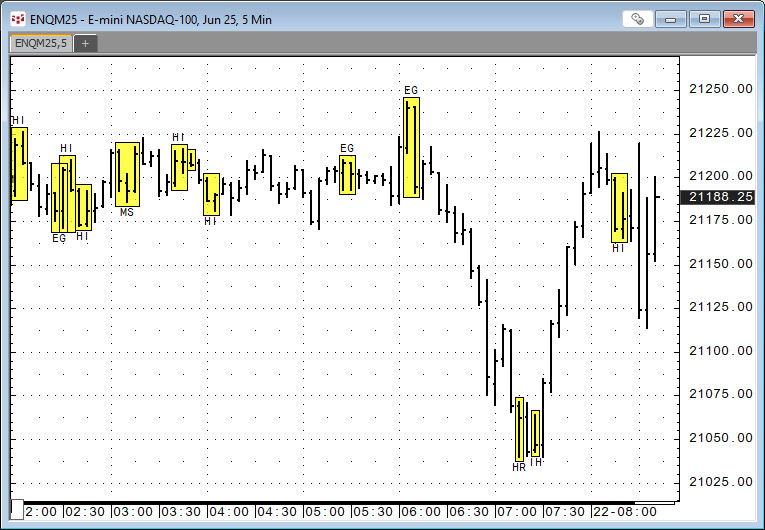
CQG IC and QTrader offer the Candlestick Formations study.
The Candlestick Formations study is a collection of conditions. Candlestick formations appear as overlays on the chart in the… more
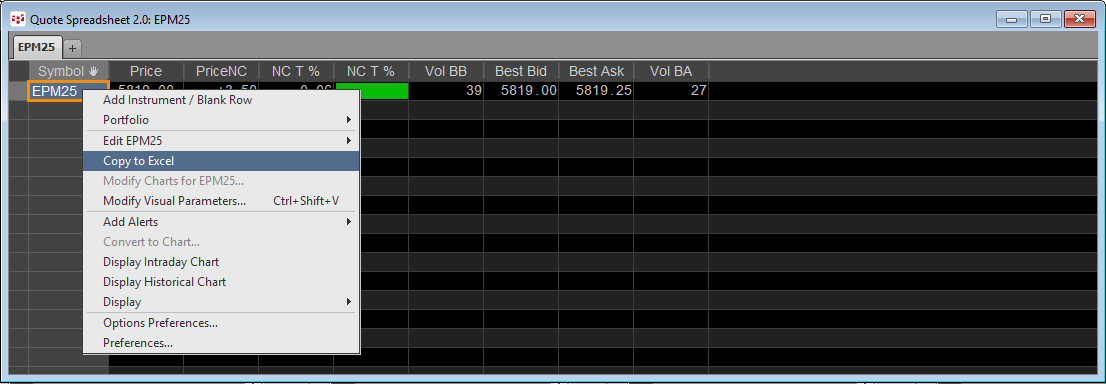
This post details the different techniques for pulling Depth-of-Market (DOM) data into Excel.
There are three ways:
C&P RTD formulas for Level 1 DOM data from the various quote… more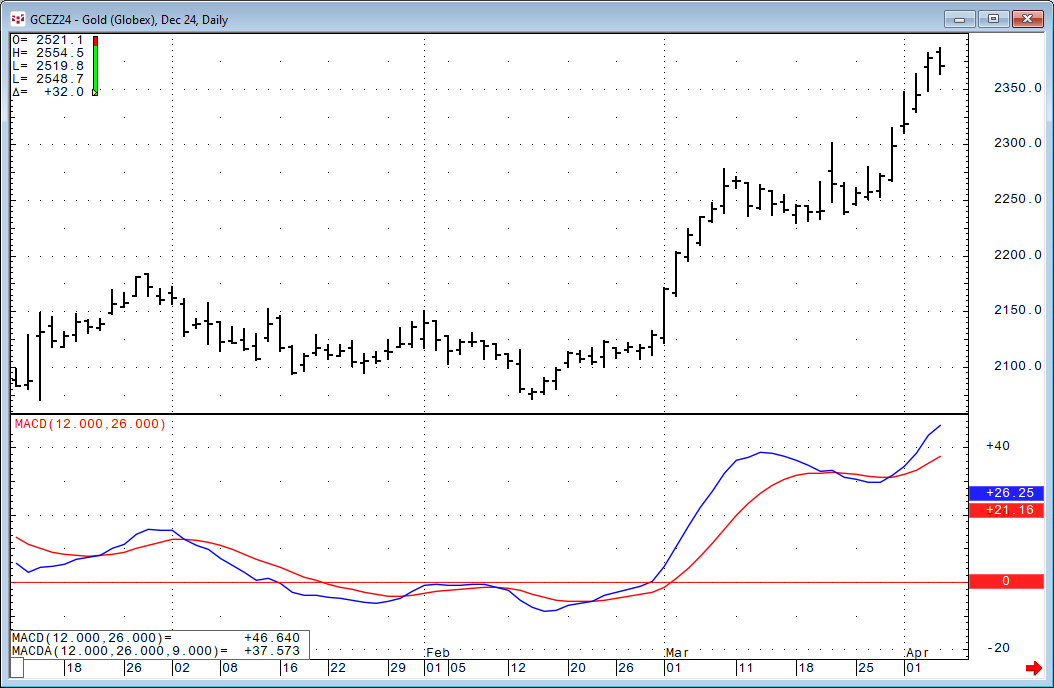
The Moving Average Convergence/Divergence indicator (MACD) was invented by Gerald Appel over 40 years ago. The study is an unbounded oscillator with two lines: MACD and MACDA.
MACD =… more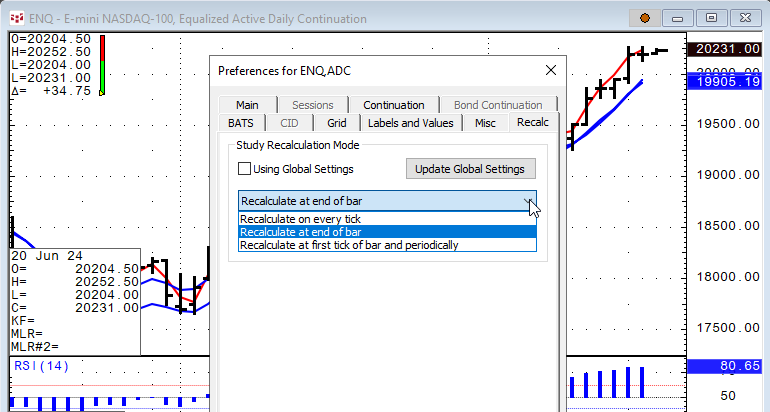
CQG IC and QTrader offer the ability to set recalculation rates for studies. In addition, RTD study formulas have a recalculation rate parameter.
In CQG select a chart and then Setup/Chart… more
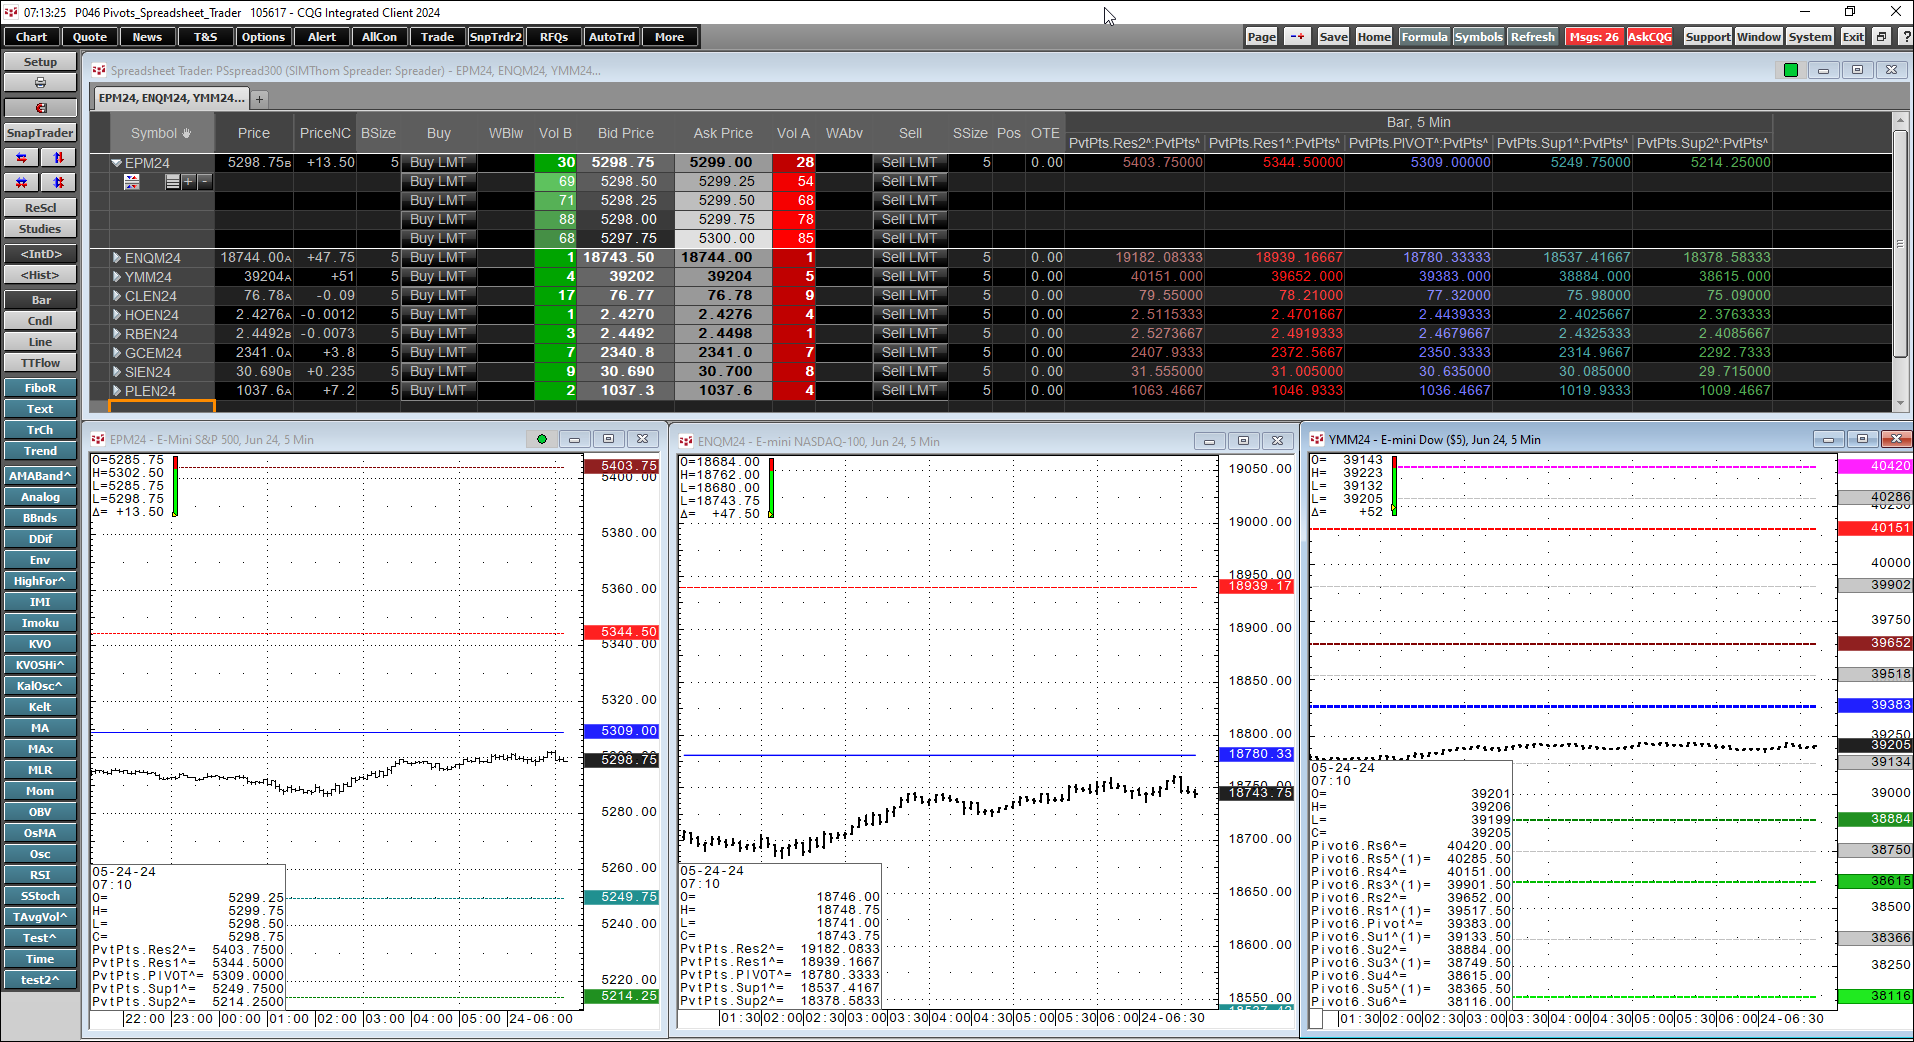
The pivot point is the arithmetic average of the high (H), low (L), and closing (C) prices of the active instrument, Pivot Point = (H+L+C)/3 or Pivot Point = HLC3. The study applied to a chart… more
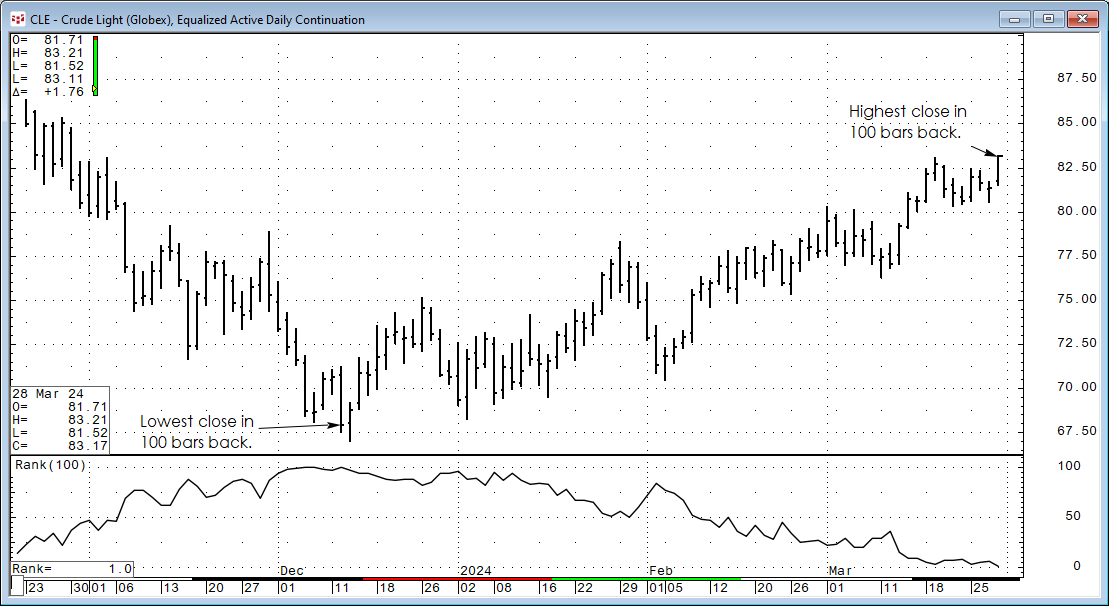
The CQG Rank Study ranks the individual chart points of a market over a specified number of previous trading periods. For example, if the current bar's close had a rank of 3, and the periods were… more