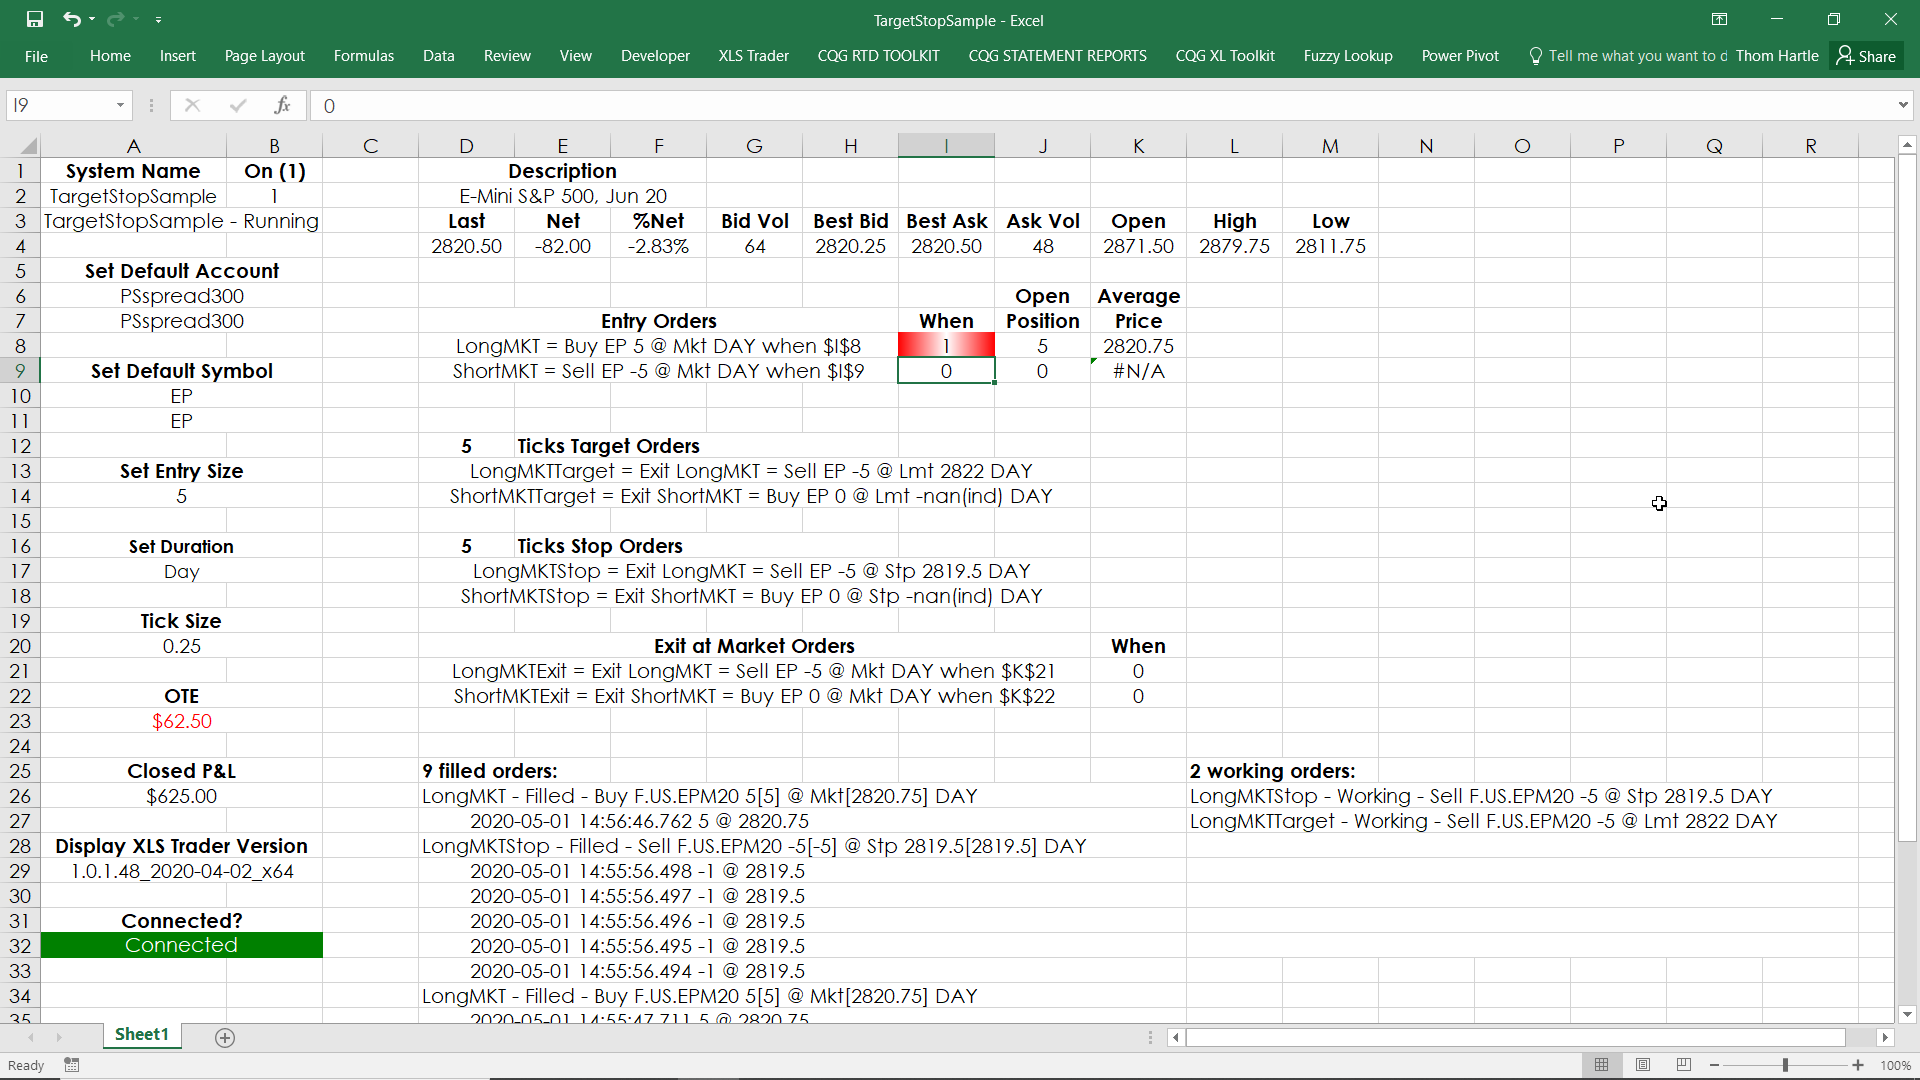
This sample XLS Trader worksheet uses market orders to enter into positions. When filled, XLS Trader will automatically enter in a target and a stop order, which are OCO orders (one cancels the… more
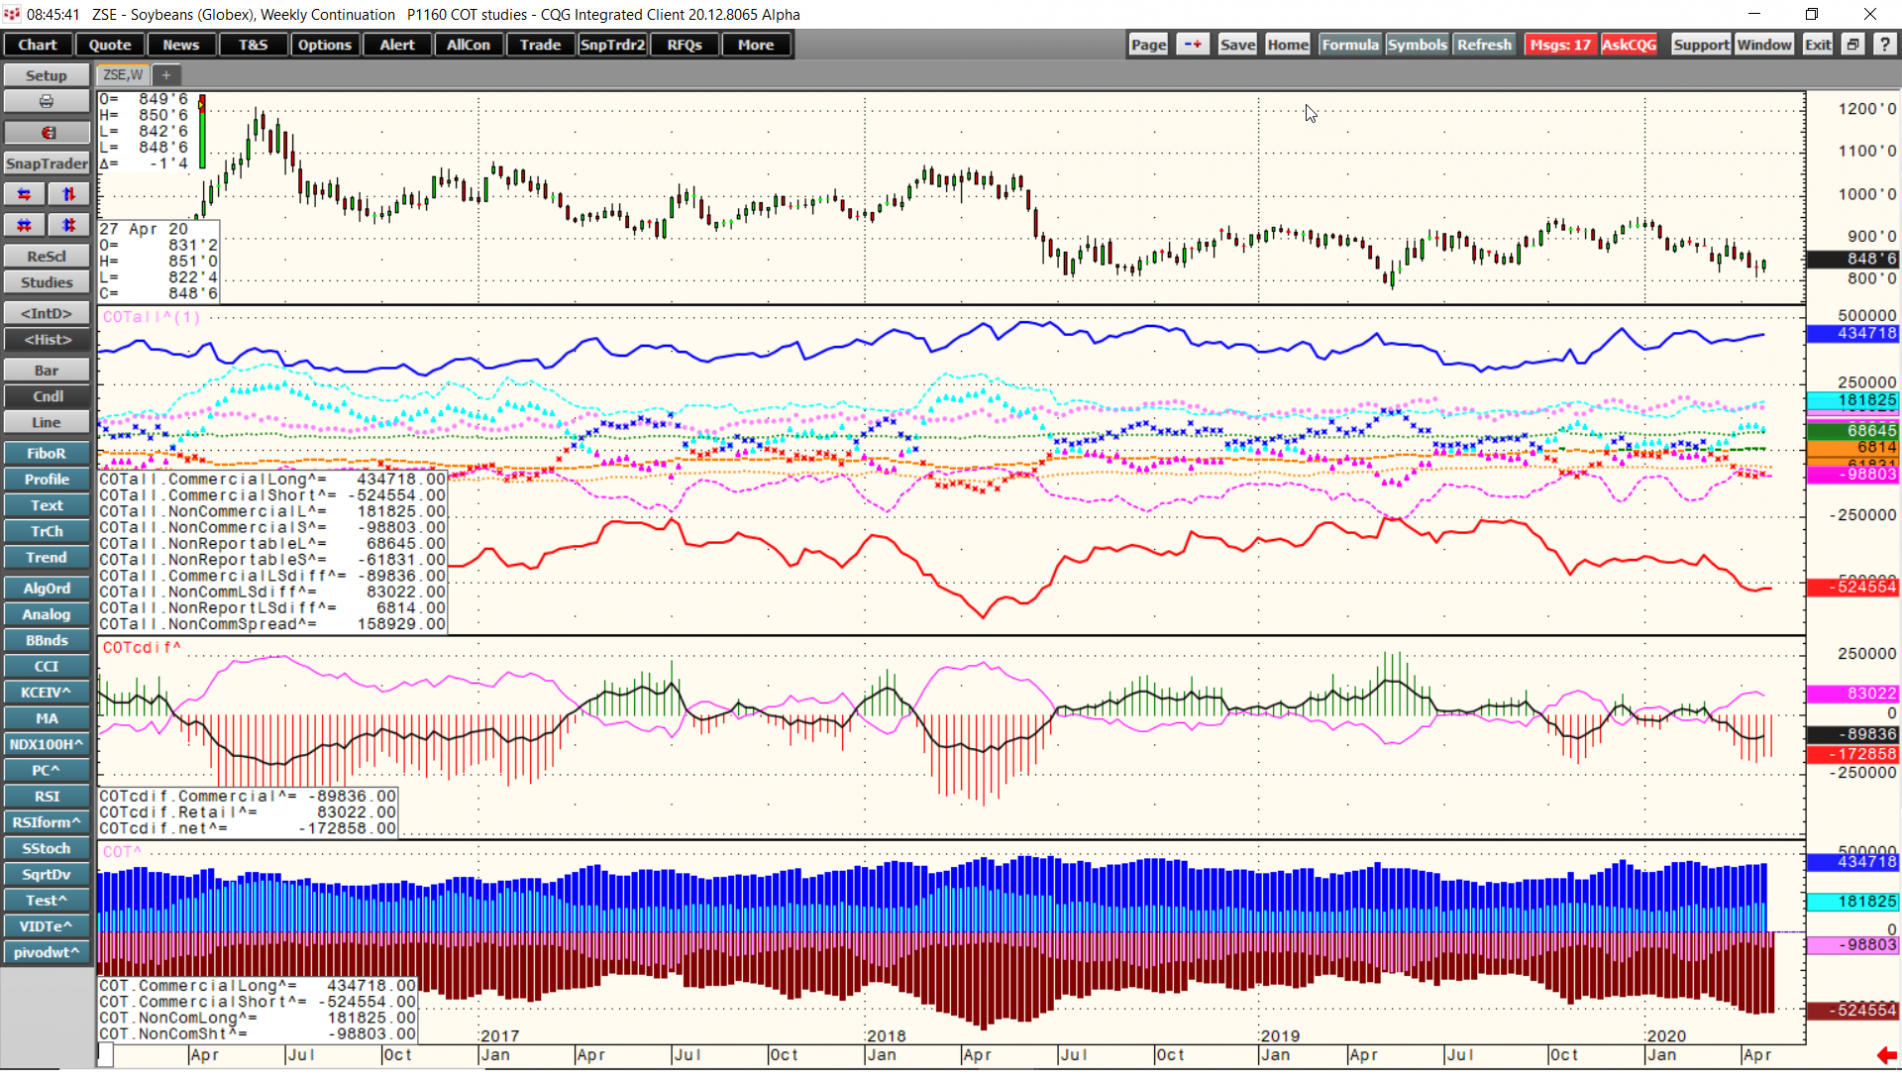
CQG Product Specialist Jim Stavros has created a downloadable CQG PAC that has three new CFTC COT Studies designed to aid in analysis of the COT reports: COTAll, COTcDiff and COT.
COTAll… more
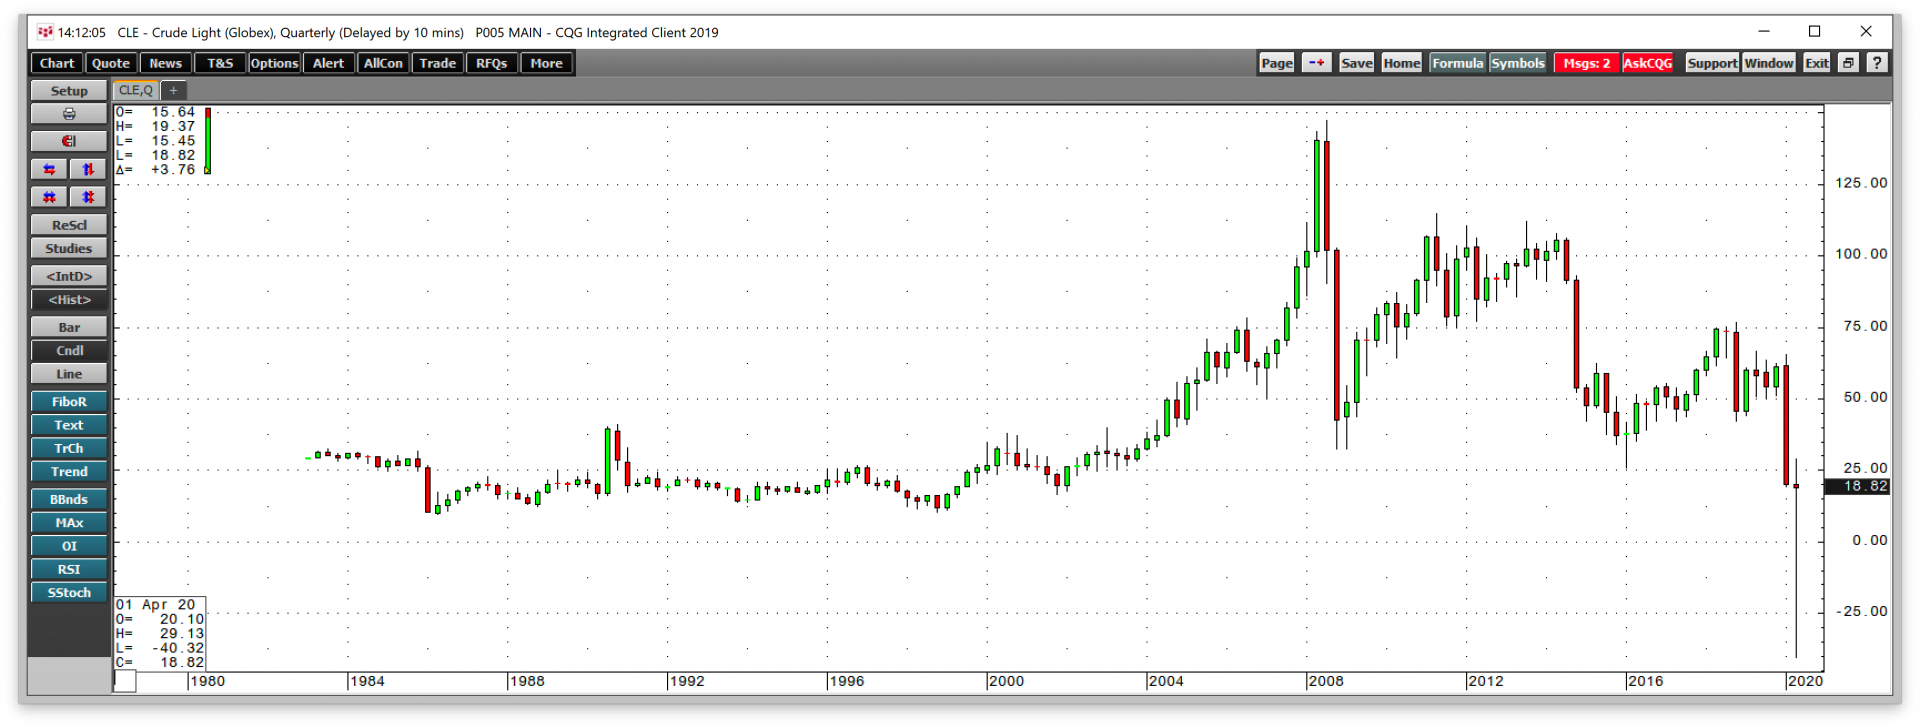
April 2020 will go down in history as the month that the price of crude oil fell to a low that most market participants did not believe possible. West Texas Intermediate crude oil began trading on… more
XLS Trader offers CQG Integrated Client customers the ability to route and manage orders directly from Microsoft Excel®. Now, you can create models within Excel that can be the basis for… more
Develop insights into the trends of the commodities markets through Fundamental Analytics, a futures industry research platform that integrates fundamental and technical analysis.
Access… more
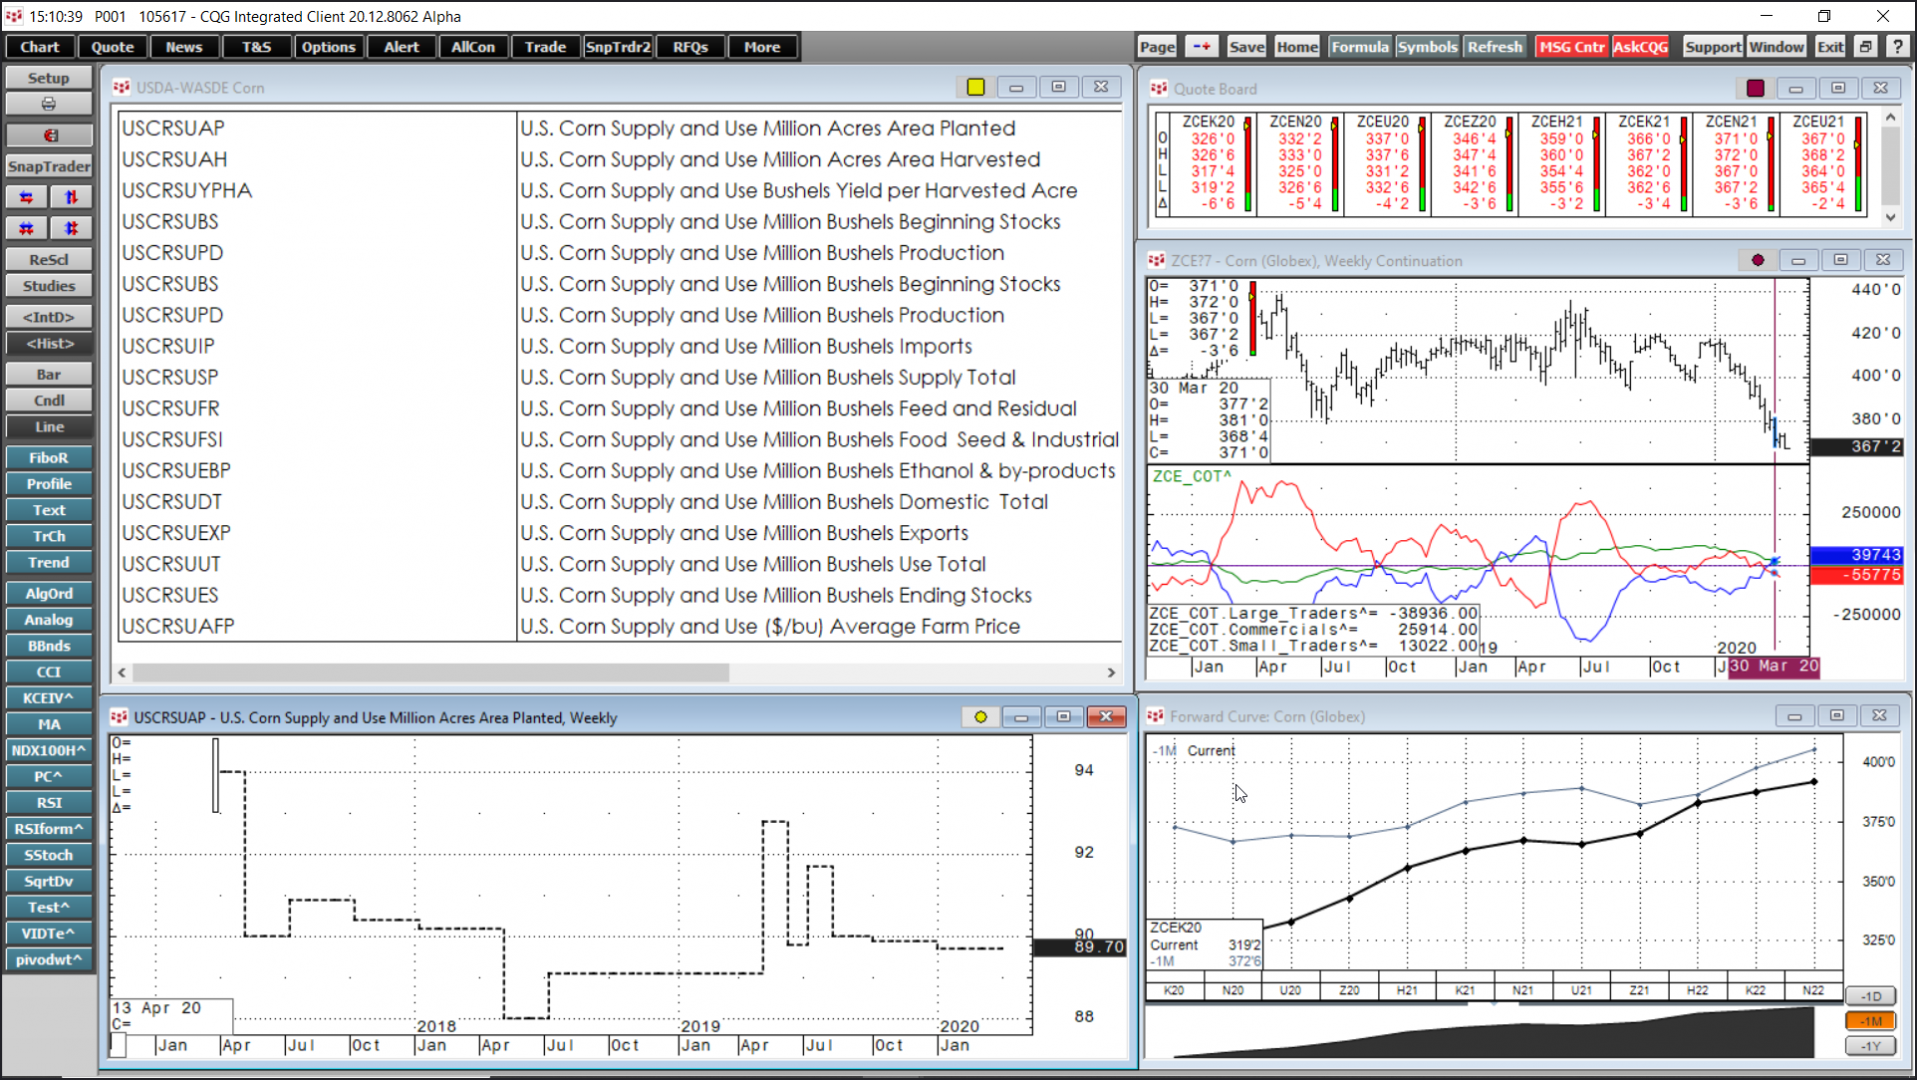
USDA, USDA – WASDE, and CFTC COT data is now available and fully integrated into the industry's best charting and trading front end: CQG Integrated Client
Gain insight into ag markets and… more
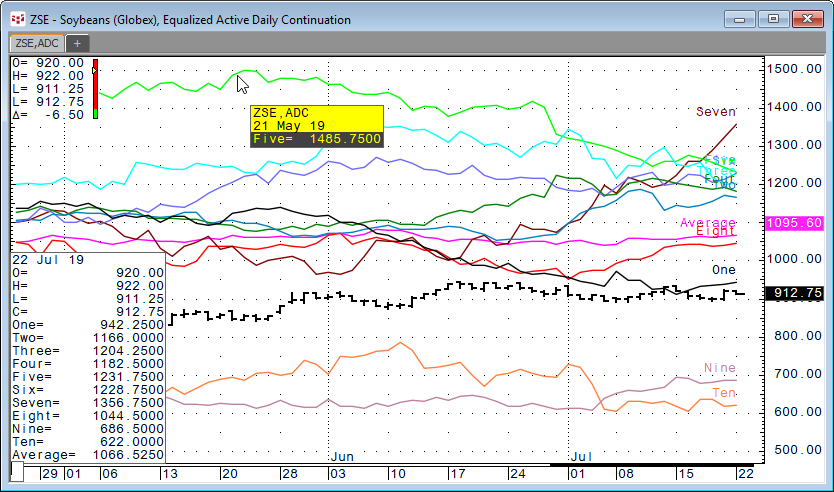
A long awaited feature is finally here on CQG! The Seasonal Study. Easily visualize seasonal price action and compare the current year to ten previous years of bar data. Perfect for traders… more
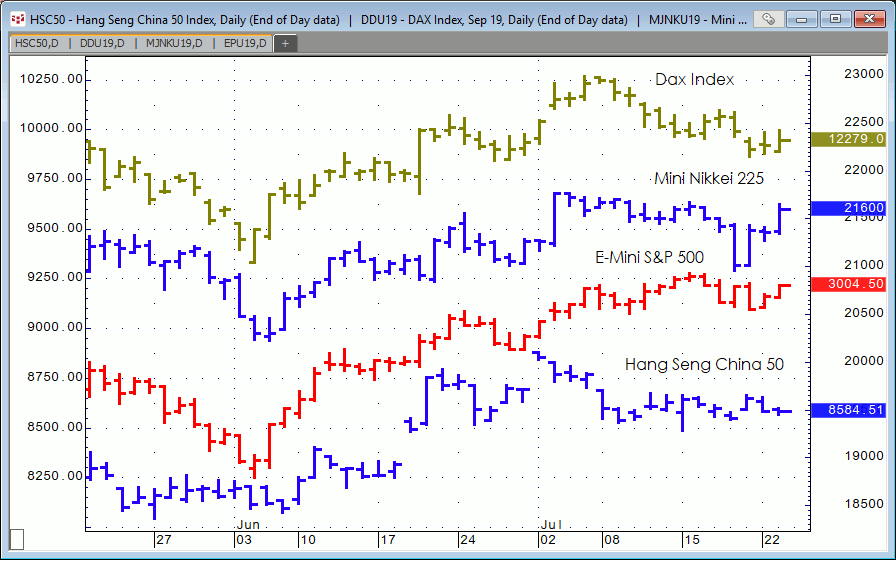
End-of-day data for global markets now included CQG continues to bring value with global end-of-day data now included as part of the standard subscription service.
Now, you can access end-… more
USDA, USDA – WASDE, and CFTC COT data is now available and fully integrated into the industry's best charting and trading front end: CQG Integrated Client
Gain insight into ag markets and… more
A long awaited feature is finally here on CQG! The Seasonal Study. Easily visualize seasonal price action and compare the current year to ten previous years of bar data. Perfect for traders… more
