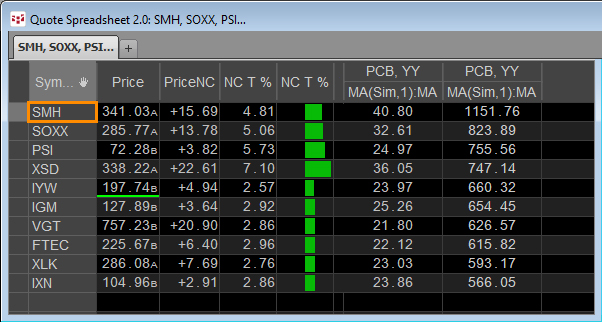
This post provides 10-year analysis of the most profitable Exchange Traded Funds (ETFs) offered on the US Exchanges. At the end of the post is a downloadable CQG PAC for installing a page in CQG… more
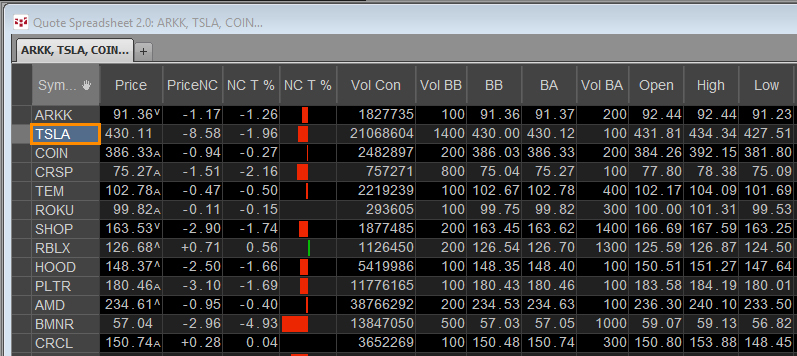
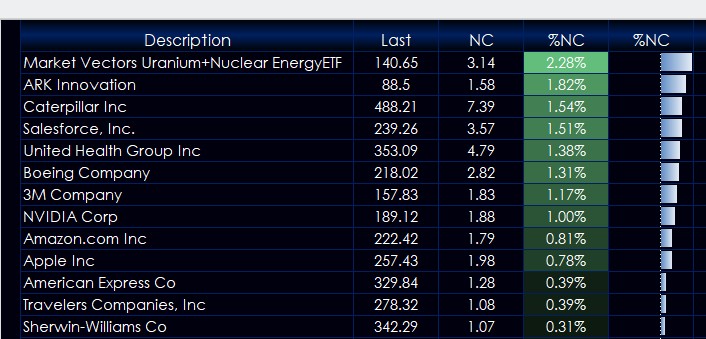
This post supplies a downloadable CQG PAC for installing a page tracking the holdings (as of 10/7/2025) of ARK Innovations ETF in CQG IC or QTrader.
From their website:
Fund Objective… more
Midweek, the OSE 10 Year JGB, Dec 25 contract is down -0.15%. The best performer in the US market is the 2yr US Treasury Note (Globex), Dec 25 contract, which is down -0.03%. The best… more
This midweek look shows the Nikkei 225 (Osaka), Dec 25 contract with a +4.77% gain. The best performer in the US market is the E-mini NASDAQ-100, Dec 25 contract showing a gain of +1.35%.… more
Each Wednesday this article will be updated with the current seasonal study using CQG's Seasonal analysis applied to the Soybean, Wheat and Corn markets. You can download the CQG pac providing the… more
This post builds upon the previous post: Excel 365 TRIMRANGE Function.
That post detailed how to build a quote display using the TRIMRANGE function to automatically manage working with… more
Microsoft Excel 365 offers the TRIMRANGE function which excludes all empty rows and/or columns from the outer edges of a range or array. This post details how this function is useful for designing… more
This midweek look shows the Nikkei 225 (Osaka), Dec 25 contract with a -0.55% loss. The best performer in the US market is the E-mini NASDAQ-100, Dec 25 contract showing a gain of +1.11%.… more
Midweek, the OSE 10 Year JGB, Dec 25 contract is up 0.01%. The best performer in the US market is the 30yr US Treasury Bond (Globex), Dec 25 contract, which is up 0.81%. The best performer… more
Each Wednesday this article will be updated with the current seasonal study using CQG's Seasonal analysis applied to the Soybean, Wheat and Corn markets. You can download the CQG pac providing the… more
