I trade daily. I traded Over-The-Counter options in the '60s. I have traded US Stock Index futures since the day they started in 1982. I was there in October 1987 when we experienced the 500-point single day decline known as Black Monday. In fact, I predicted that it would happen. Black Monday was our first memorable flash crash since 1929, but it would not be our last. I was in Asia in 1997 when both currency markets and equity markets took their dramatic fall and saw firsthand what it did to society. I traded the open after 9/11.
Then, in May of 2010, we experienced the debacle of a 1000-point decline in a matter of hours. Since that event, we have had numerous flash crashes in a variety of stocks. Regulatory agencies have spent months trying to figure out what went wrong. Countless interviews with endless numbers of experts pouring over reams of trade data continue to this day with little definitive to show. None of this market activity, however, is a surprise to those who understand markets from the bottom up. I am talking about market mechanics: the nuts and bolts of market activity, the bid, the ask, and the size. All of these crashes have one common cause: illiquidity.
The problem today, whether it is the US, China, or Europe, is that regulators, who do not understand market action, make a situation where regulation is dearly needed worse either by inappropriate regulation or inadequate regulation. Liquidity is the problem, and wide market participation is the answer.
My observation of illiquidity in the S&P futures pit in mid-September of 1986 allowed me to forecast the 500-point single day break that happened in October of 1987. It was the lack of liquidity in a variety of Asian markets that brought those markets to their knees in 1997, due in part to the absence of legal short selling. It was, without doubt, the illiquid conditions, apparent from late 2008, that caused the meltdown known as the Flash Crash in May of 2010. Blatantly unfair market conditions exist with the onset of high frequency trading computers and the total lack of accountability in our current market structure. Is it any wonder that liquidity-providing humans are staying away?
These conditions persist and more crushing and debilitating market days will come as sure as night follows day. The emerging markets may be at even more risk than those of more mature status as contagion can spread across the world in microseconds.
Let's revisit 1986 where it became apparent to this trader that there would be a single day 500-point Dow decline. On the September 1986 day pictured below, the Dow suffered one of its biggest one-day losses to that point in time.
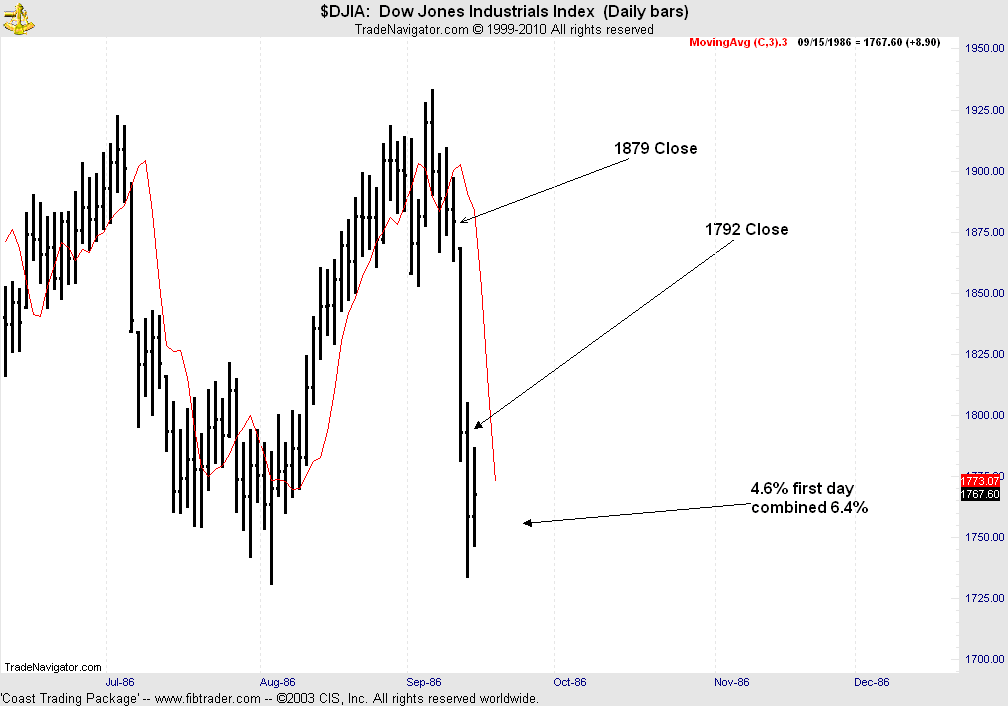
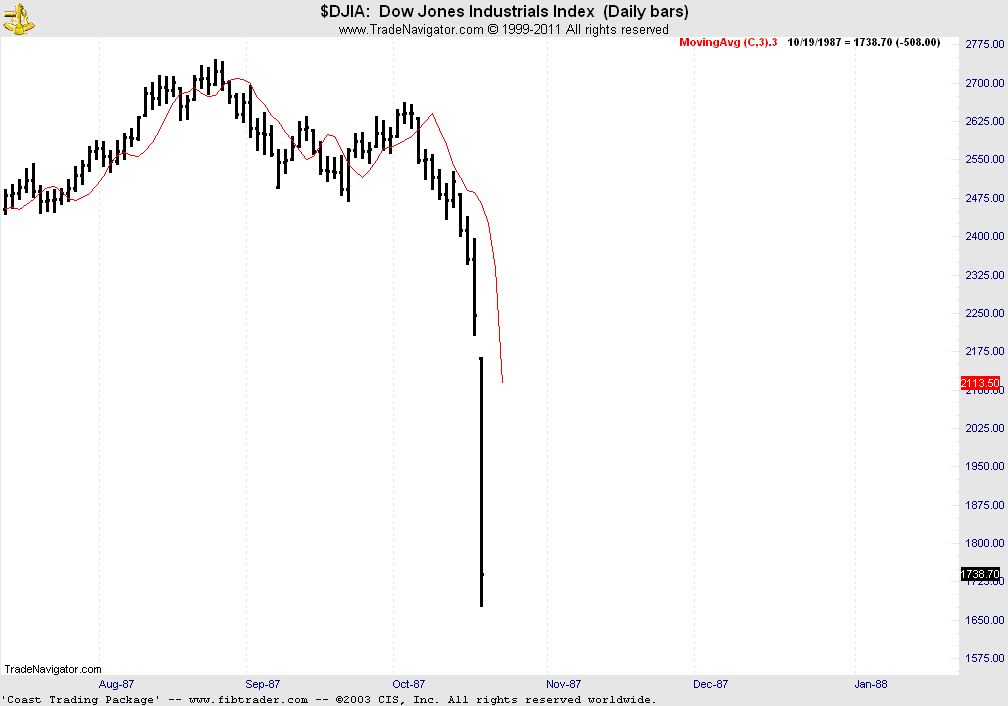
What is not shown, and what had to be experienced to be appreciated, was the S&P pit trading on the day in question. There was a complete dearth of bids in the market. Sellers were not filled at any reasonable levels and buyers were killed on the spot. It gave the term "trade execution" a whole new meaning. This was the day S&P locals (pit traders) learned to keep their hands in their pockets. The size of the S&P contract was one of the causes of this dramatic decline. There were no e-minis in 1986, and the contract could put even a well-heeled floor trader directly in front of an oncoming bus on South Wacker Drive if he were not careful. The public, although permitted to trade on fairly low margin requirements, had already learned that this thing was just too big to handle. Therefore, after this day in 1986, there was significantly less participation on big down days, resulting in classic illiquidity. When you trade for a living, you learn how to survive or you're gone. Black Monday, the 500-point single day Dow decline, was simply waiting to happen. The chart below shows the day that it did.
© Copyright Coast Investment Software, Inc. & Joe DiNapoli
Joe DiNapoli, president of Coast Investment Software, Inc., has forty years of market trading experience and has been a registered CTA for over twenty-five years. DiNapoli is a long-time CQG customer, and his Fibonacci-based indicators are available in the CQG Integrated Client. He delivered a presentation on this topic at the November 2010 Traders Expo in Las Vegas and for the CME at the ATIC event in Singapore in May 2011. This is part one of a two-part opinion piece. The unedited article in its entirety is available on DiNapoli's website.