What are the most potent candlestick signals? This is the question many investors ask when just learning about candlestick analysis. There are approximately 50 or 60 candlestick signals. But there are only 12 major signals of relevance, six longs, and six shorts. The '12 Major Signals' produce the strongest reversal indications. They are also the signals that occur the most often. This is a significant factor to remember. Once you learn the 12 Major Signals, you will start gaining control of your investment perspectives. The remaining 50 - 60 candlestick signals do not occur often enough to spend a lot of mental time and energy trying to learn what their results produce. The Japanese rice traders identified the graphics that illustrate when trend reversals are occurring. Where do most people buy? They buy exuberantly at the top! Where do most people sell? They panic sell at the bottom.
One of the most powerful candlestick reversal signals is the Kicker Signal. It produces a dramatic change in a price trend, illustrating a very strong reversal of investor sentiment. The sentiment has been kicked in the opposite direction. The candlestick investor gains a considerable advantage by recognizing the Kicker Signal. There is a very high probability of expected results when visually recognizing the signal.
There are three variations of the Kicker Signal. The Kicker Signal itself, the Trend Kicker signal, and the Flutter Kicker signal. They illustrate strong price move expectations both bullish and bearish.
Assume the majority of all investment decisions are based upon fundamental reasoning/research. Candlestick signals and patterns are developed based upon fundamentally influenced decision-making, the accumulative result of buying and selling during specific time frames. Candlestick analysis also utilizes technical analysis tools to confirm 'why' buying and selling are occurring at particular levels. Witnessing a candlestick 'buy' signal at a significant support level, such as a moving average or trend line, reveals where investment decisions are activated. Witnessing a candlestick sell signal at a resistance level dramatically improves the probability that the sellers are taking control.
Obviously, bullish candlestick stock prices will likely perform better when the market indexes are in an uptrend. Bearish stock prices will perform better when the market indexes show a downtrend. Candlestick analysis significantly improves an investor's ability to assess the direction of the general market indexes. Simple candlestick scanning techniques will identify which sectors show the most significant strength coinciding with the general market movements. The same simple scanning techniques can then determine which individual stock charts show the strongest signals and patterns in those sectors.
The Japanese rice traders utilized a straightforward logic. Witnessing a candlestick buy signal in the oversold area produced a high probability that an uptrend was starting. Witnessing a candlestick sell signal in the overbought area was producing a high probability that a downtrend was beginning. Witnessing a candlestick buy signal in the overbought area was not relevant. Witnessing a candlestick sell signal in the oversold area was not relevant.
However, witnessing a Kicker Signal demonstrates such a powerful change in investor sentiment that it does not matter where the signal occurs during a price trend. The strength of the signal reveals a movement in the direction of the signal.
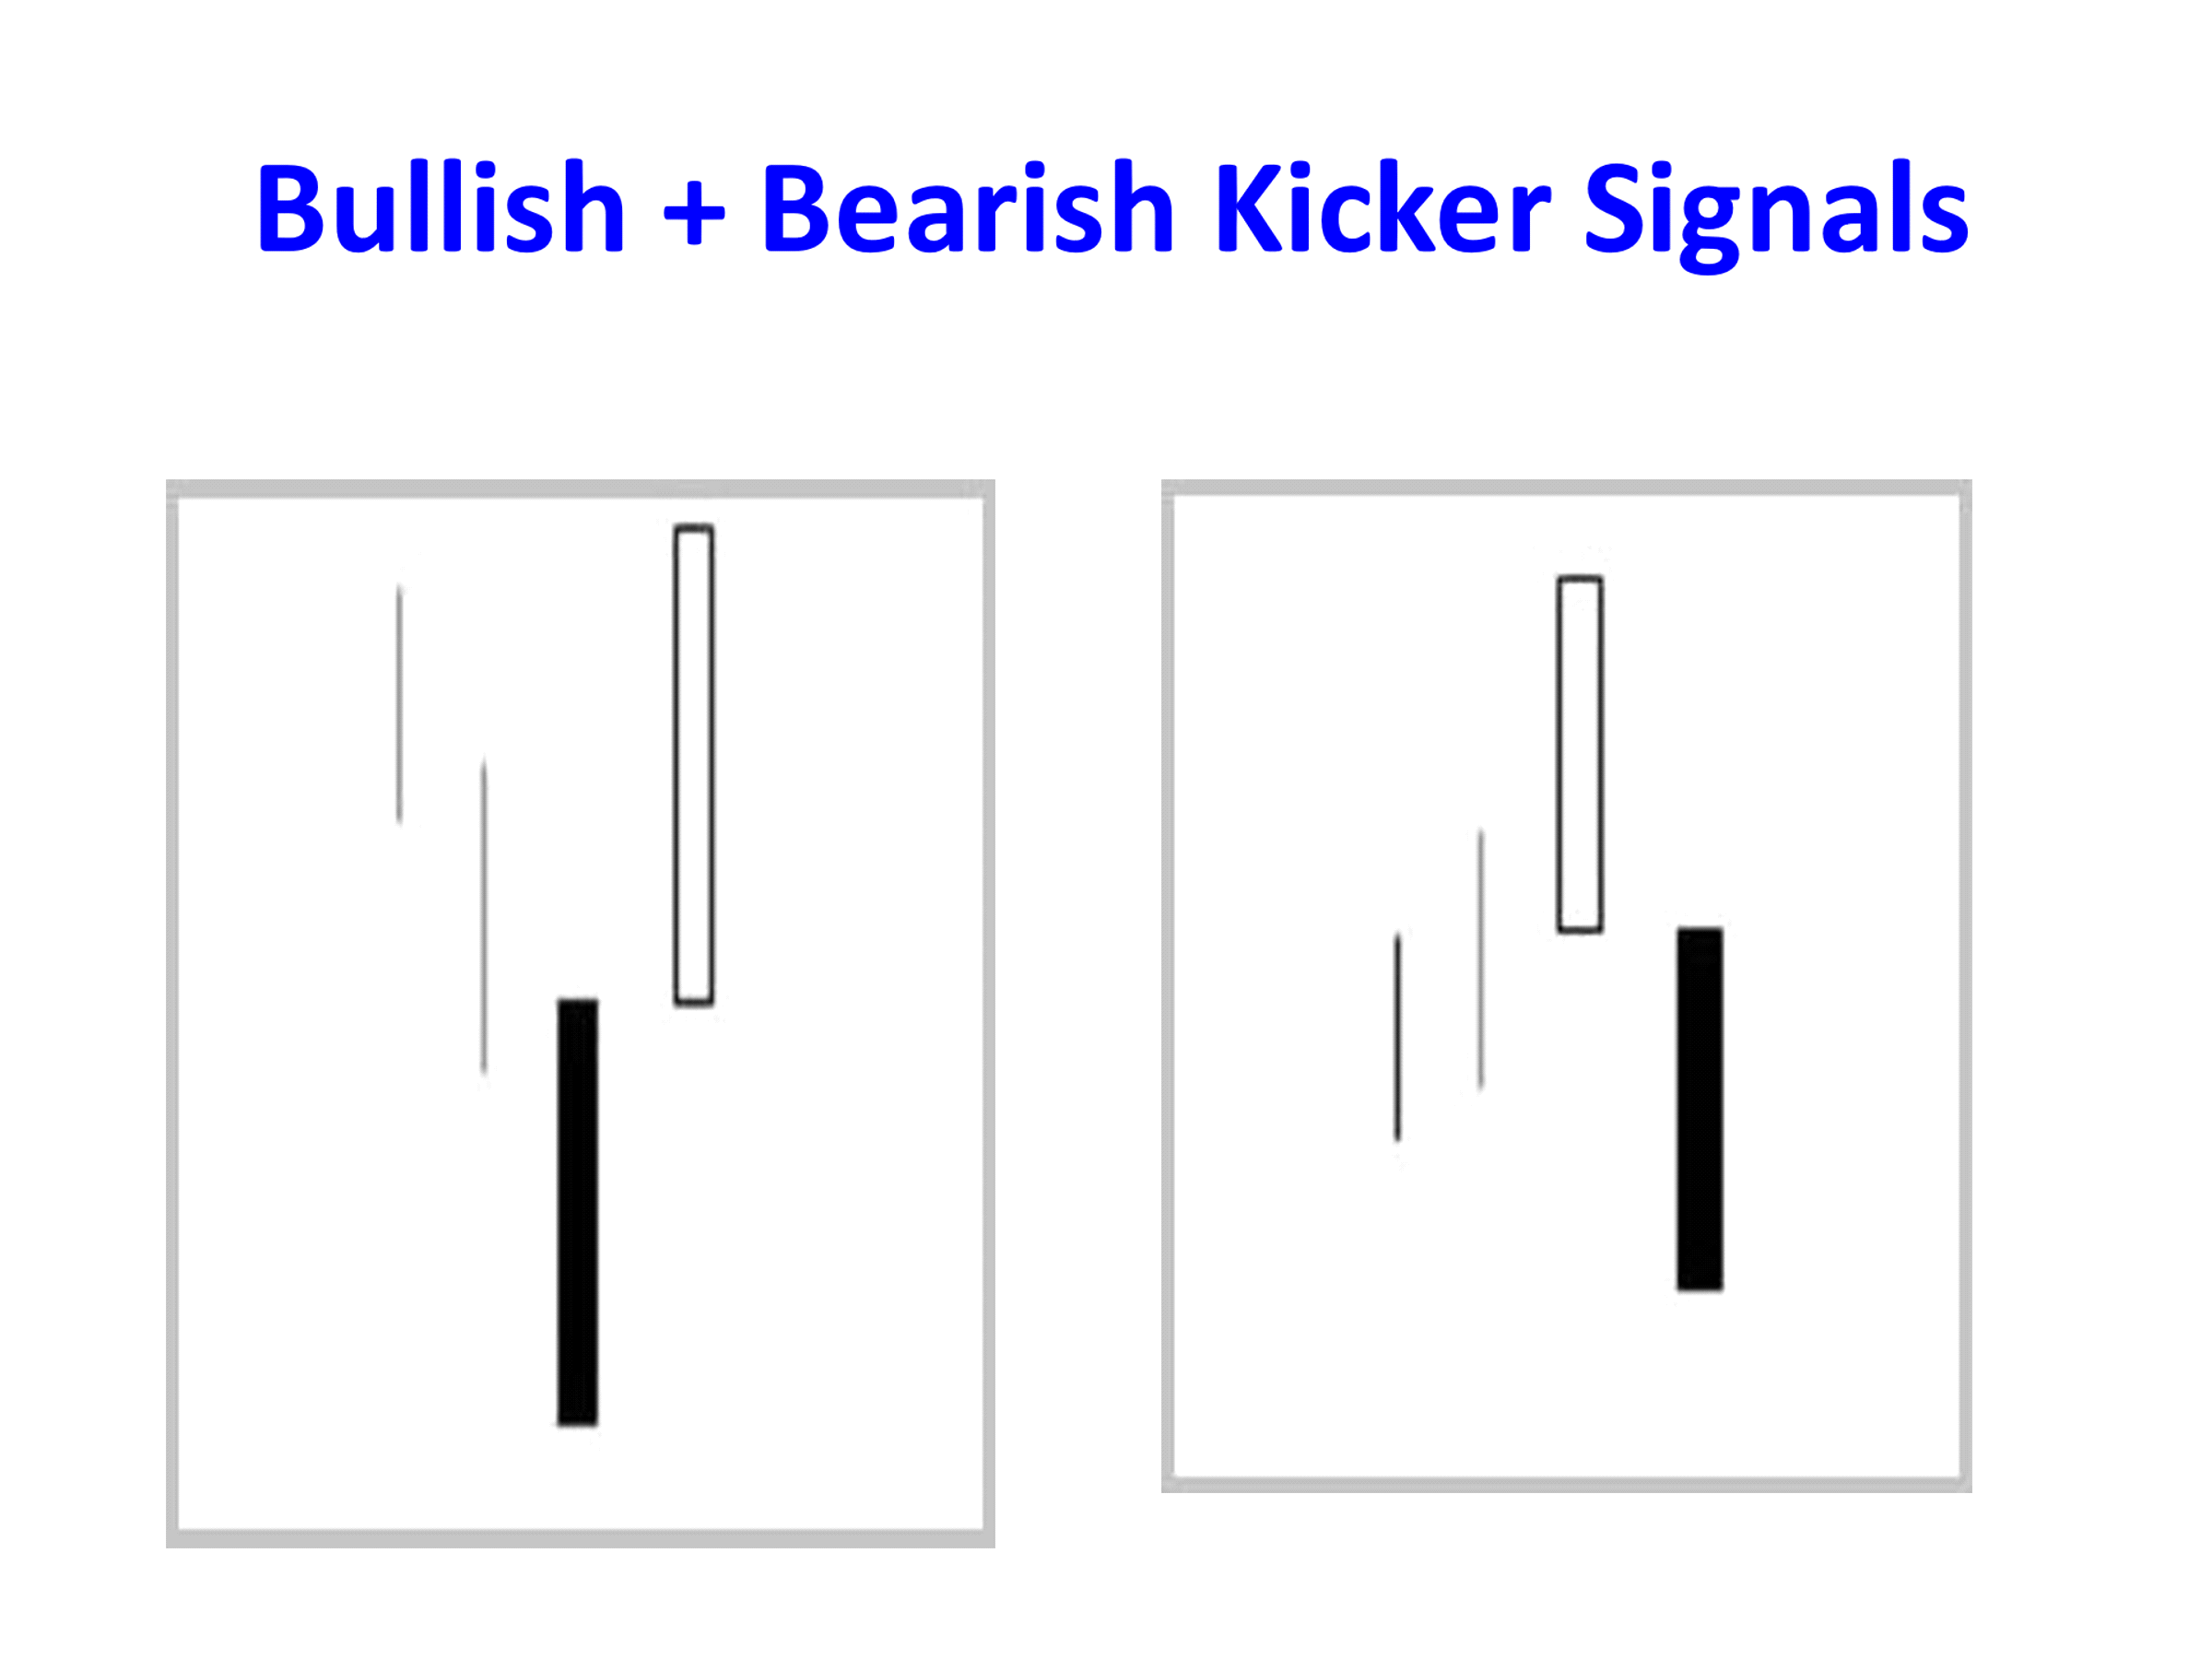
The bullish Kicker Signal is visually recognized. The price gaps up at or above the previous day's open and moves in the opposite direction of the previous day's bearish direction. The bearish Kicker Signal gaps down at or below the previous day's bullish candle and moves in the opposite direction.
The strength of a Kicker Signal is more evidenced-based by the length of the candle bodies. The bigger the body, the stronger the demonstration of a dramatic change in investor sentiment. This information becomes a decisive factor for day traders and swing traders to get into high-probability/high-profit positions.
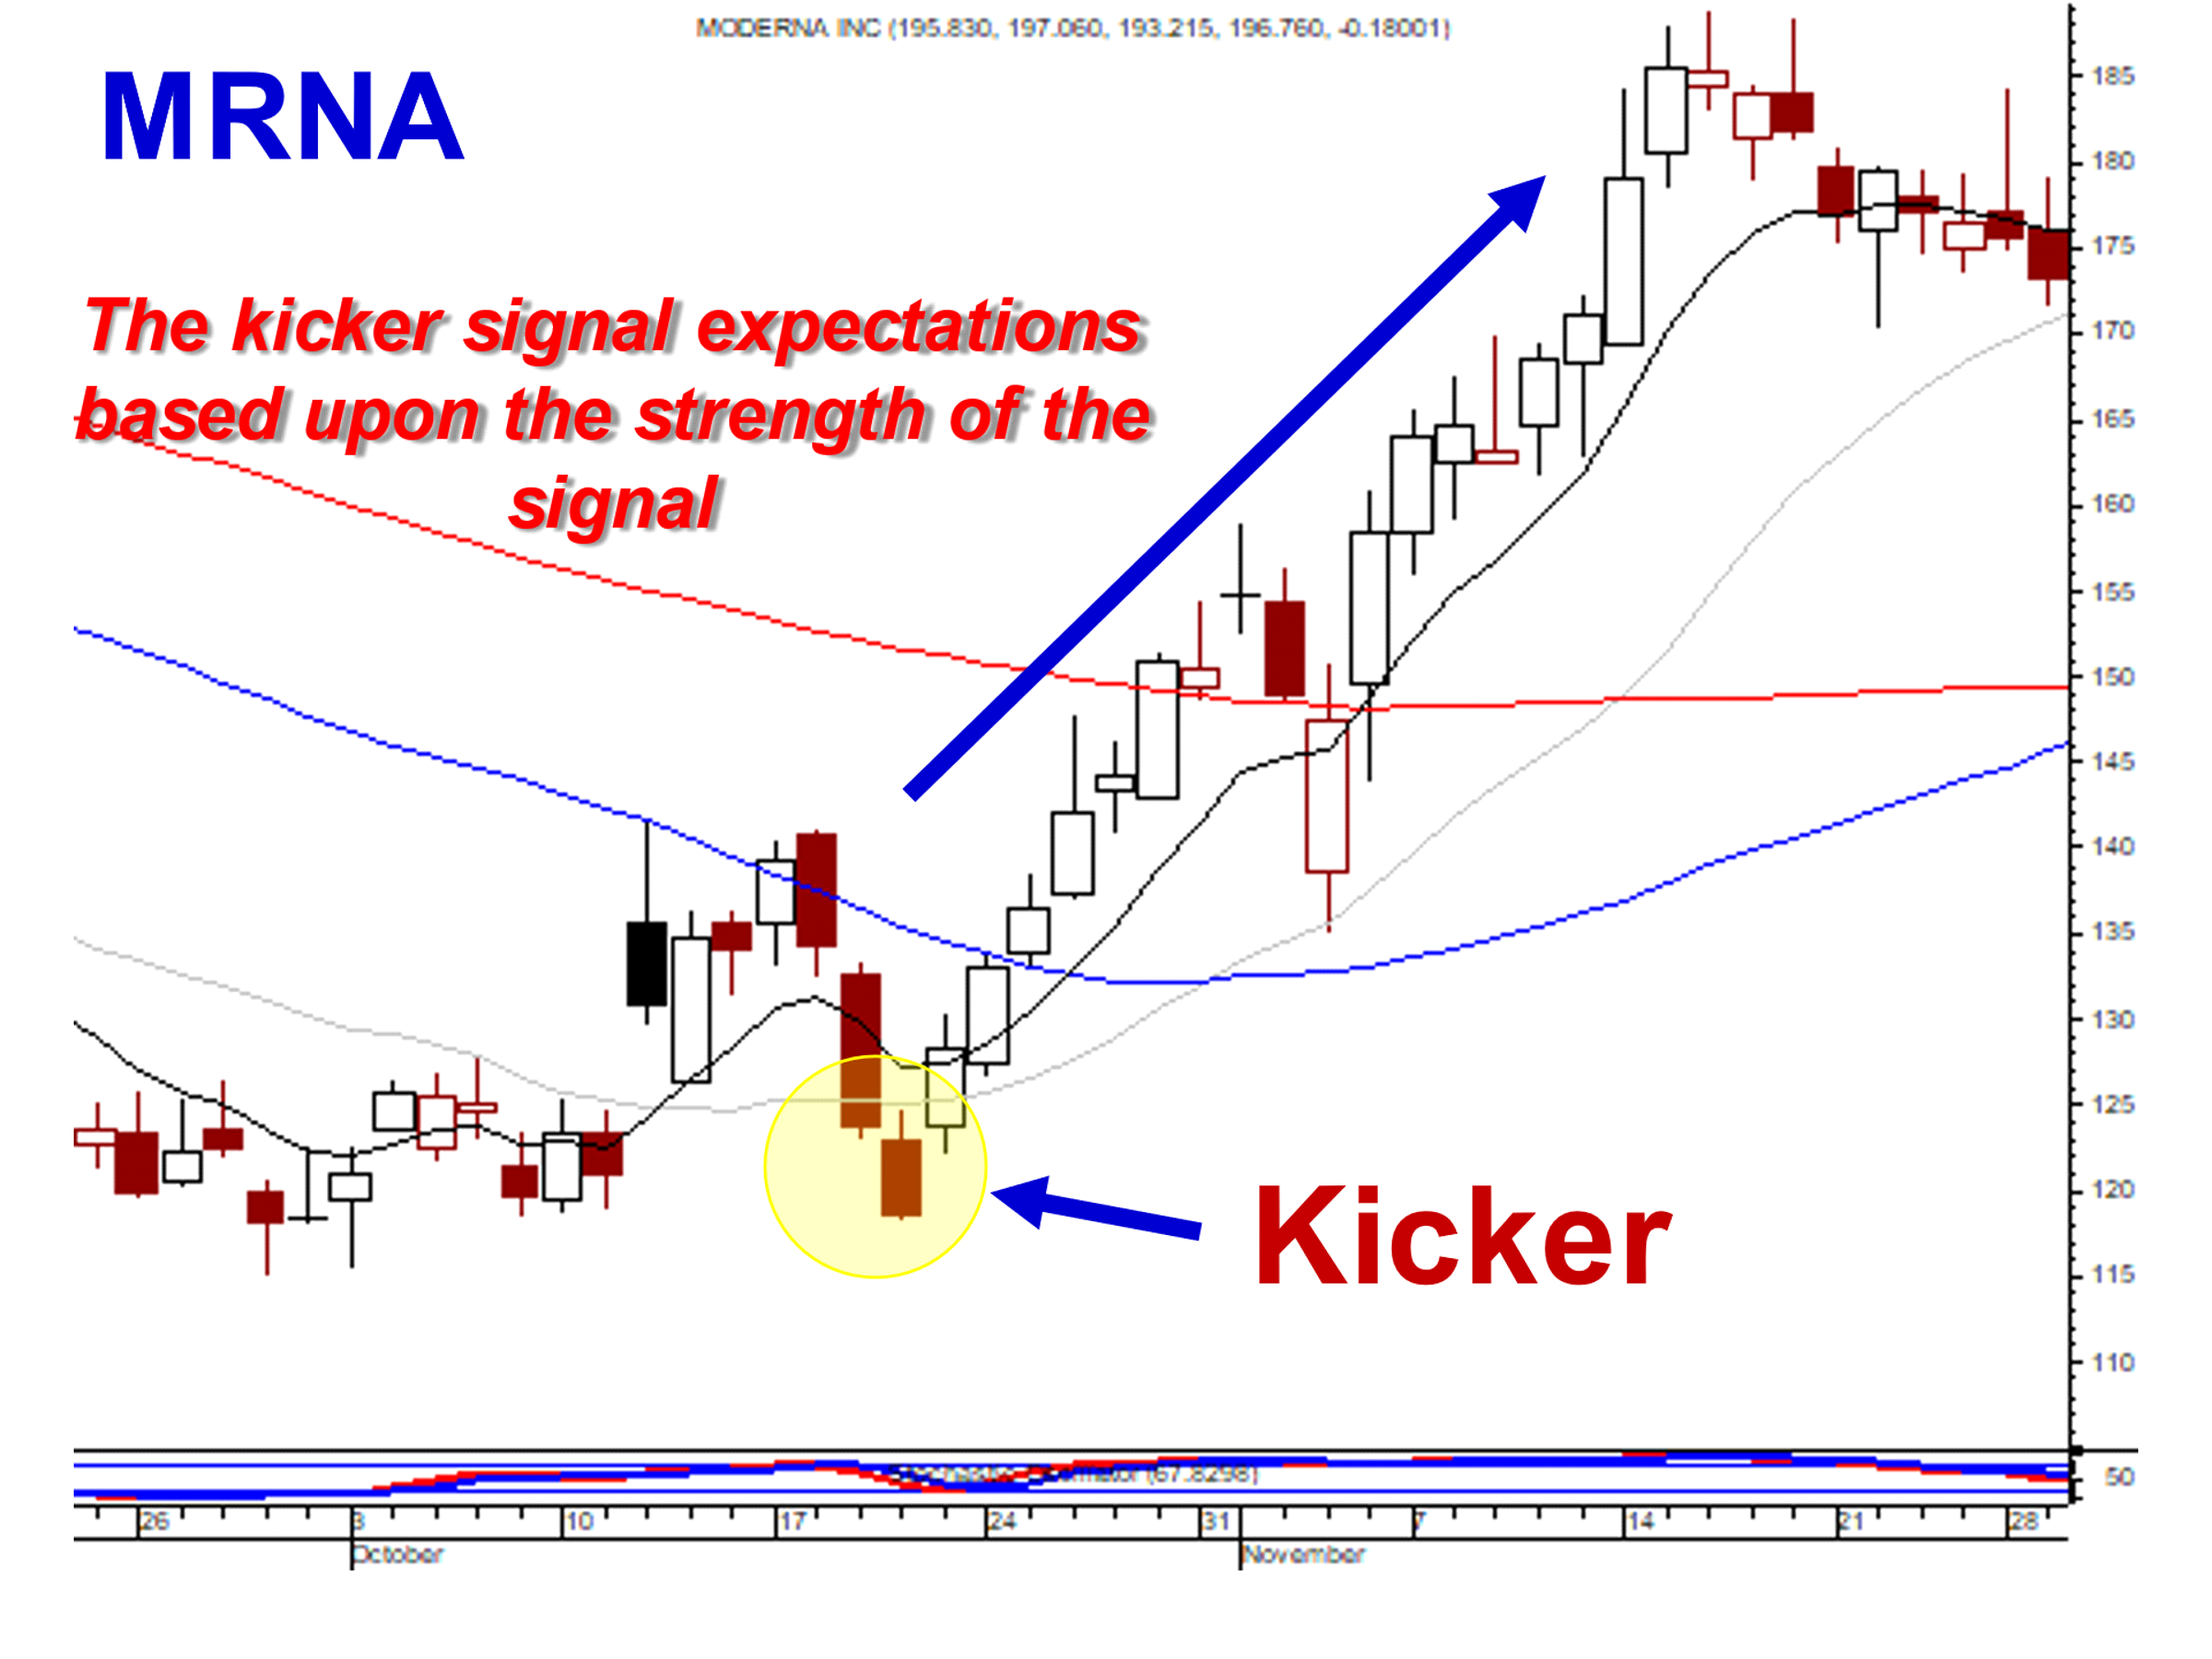
The initial alert of a Kicker Signal developing is the gap up above the previous day's open. As illustrated in the MRNA chart, the strength of the reversal signal was the gap up, the magnitude of the bullish candle, and a close above the T line. The indicators utilized by candlestick analysis make the trading decision reasonably simple. The position is maintained until there is a candlestick sell signal and a close back below the T line.
As with any candlestick reversal signal, the more confirming indicators applied from the visual analysis, the higher the probability that a reversal/new price trend has occurred.
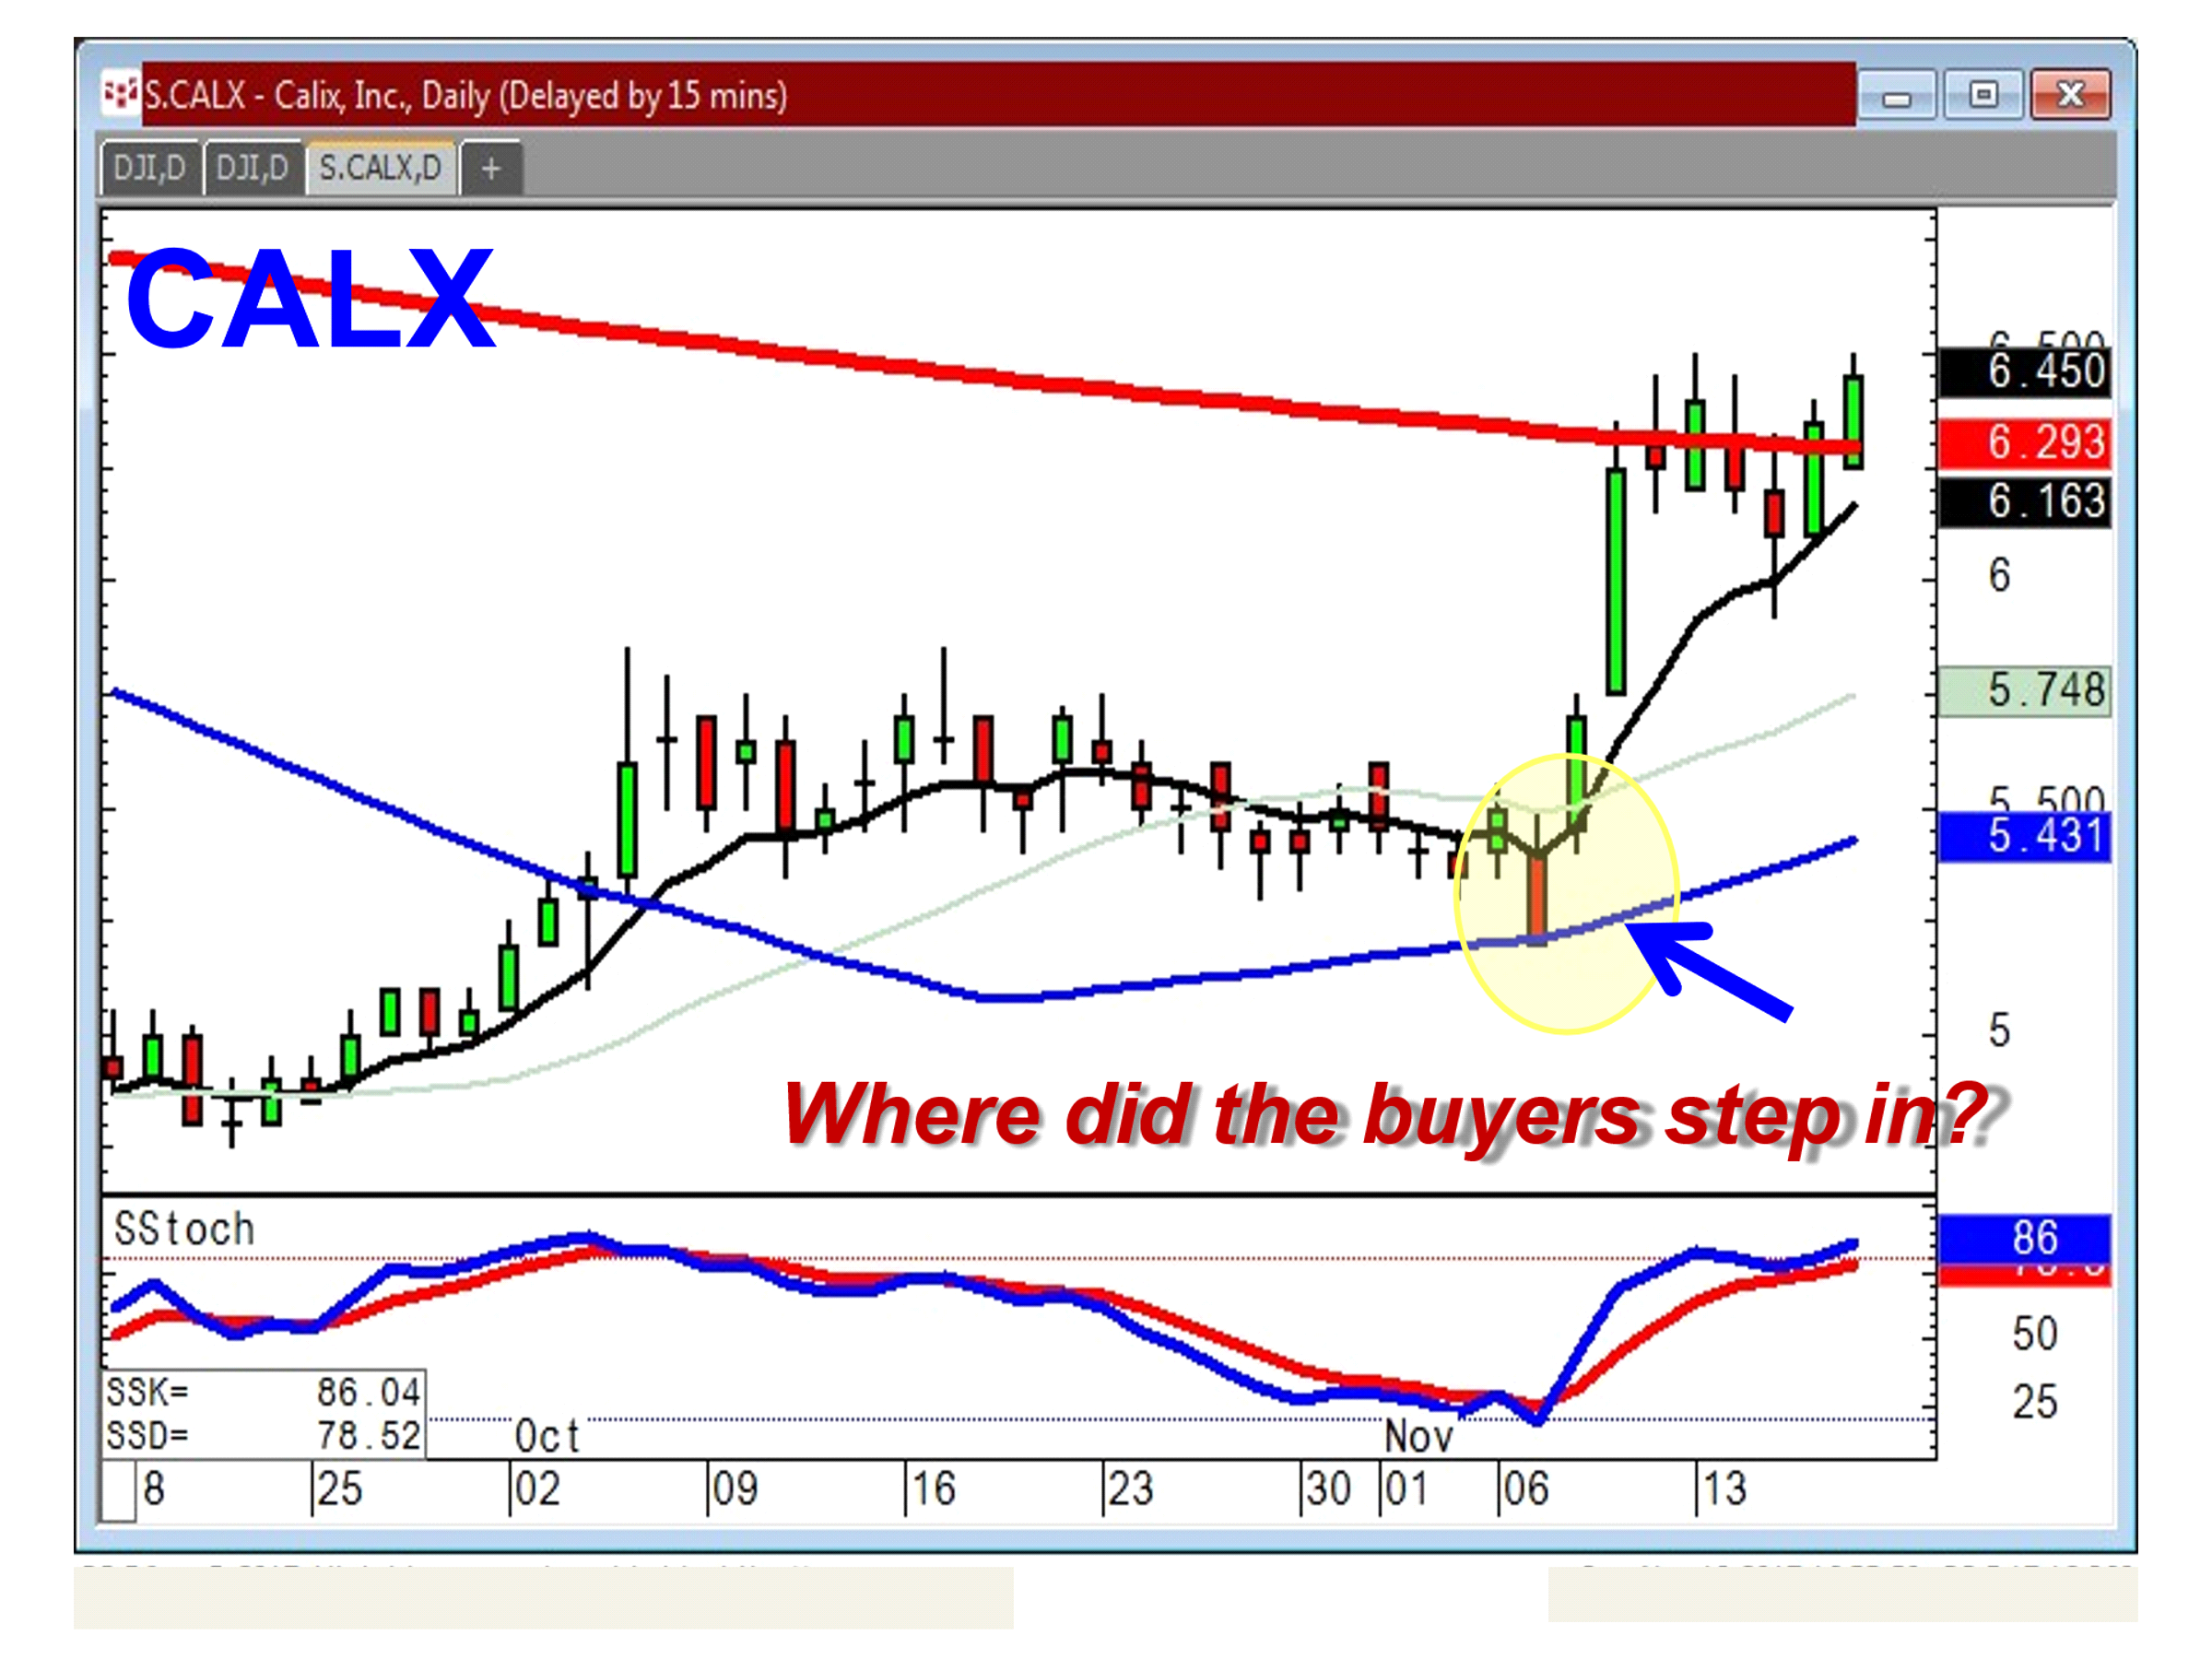
The CALX chart reveals a Kicker Signal off the 50-day moving average, gapping up above the previous day's open and above the T-line and breaking out through the perceived down-trending resistance level. The visual analysis incorporates multiple indications that this is where there has been a dramatic change in investor sentiment.
This analysis is essential for most investors' psyche. What is the biggest fear of a big price move? Boy, do I want to be chasing? When witnessing a candlestick signal, the Kicker Signal eliminates the 'chasing' fear factor. The strength of a Kicker Signal allows the candlestick investor to establish positions in the early stage of a price move. Knowing what is to be expected after witnessing the signal allows for establishing a potentially high-profit trade in the very initial stage of the substantial price move.
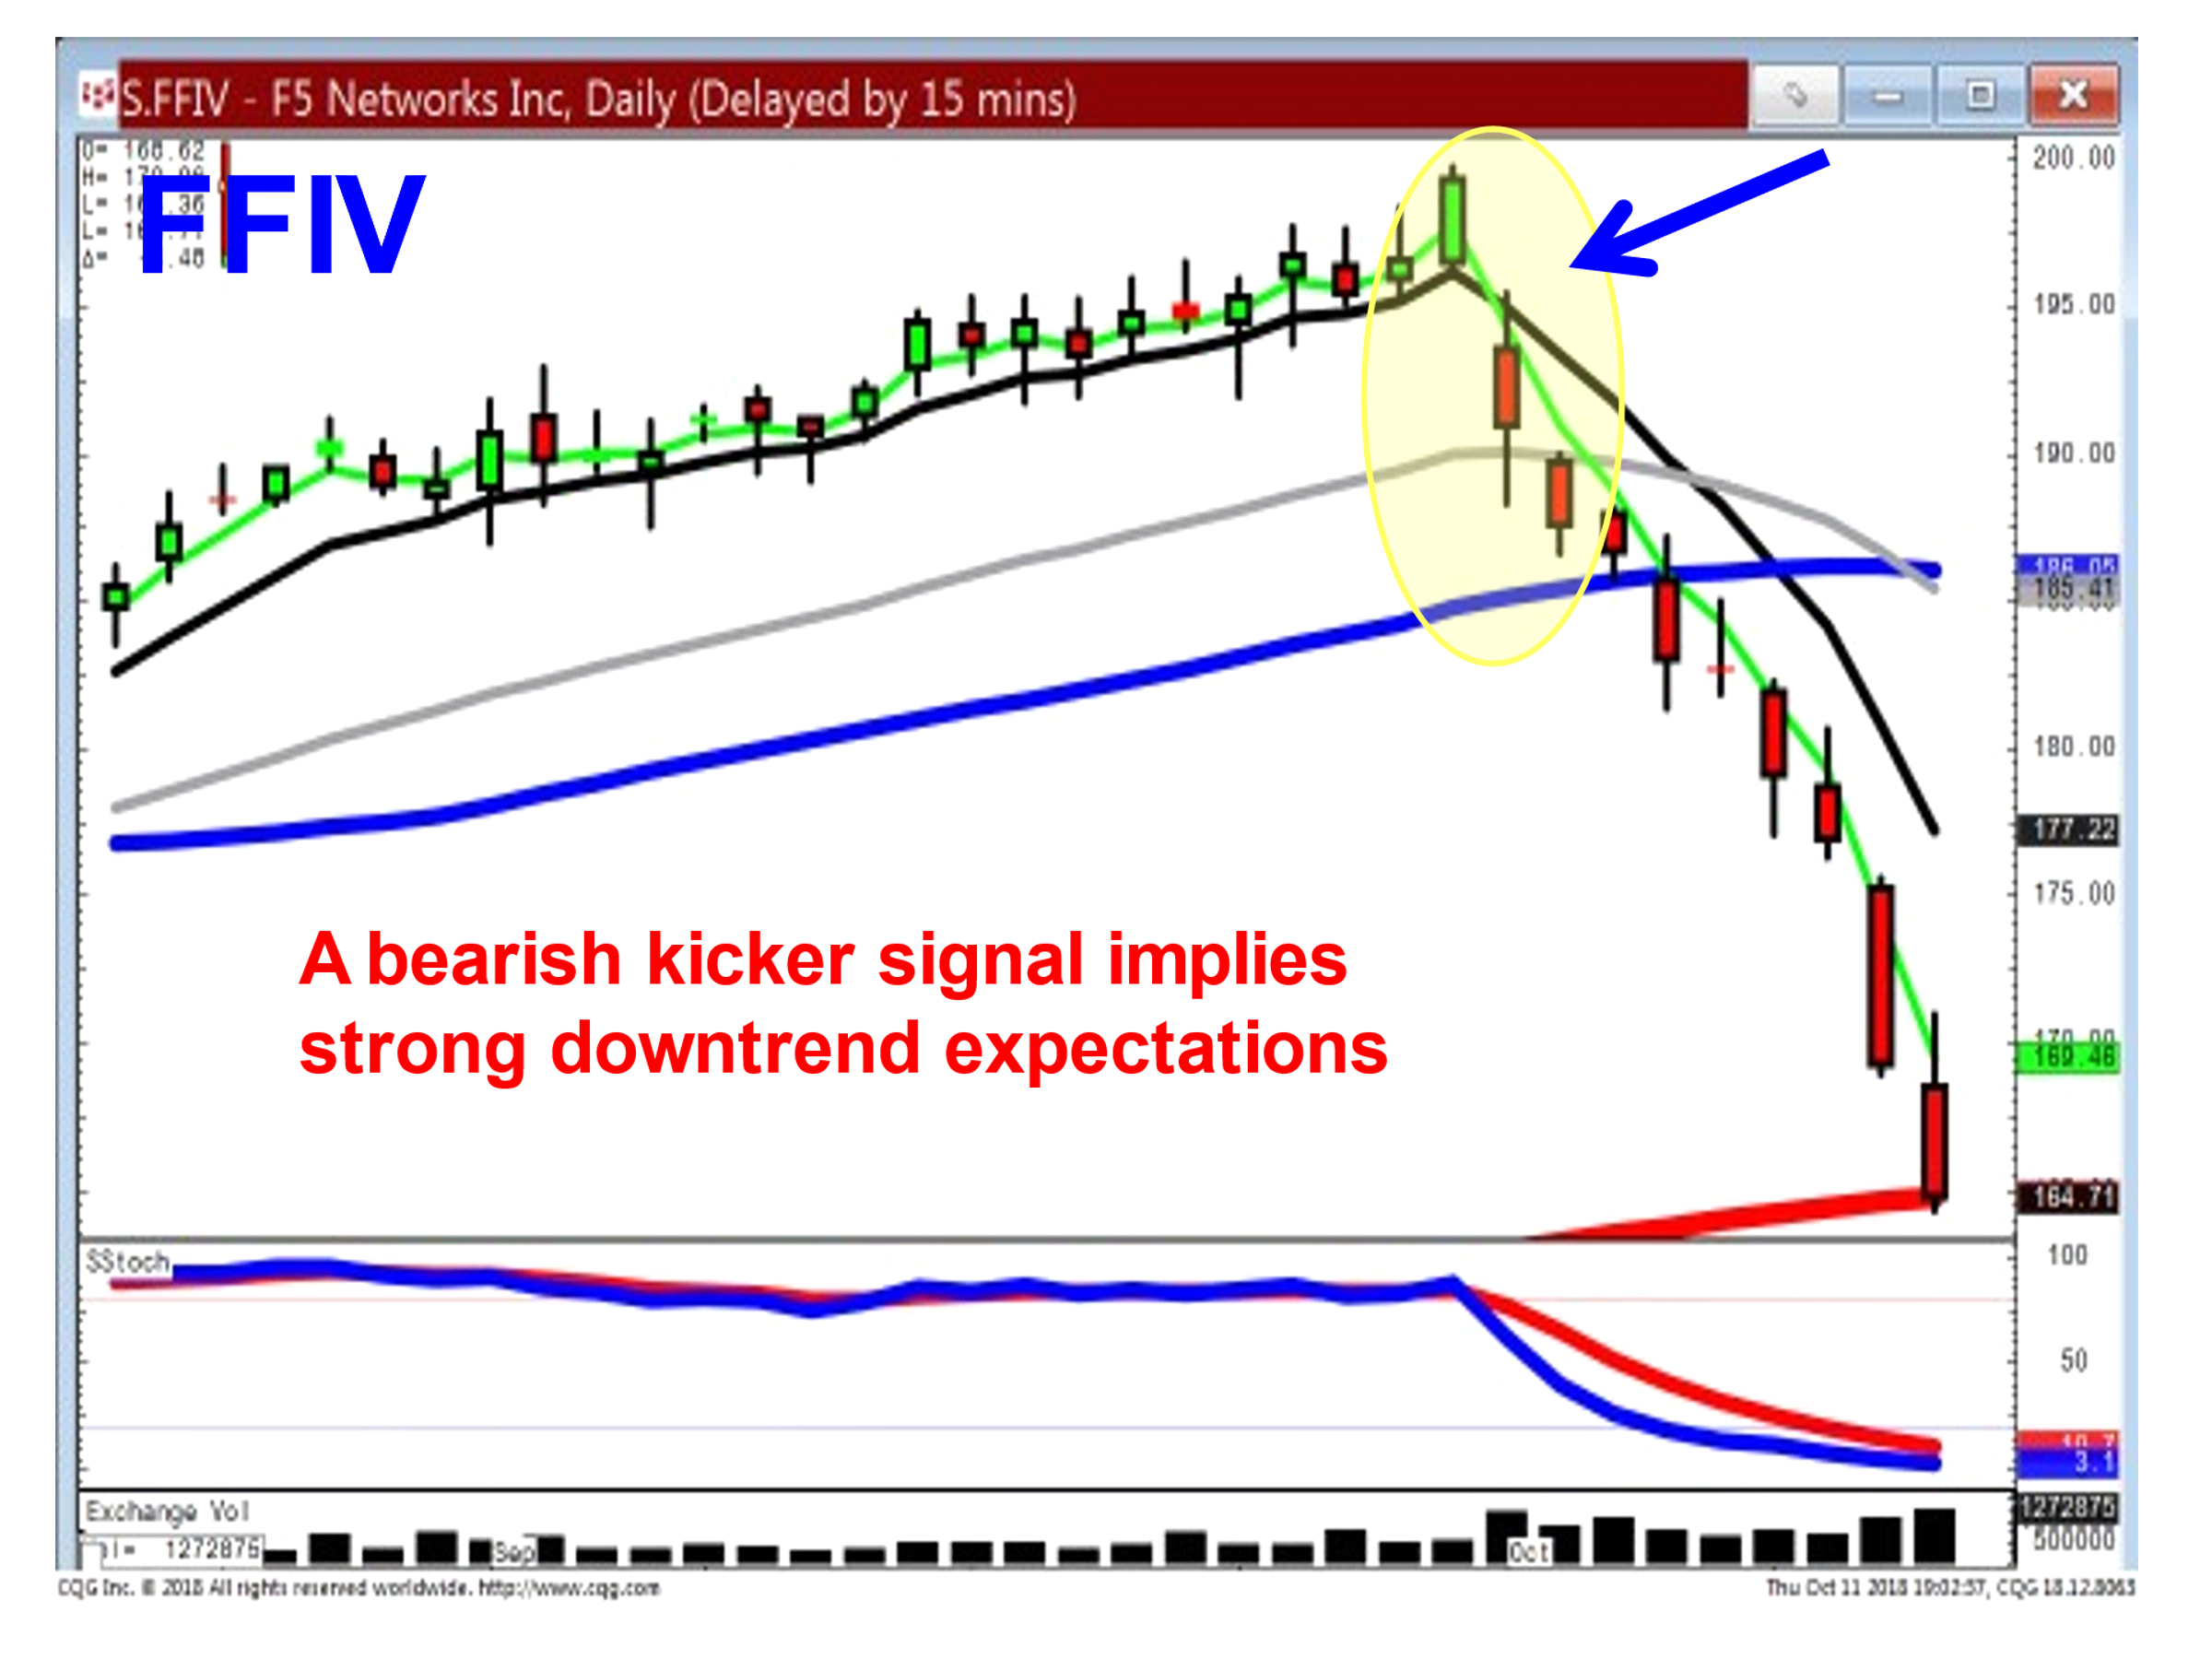
The bearish Kicker Signal produces strong visual evidence of a major change. The strength of the downtrend will continue until witnessing a strong bullish reversal signal.
The Trend Kicker signal
The Trend Kicker Signal acts as a very strong trend continuation indicator. It is a Kicker Signal that occurs during an existing trend. The trend usually has been started with a pattern confirmation. But like most price trends, they do not move in the same direction every day/time frame. Witnessing a bearish trading day during an uptrend is not necessarily a bearish reversal signal; merely profit-taking is not an uncommon occurrence. The trend kicker signal provides good evidence that the trend will likely continue with a high degree of strength and probability. As demonstrated in a Kicker Signal, a Trend Kicker Signal allows for immediate entry with the expectation that the trend will likely continue and with reasonable force.
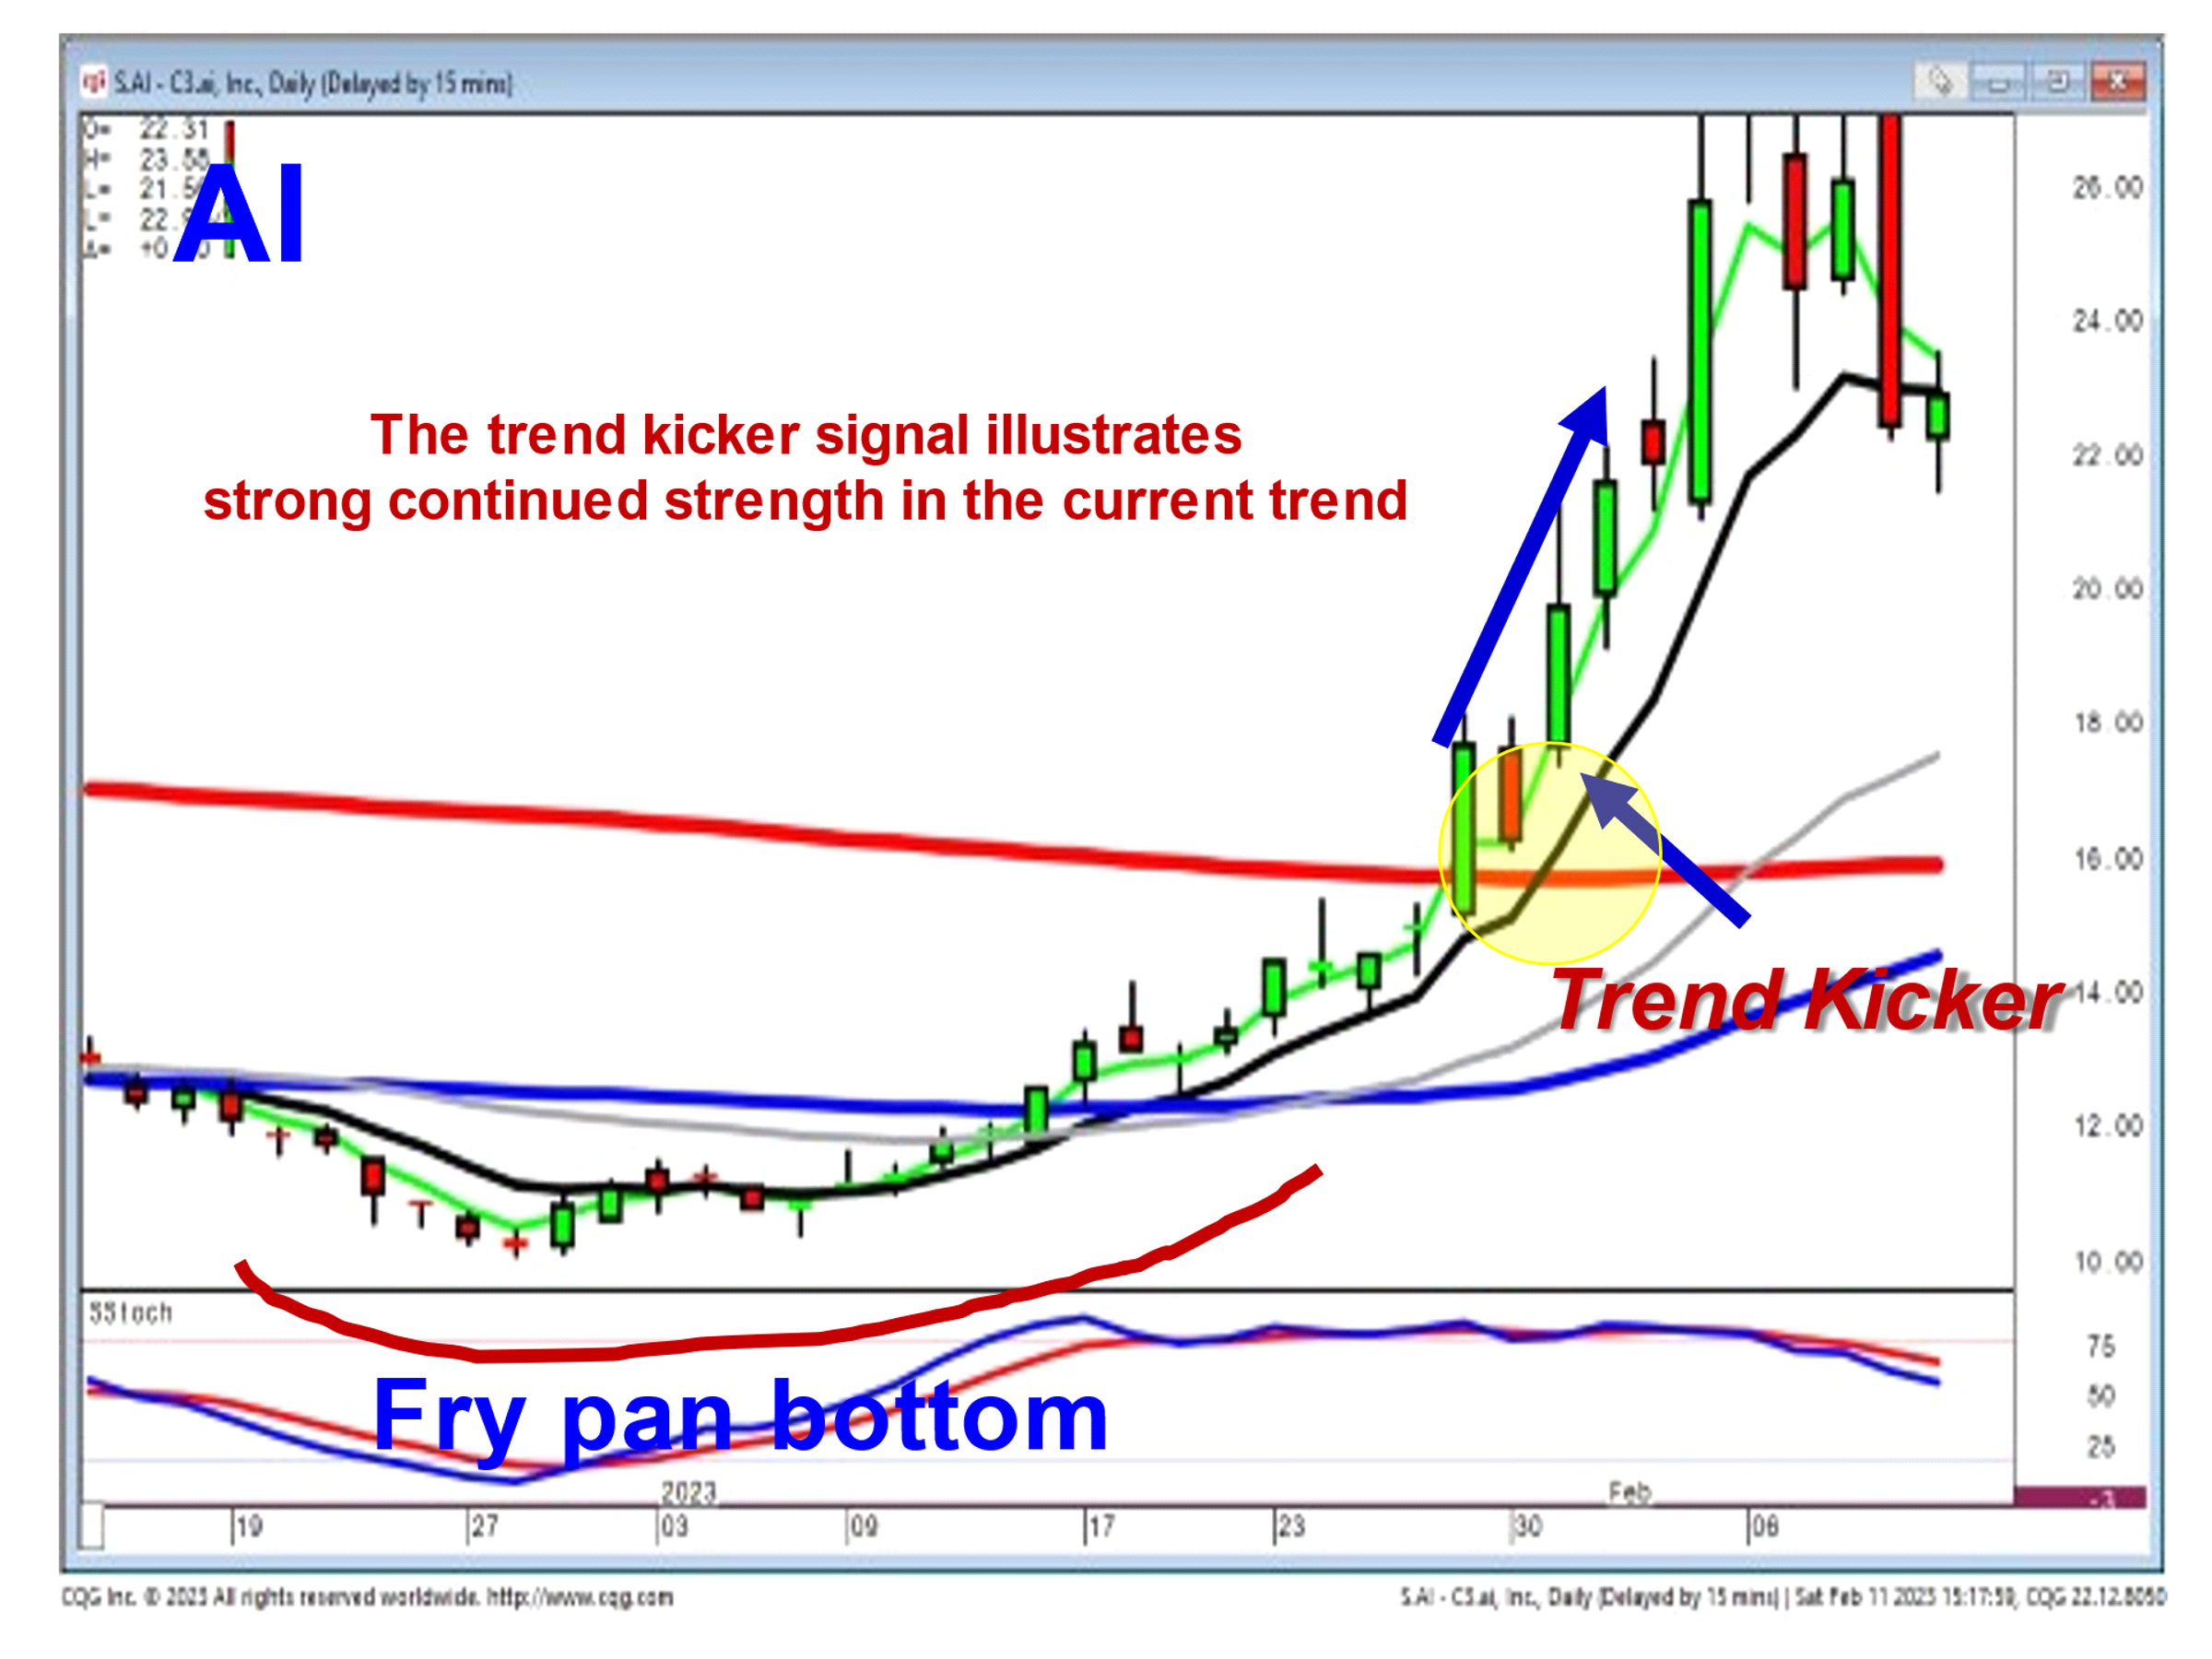
The AI chart reveals a price move starting, coming out of a fry pan bottom pattern. The bearish candle, after the price broke out through the 200-day moving average, might have implied some consolidation. However, the next day when the price gapped up above the previous day's open and traded positively created a bullish Trend Kicker Signal, indicating there was still going to be a much more bullish upside to the trend.
The Flutter Kicker Signal
The Flutter Kicker Signal is a derivative of the Kicker Signal. But it has one major advantage! It produces highly high probability entry trades for day traders and swing traders. It is created when a bearish candle is followed by a gap up at or above the opening of the bearish candle. This produces an alert not usually seen by most other investors. But the gap-up trading produces a Doji-type day. This may not indicate a strong bullish potential, but this is where the Doji rule kicks in. The Doji rule merely states that a price will usually move in the direction of how they open the following time frame after a Doji. A positive open immediately indicates the price will continue to move positive, likely to form a strong bullish candle after the Doji.
The flutter is the Doji in between a bearish candle and a gap-up indecisive day followed by a bullish candle. If you took the Doji, the flutter, off the chart, you now have a Kicker Signal. The major advantage is that candlestick investors can be prepared immediately on the positive open of the third day.
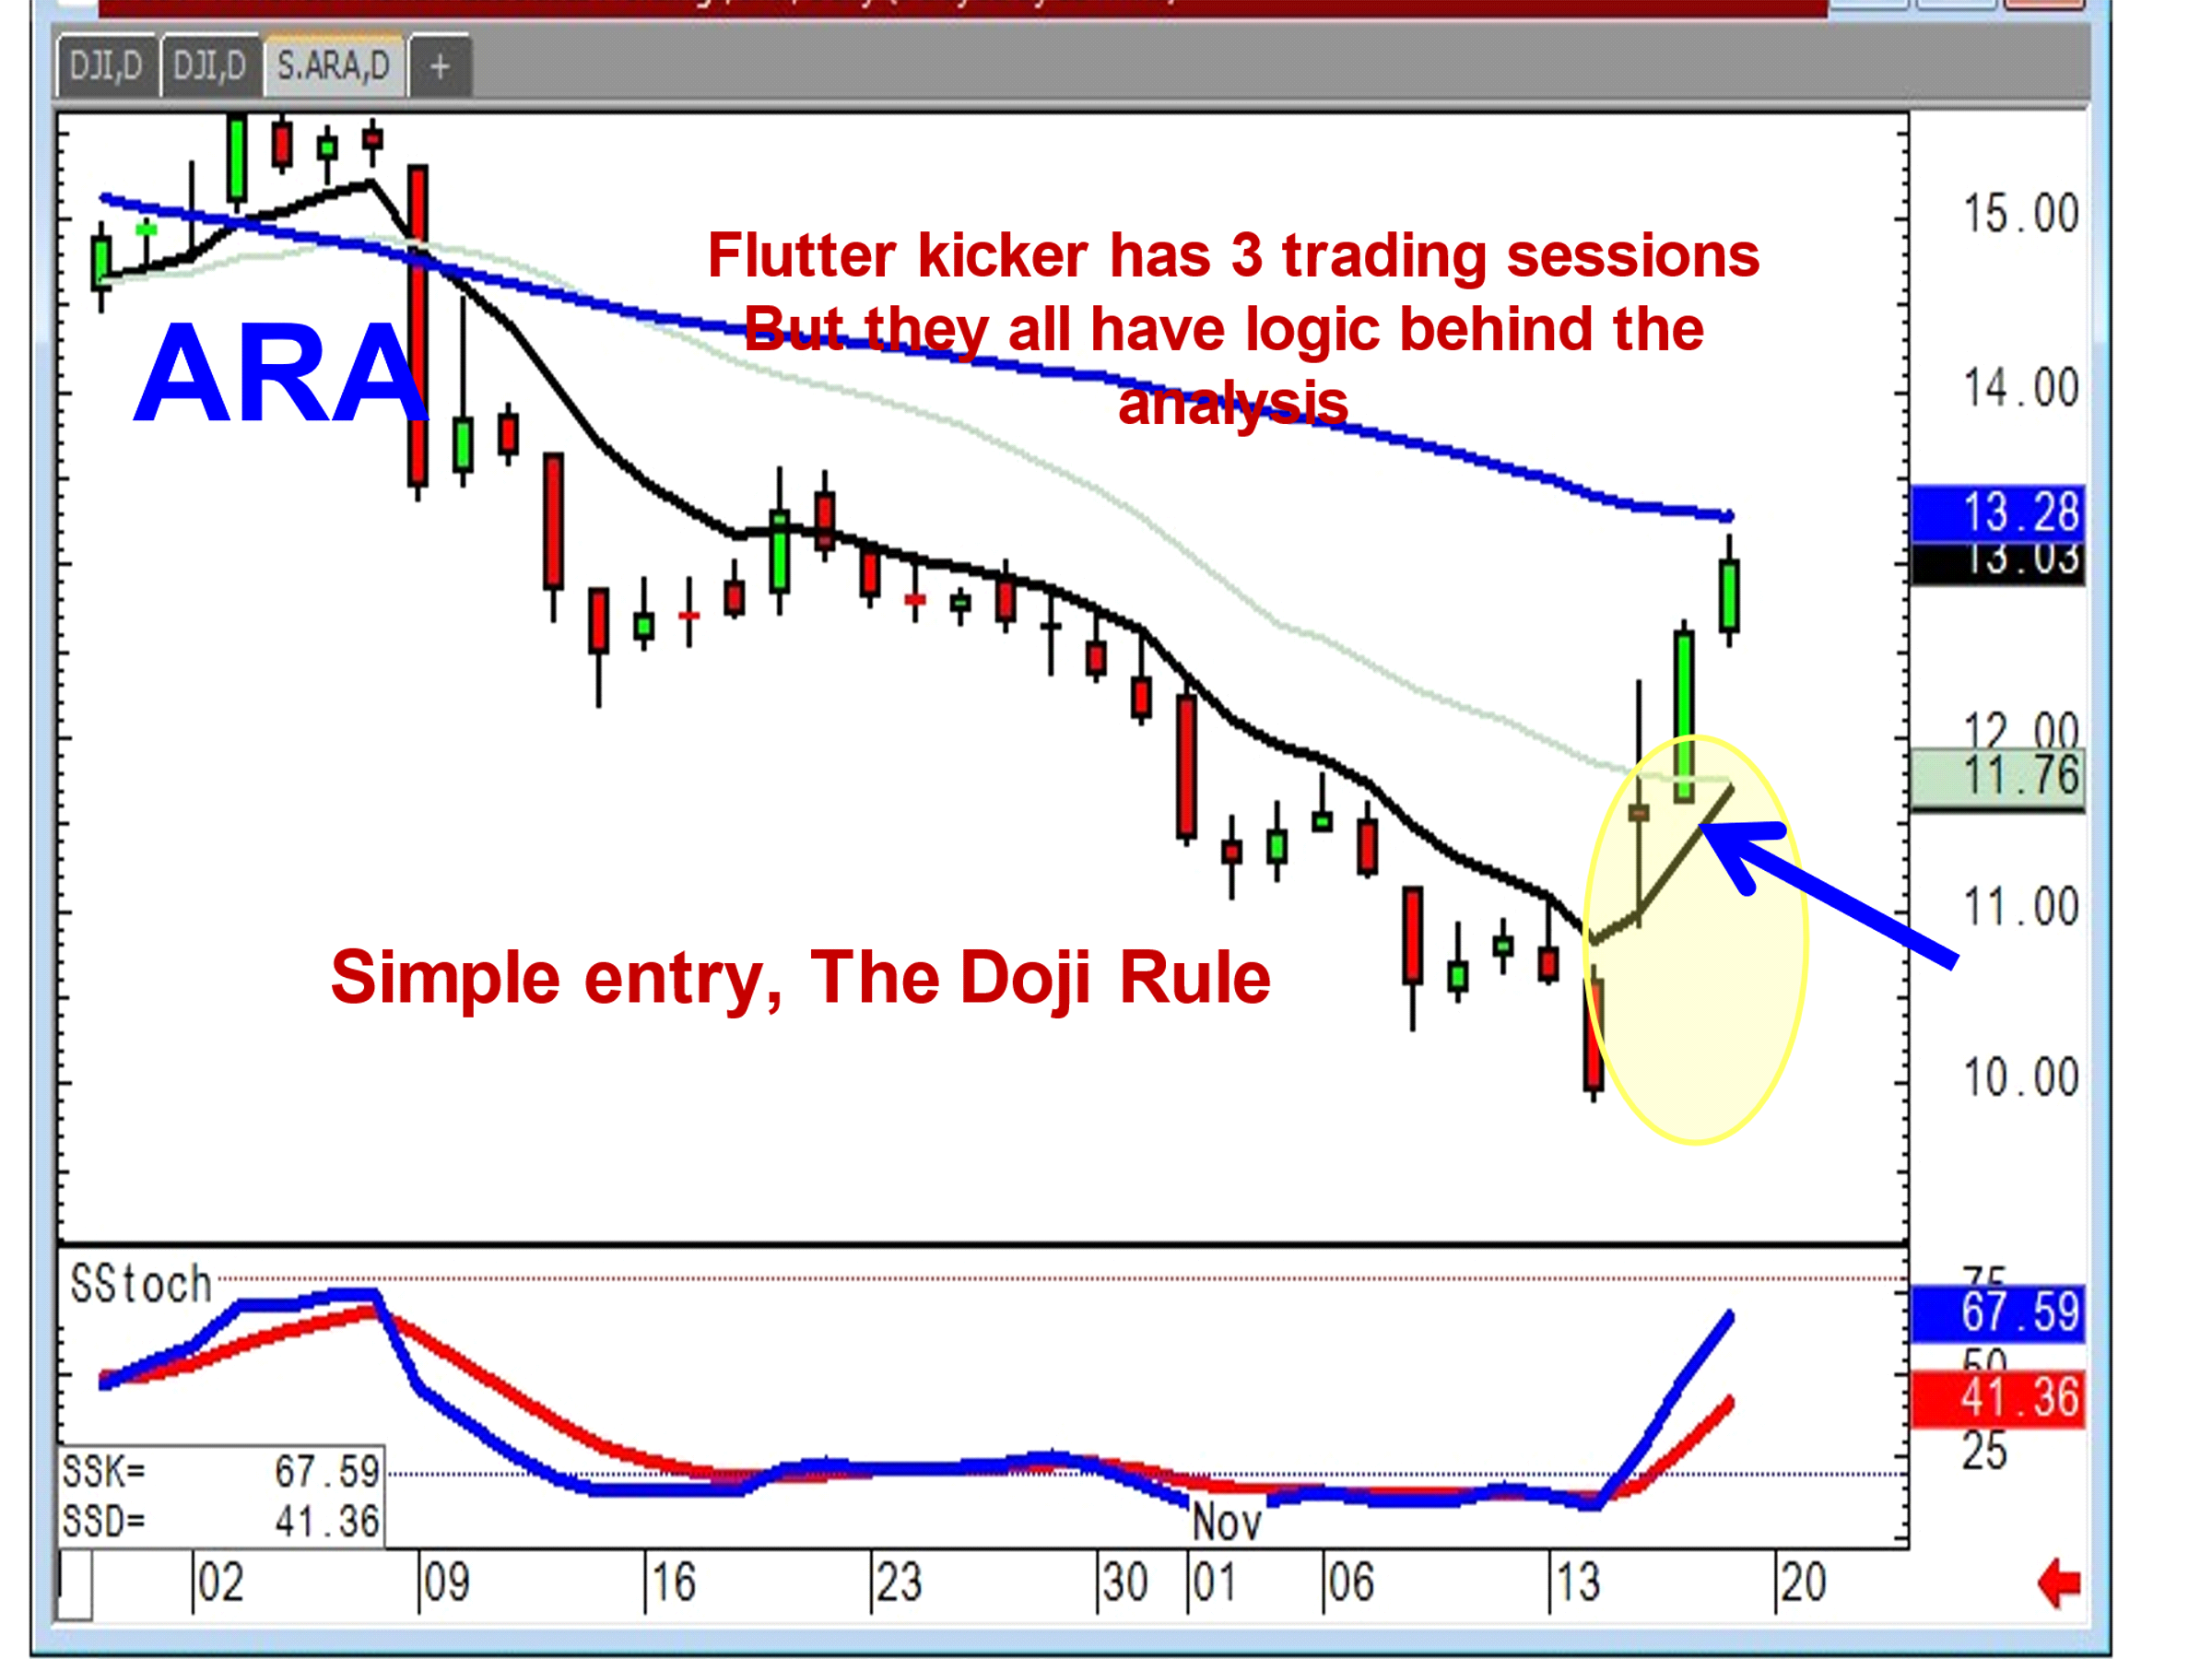
The gap up after the bearish candle in the ARA chart becomes the "alert" that investor sentiment has changed. A high probability trade entry is utilizing the Doji rule, buying on positive trading after the Doji. For the day trader, as well as the swing trader, this is an extremely high probability trade entry. A bearish Flutter Kicker Signal produces a solid force to the downside.
The Strength of Candlestick Signals
As an investor, whether a day trader, swing trader or a long-term investor, applying the commonsense expected results of candlestick signals and patterns dramatically improves the ability to evaluate trend movement much more accurately. Candlestick signals and patterns are not conjecture. They indicate the 'actual' decisions occurring between the bulls and the bears.
The logic is simple! Candlestick analysis is the graphic depiction of everybody buying and selling during a specific time frame. It is not delegated to any particular trading market or entity. It is a graphic depiction of human nature. Anything that involves investor fear and greed, which is all trading entities, market indexes, ETFs, stocks, commodities, currencies, and tulip bulbs, can be evaluated with much greater accuracy using candlestick analysis.
The chart signals and patterns work on all time frames. They are effective for the short-term trader/day trader utilizing a one-minute, five-minute, and ten-minute chart analysis combinations. Long-term hold periods would utilize the daily, weekly, and monthly chart evaluations. The Japanese rice traders not only identified high probability price reversal signals, they also explained what investor sentiment was doing to create the reversal signals and patterns. This combination allows investors to analyze price movements with the same insights as an investor with 50 years of investment experience.
You can turn your investment perspectives around 180°. Witnessing a candlestick buy signal in the oversold condition reveals where the smart money is buying. Witnessing a candlestick sell signal in the overbought condition reveals where the smart money is selling. Candlestick charts allow you to participate with the 'smart money'. Doing what the charts reveal takes the emotions out of your trading.
Candlestick charts reveal some very powerful truisms. The chart graphics are based upon the most consistent investment indicator in the world - human nature. Another Wall Street investment truism is that if something does not work, it does not stay around very long. Candlestick analysis has been in existence for hundreds of years. Japanese rice traders have identified signals and patterns that produce high-probability results based on investor sentiment. All an investor needs to do is learn how to use candlestick signals and patterns correctly. They work!