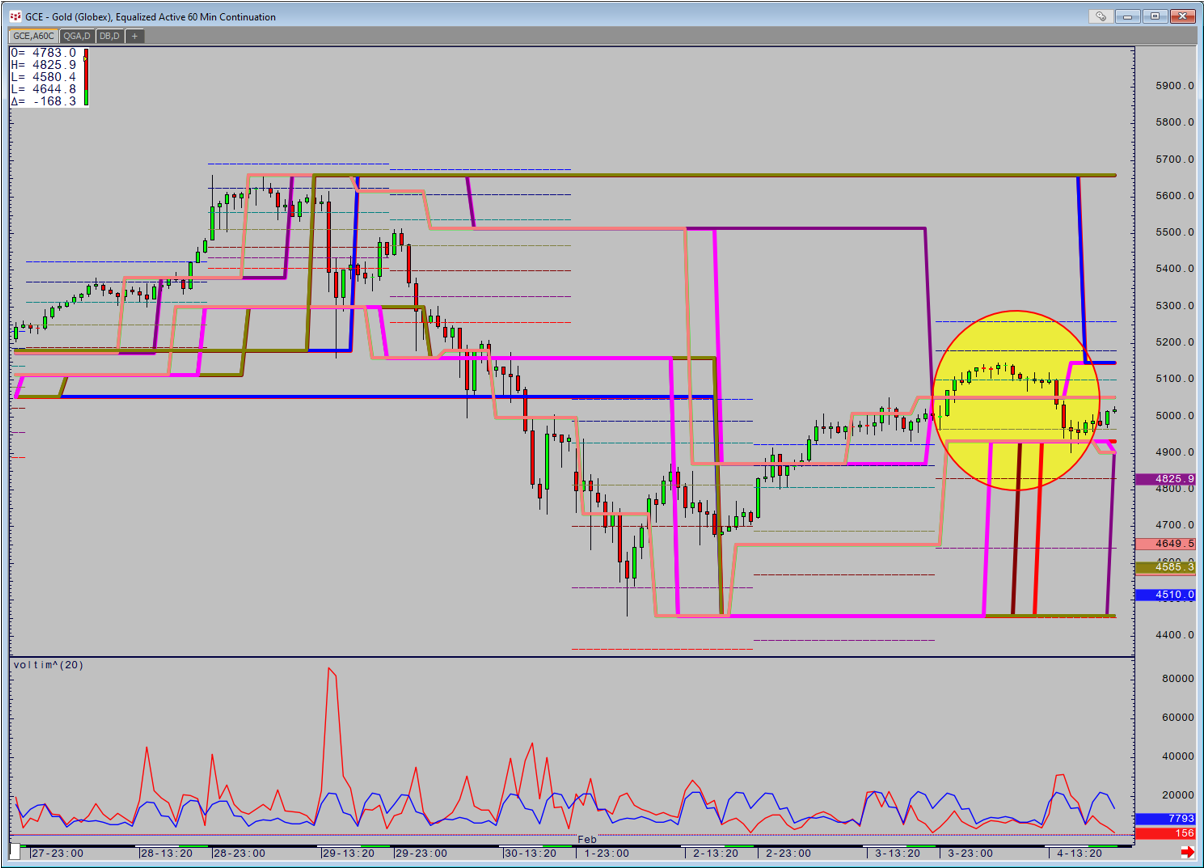
When building trading models a common error is to focus mainly on entry signals. Experience told me that exit methodology and sound money management will have far more effect on individual model… more
Shaun Downey
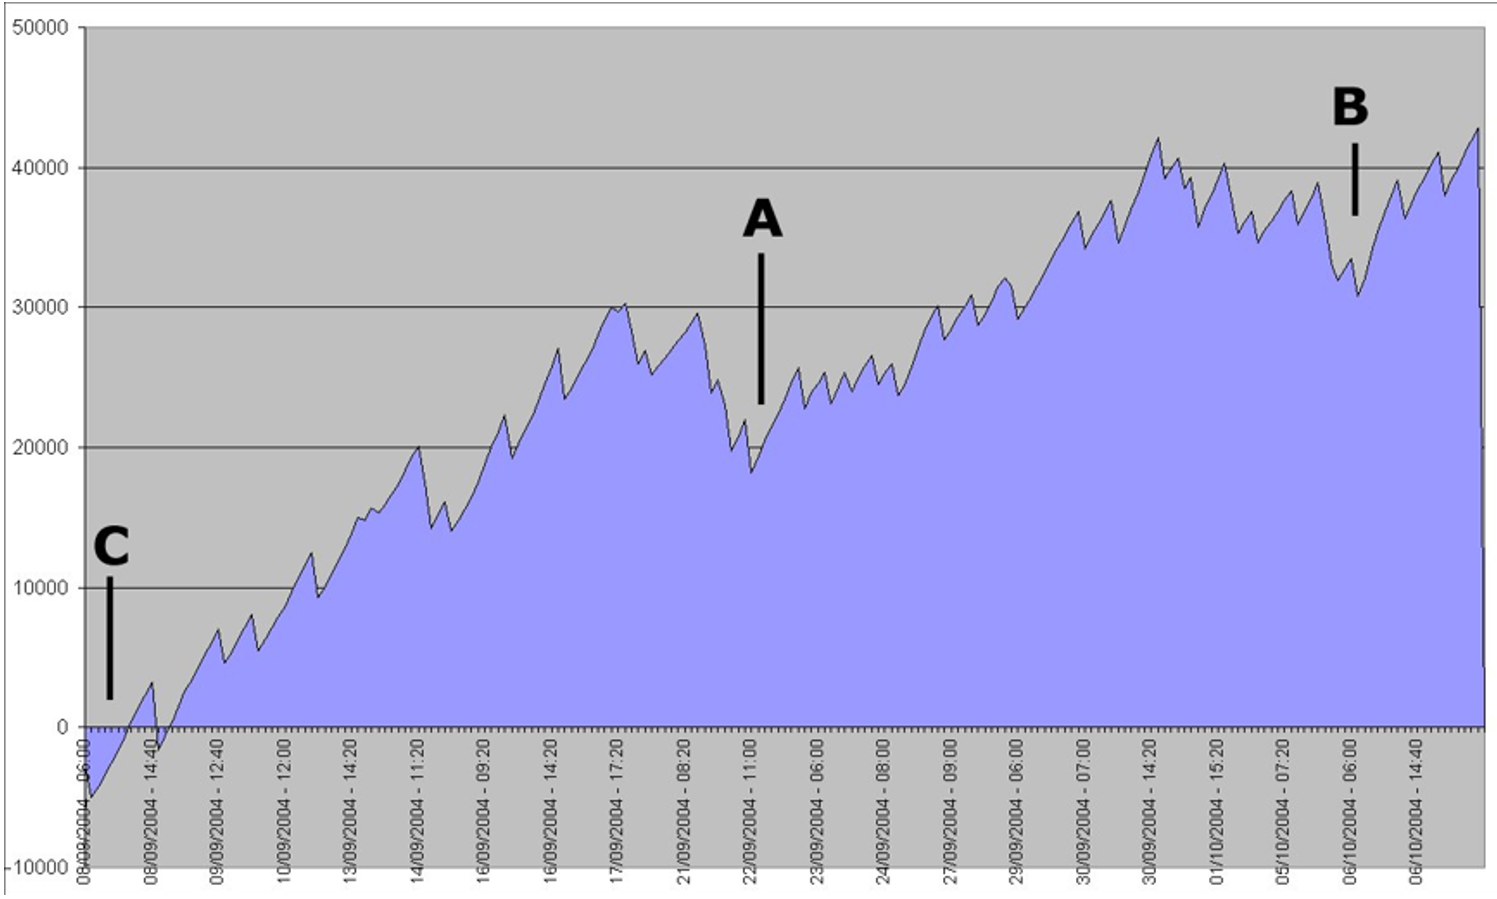
Within my role at CQG, one of the primary was to assist customers in Building Systems. Very quickly it became apparent that the vast majority placed most of the emphasis on the entry point and… more
The vast majority of my multiple timeframe analysis is taking my timing chart and projecting higher timeframe patterns and supports and resistances. Stochastic Steps is one of the few that does it… more
The ability to merge Profiles was a quantum leap in my understanding of Price, Time and Volume and I had the fortune to be able to use Stedlmeyers Capflow software which allowed the creation.… more
Back when I began my trading career in 1979, Technical Analysis consisted of receiving a Knight Ridder chart book and the updating it by hand through the week. With a calculator I could calculate… more
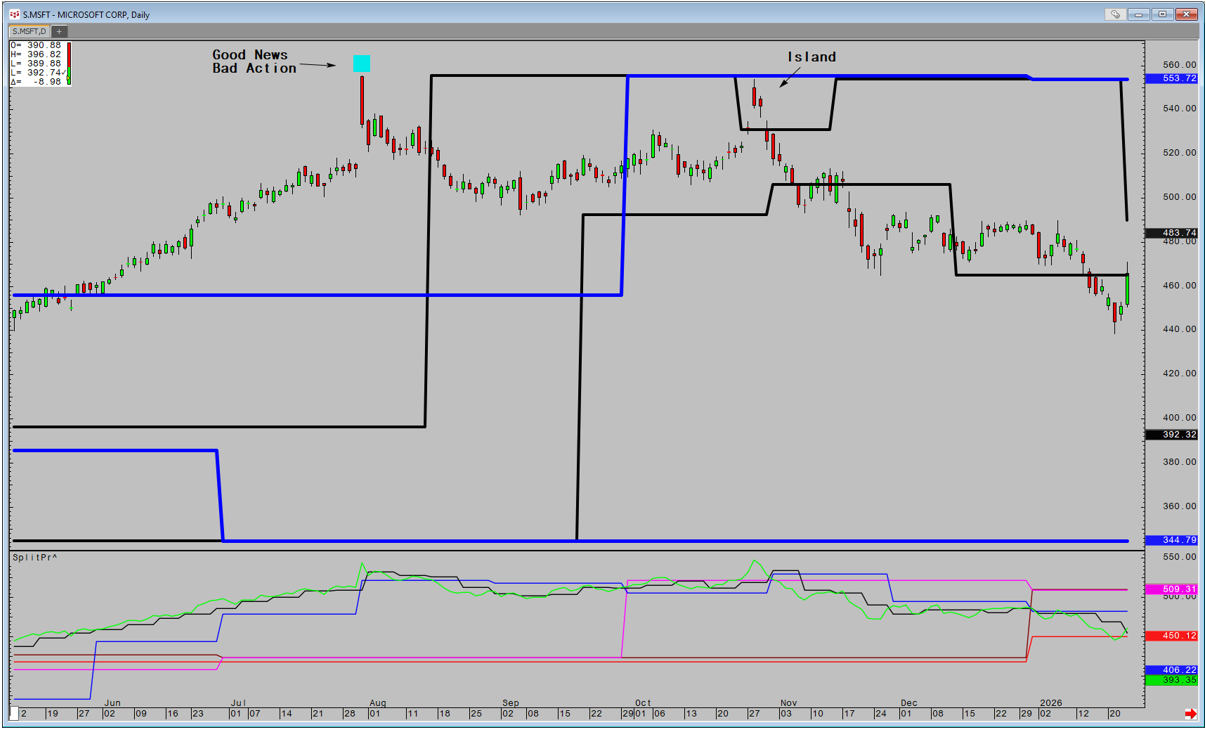
The switch from my haven of Futures and Fx, to the world on USA equities and ETF's to run a Hedge Fund, presented a new set of challenges. My world had moved from 80 instruments to focus on to… more
Read Quantifying Divergence Part 1Read Quantifying Divergence Part 2
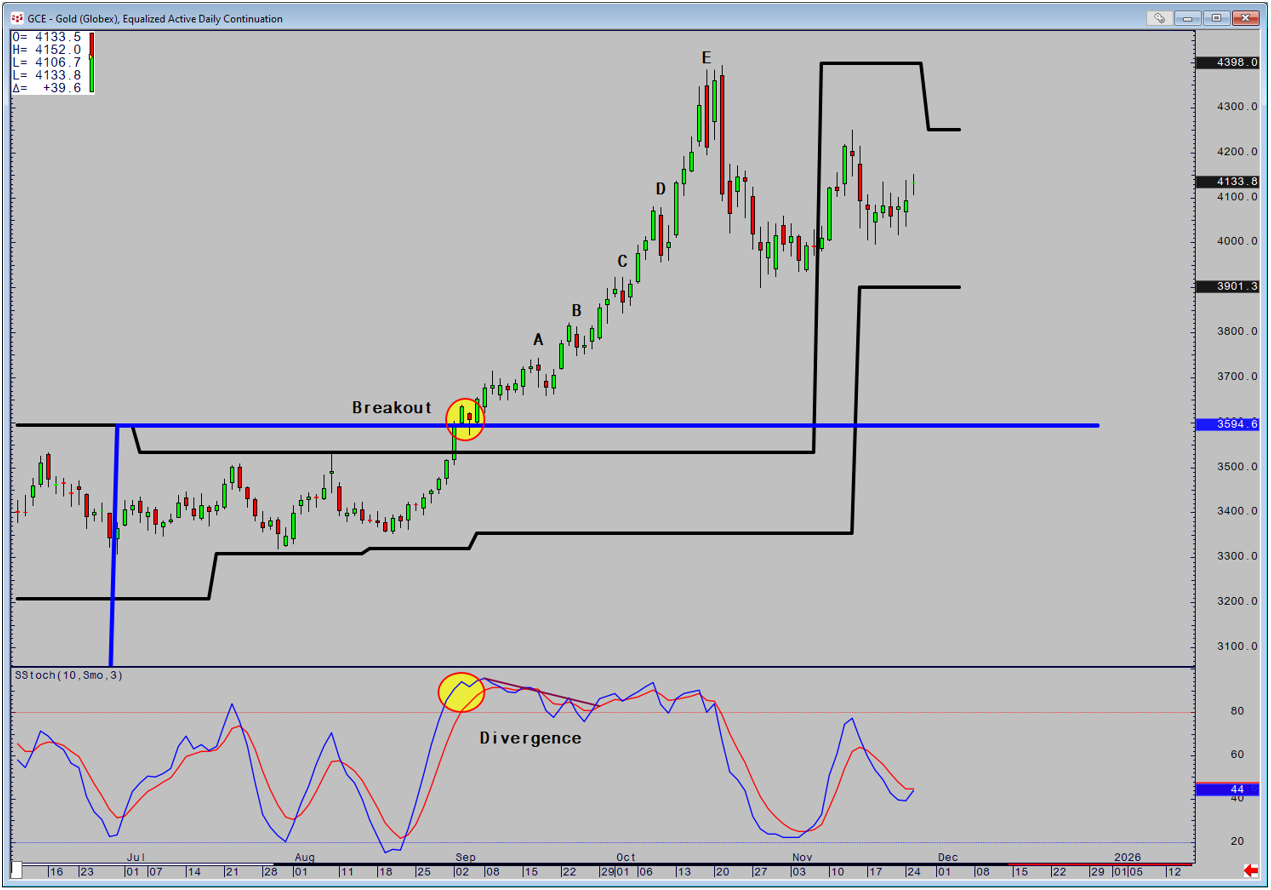
Traditionally, divergence is quantified by taking the relationship between the high in an uptrend and low in a downtrend and… more
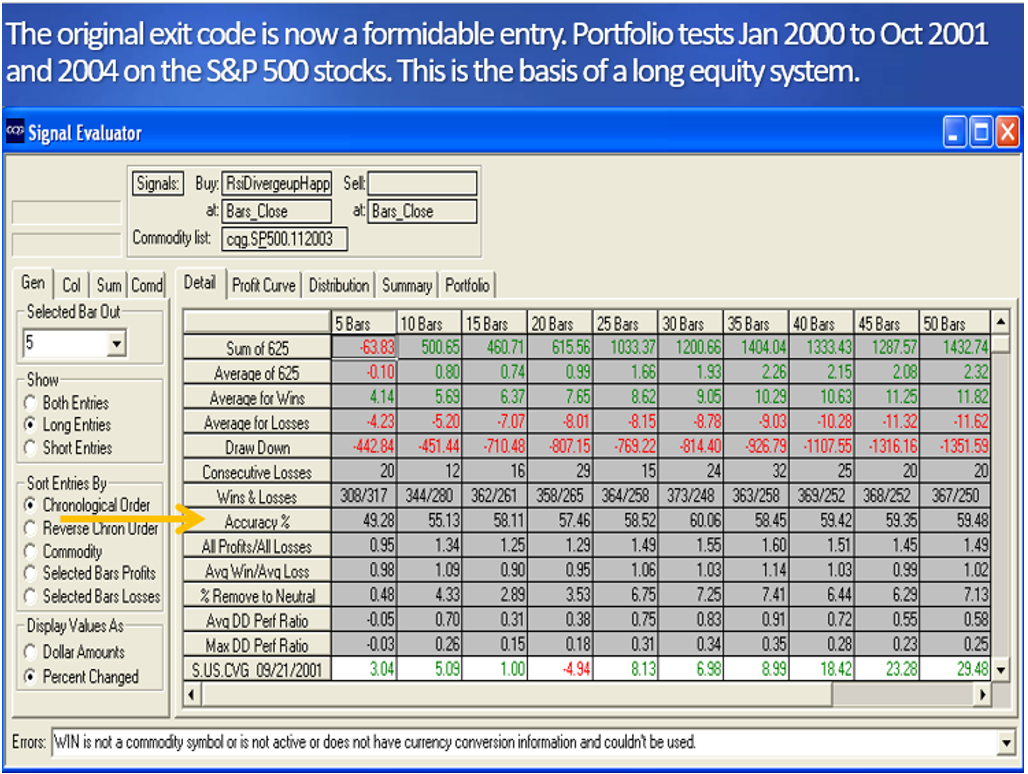
Read Quantifying Divergence Part 1Read Quantifying Divergence Part 3
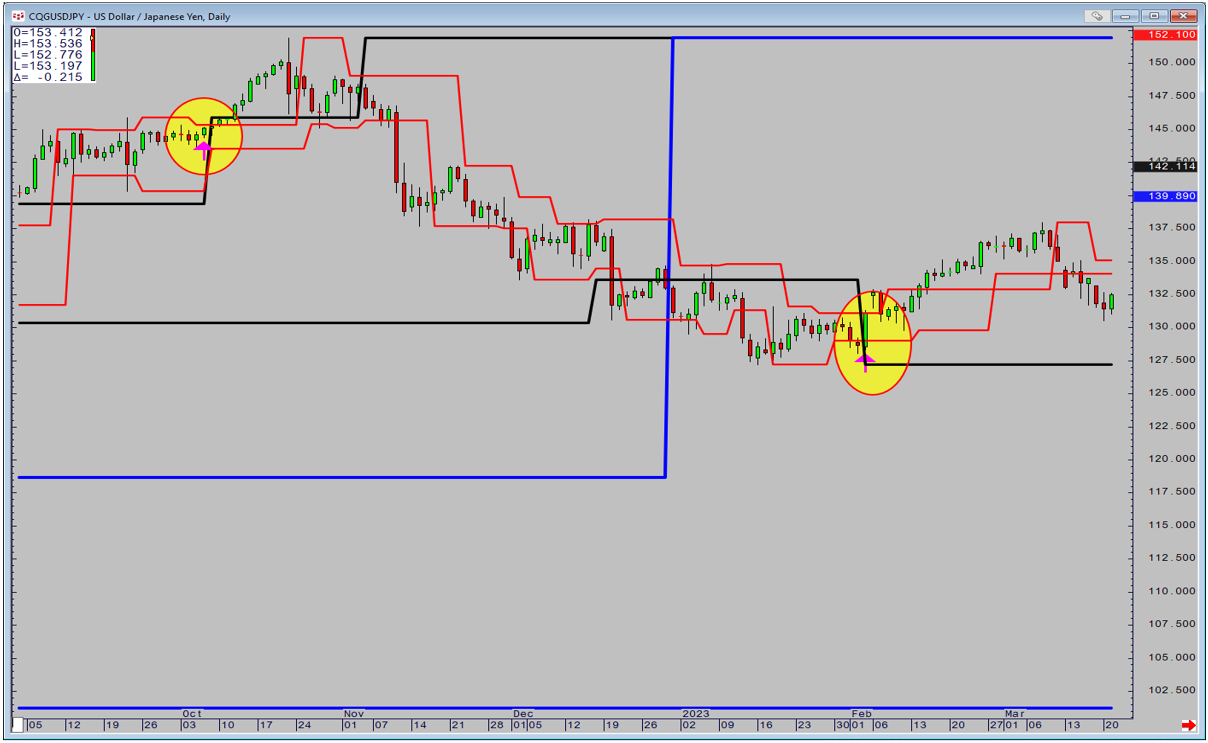
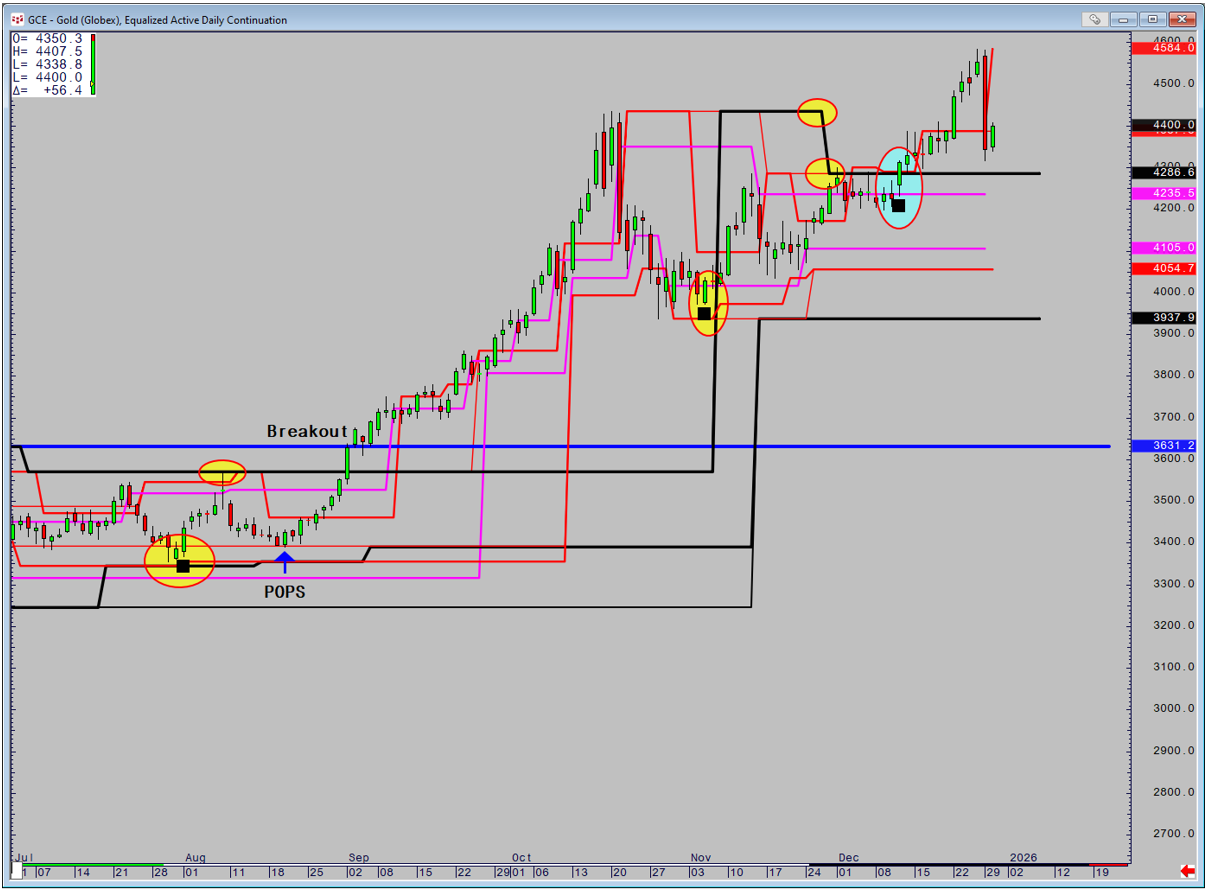
Whilst POPS (Price makes a nine-bar high, or low and the RSI makes a three-bar high or low) and UFO (Price makes a 9 Bar high… more
Read Quantifying Divergence Part 2Read Quantifying Divergence Part 3
Divergence can be likened to being able to see an eel in clear water. It's highly visible but try picking it up and holding on.… more
Definition
The average range for each bar's time of day is computed over a user-defined period. For example, on a 30-minute chart, the 12 p.m. bar has its range calculated over the last n days.… more