- Silver's parabolic rally ran out of steam in January 2026
- A bearish trend in February-June
- The 1980 high is the critical support level
- Holding above the support would be constructive
- Silver has a long history of shocking market participants
In 1995, together with three other traders at a leading U.S. financial institution, I accumulated a long position of 250 million ounces of silver at around $5 per ounce. The billion-dollar exposure raised more than a few eyebrows in the market and among regulators, leading to an accelerated liquidation that surprisingly, did little to move the price. A high-profile investor from Omaha purchased about half of the long position but sold it quickly for a profit. Meanwhile, it took around a decade for the price to double from $5, and in 2011, 16 years later, the price rose to nearly $50 per ounce, stopping short of the 1980 all-time high.
In 2025, silver took off to the upside, eclipsing the 2011 and 1980 highs, and the rally continued until late January 2026, when silver prices rose to a high of $121.875 per ounce, over 24 times the price paid for a quarter of a billion ounces in 1995. I learned a lot about silver and accumulating a massive, long position in 1995. Silver was inexpensive back then, but it got too expensive in early 2026 when the parabolic rally ran out of upside steam.
Silver's parabolic rally ran out of steam in January 2026
After decades of failed rallies, COMEX silver futures finally eclipsed the 1980 high of $50.36 per ounce in October 2025.
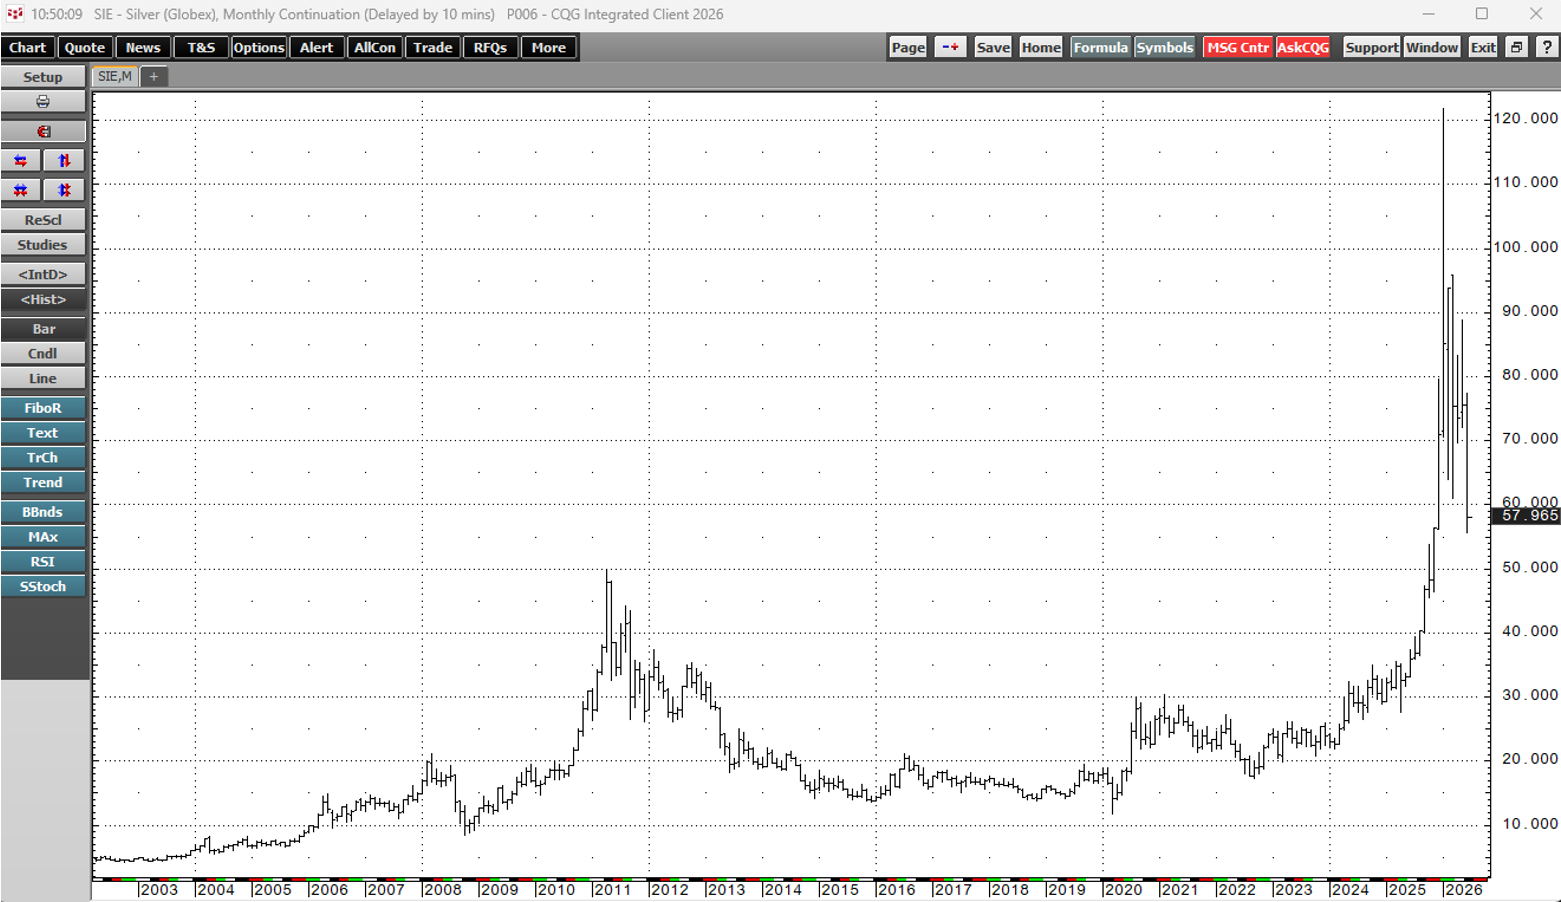
The monthly chart shows that silver futures exploded into a parabolic rally that took the price to more than double the 1980 high, with the peak coming on January 29, 2026, at $121.785 per ounce. Silver at over $120 proved unsustainable, and the price plunged.
A bearish trend in February-June
The chart of COMEX silver futures for July 2026 delivery shows that after reaching $124.25 on January 25, silver prices fell off a bearish cliff.
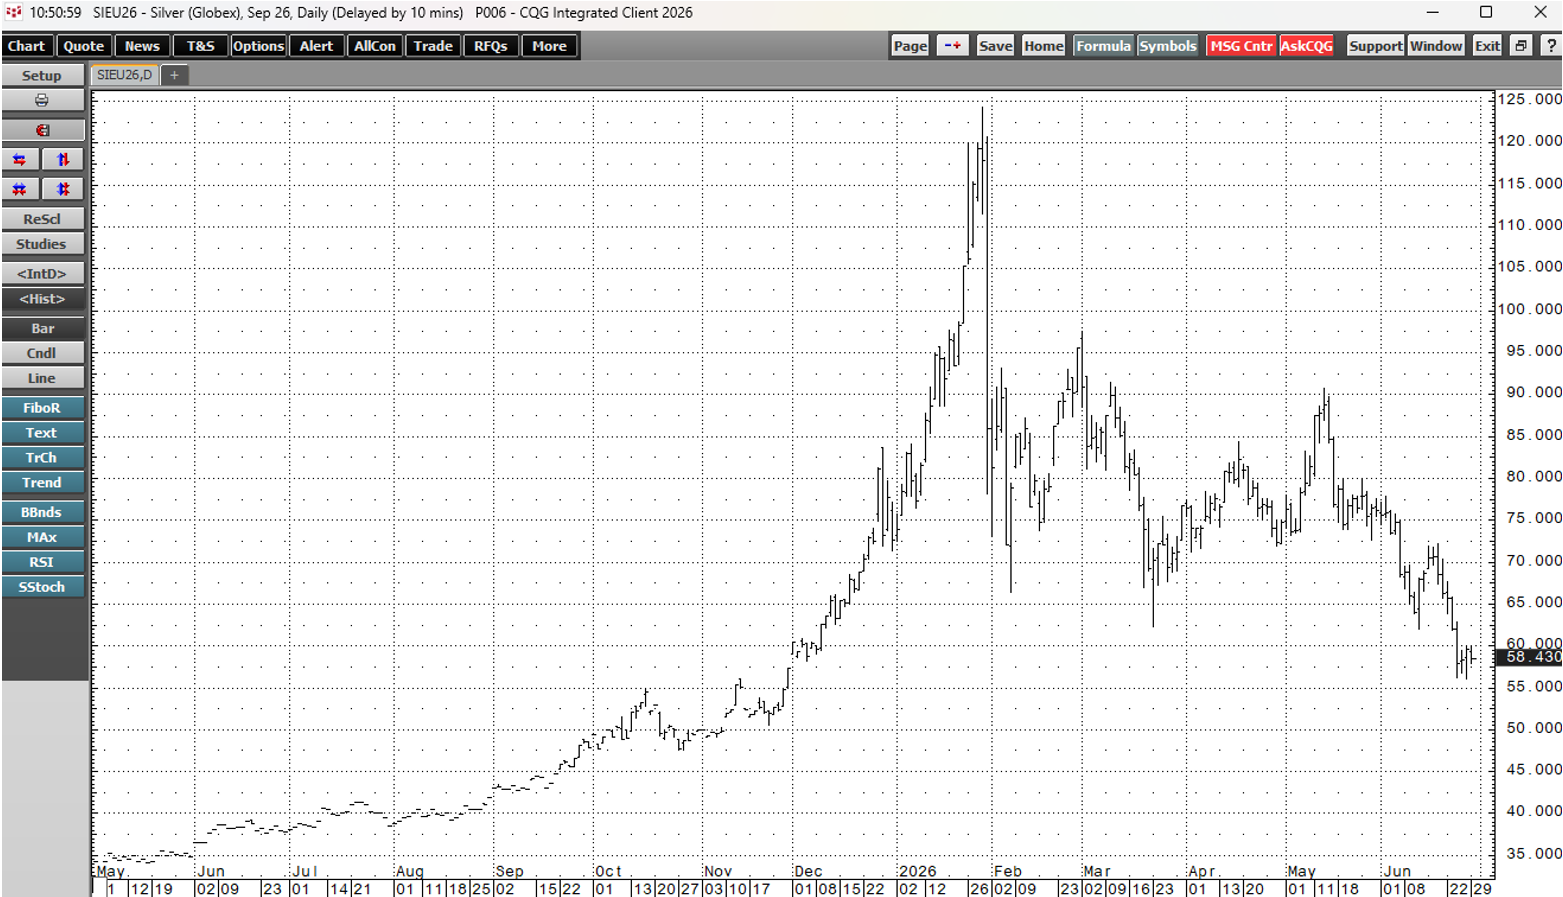
The daily chart shows that July silver futures initially fell 46.5% to $66.425 per ounce on February 6, 2026. After a recovery that took the price to a high of $97.555 on March 2, silver futures continued to make lower highs and lower lows, reaching their latest low of $56.13 per ounce on June 26.
The 1980 high is the critical support level
For decades, the 1980 high of $50.36 per ounce was silver's critical technical resistance level.
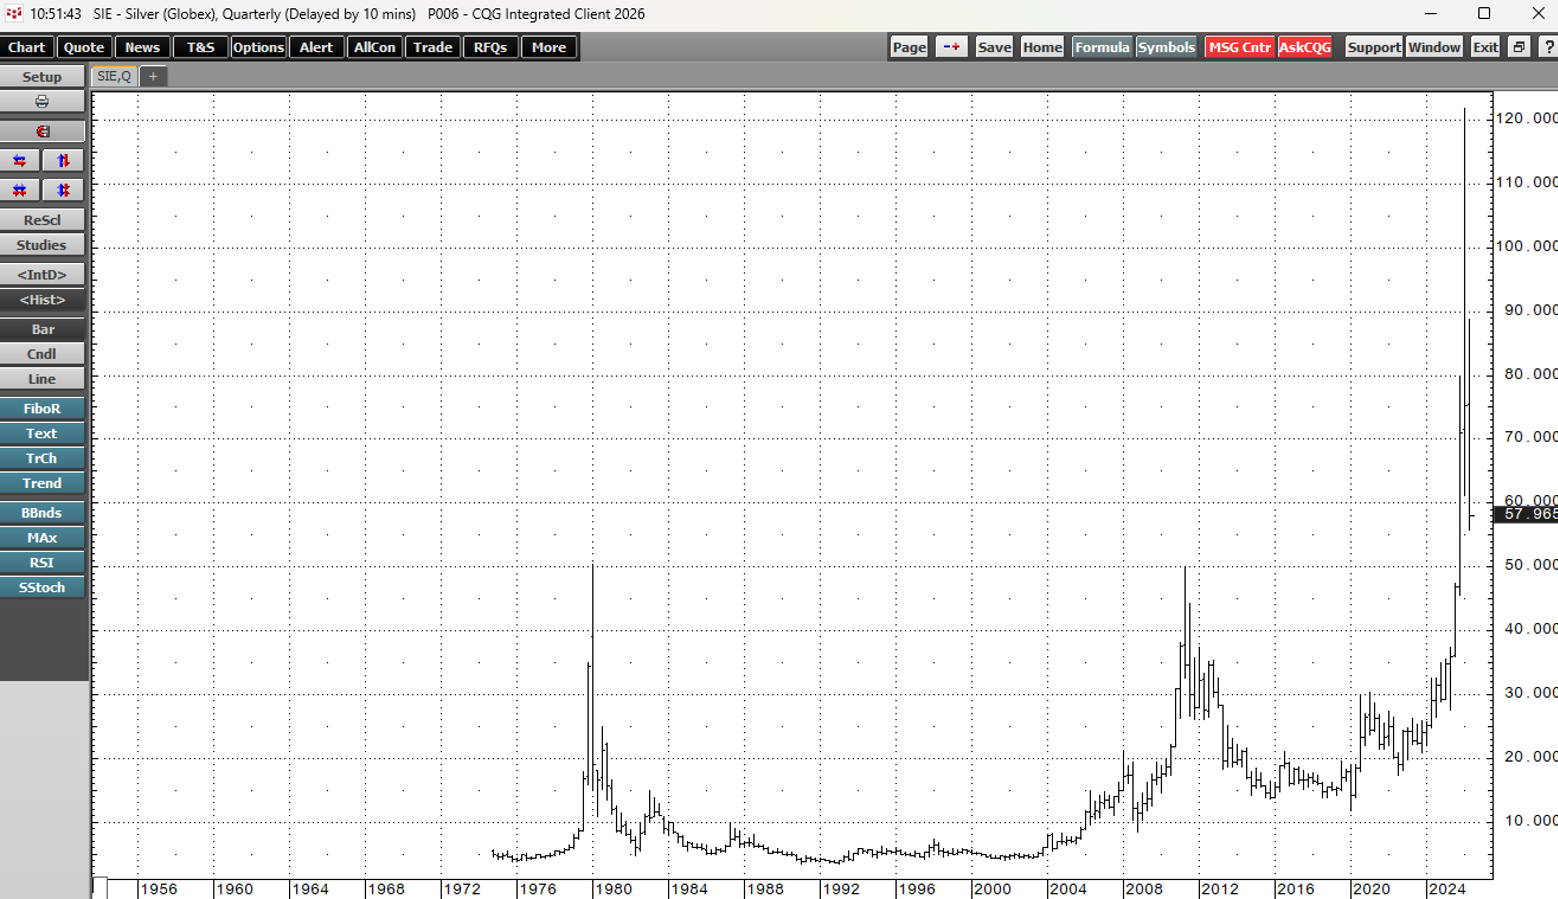
The quarterly chart shows that silver futures fell 54 cents short of the 1980 high in 2011 when the price reached $49.82 per ounce. It took another 14 years for silver to eclipse the resistance, which has become the crucial long-term support level. In late June 2026, silver is approaching a test of that support.
Holding above the support would be constructive
A higher low would be a positive technical development for the silver market, but it is not a guarantee. A break below $50.36 and the 2011 high of $49.82 could cause a wave of selling that drives silver prices substantially lower. However, holding above the 1980 high could set the stage for another leg higher in the silver market.
One thing to consider is that gold has corrected alongside silver, with the price dropping from over $5,600 per ounce in late January to around $4,040 per ounce in late June, after probing below $4,000 per ounce. Silver and gold have made new 2026 lows in June 2026. Silver's historical monthly volatility of 56.73% is nearly double gold's at 28.88%. We should expect more volatility in the silver futures market than in the gold futures market over the coming days and weeks. Meanwhile, leading financial institutions remain bullish on gold's prospects in 2026. JPMorgan Chase, a leading precious metals dealer, forecasts that gold prices will rise to $6,000 per ounce in 2026. The bullish view on gold cites continued Central Bank demand.
If gold takes off on the upside and rallies $2,000 from the recent low, silver will likely follow its precious cousin. However, JPMorgan and other financial institutions did not predict that gold and silver prices would rise to the levels seen in late January 2026 in the past years leading up to that date. Therefore, forecasts are not guaranteed, and many factors will determine the path of least resistance of gold and silver prices over the coming months and years.
Silver has a long history of shocking market participants
As I learned in 1995, when a quarter-of-a-billion-ounce silver purchase did not move the price appreciably, and the sale did not push prices significantly lower, silver is a deep market. Moreover, market sentiment and global economic factors, including, but not limited to interest rates, fiat currency values, and geopolitical events, are the primary drivers of precious metals prices.
Silver's penchant for volatility has led to significant moves. While the price reached $49.82 per ounce in 2011, it entered a bearish trend that drove the price down 76.4% to $11.74 in 2020. A similar move from the January 2026 high would take silver below $30 per ounce. The 1980 record high entered a bear market that took the price down 93% to $3.505 eleven years later, in 1991. Silver has a long history of shocking market participants. A similar move would take silver to $8.50 per ounce.
I have learned that there are no rules in the silver market and that the best strategy is to go with the flow until it slows. In June 2026, price action is heading for a test of support just over $50 per ounce. Trend following is likely optimal in the current environment.