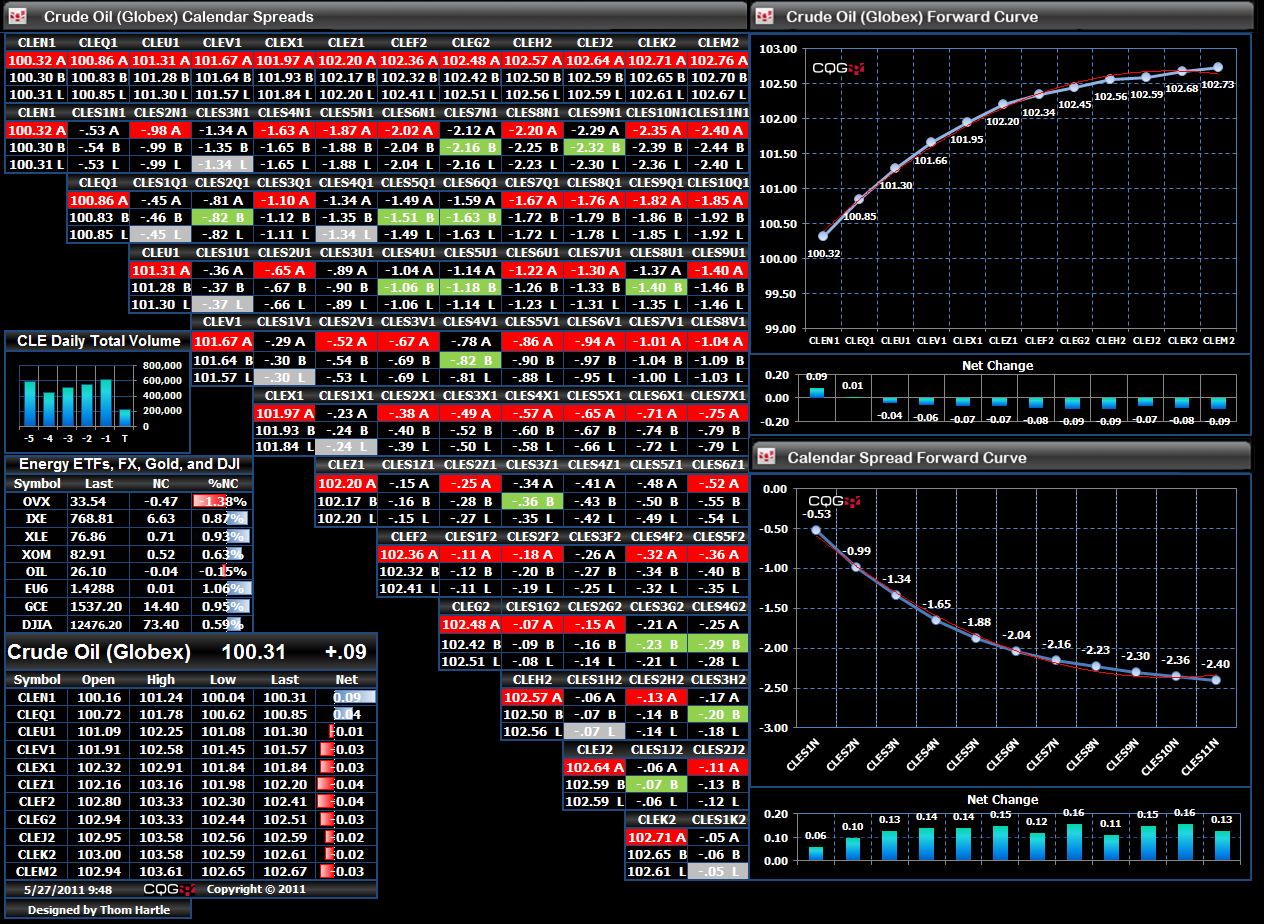
When designing spreadsheets to visualize the markets, it is tempting to title rows and columns, but then you have to scan top to bottom and left to right to identify exactly what you are viewing. This isn't a problem when the quote display is small. But for larger displays, it can be confusing.
Microsoft Excel includes a function that allows you to merge data with text for the display. For example, if a cell displays the ask price, you can merge the letter A with the displayed ask price so you know it is the ask price, i.e. "112.20 A."
To merge market data with text, first convert the RTD function to text using the TEXT function: TEXT(value, format_text). Use the RTD function for "value" and use "#.00" for "format_text" for two decimal places. As an example, here is the formula to convert the ask price for the lead crude oil contract to text with two decimal places:
=TEXT(RTD("cqg.rtd",,"ContractData","CLE?1","Ask"),"#.00")Use the ampersand symbol (&) to merge the letter A:
=TEXT(RTD("cqg.rtd",,"ContractData","CLE?1","Ask"),"#.00")&" "&"A"Notice, there is an extra &" " to include a space between the ask price and the letter A.
Looking at this Spread Matrix of exchange-traded calendar spreads would be much harder if you had to scan across rows to determine if the price was an ask, bid, or last price. Merging the appropriate letter -- A, B, or L -- with the price makes data visualization more effective.
