This is a quick-start guide to building your own trading system based on the Super Template. The Super Template comes pre-installed with CQG Integrated Client. As a basic example, we will create a… more
CQG PAC Files
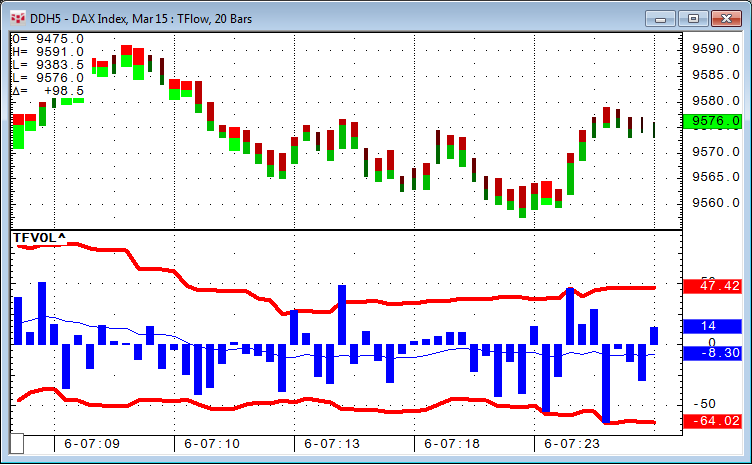
CQG provides the ability to separate volume into trades executed at the best bid price and trades executed at the best ask price. This feature gives you more insight into market action because you… more
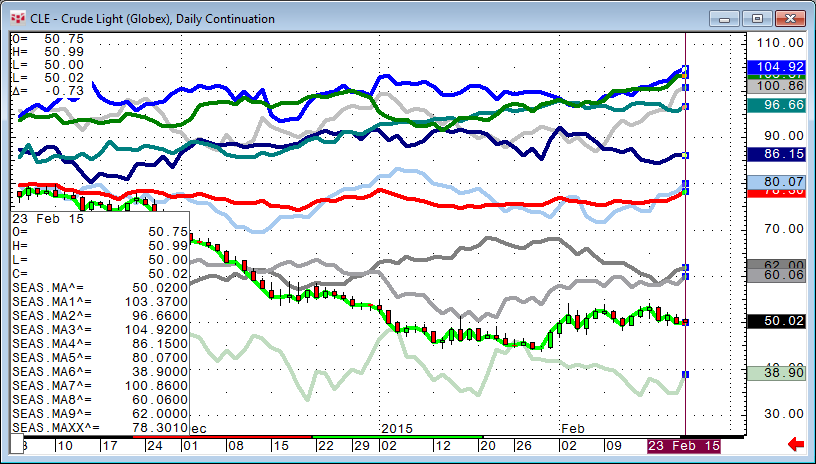
Quite some while ago I showed, in a very simple way, how to overlay 2011, 2012, 2013, and 2014 data in one chart. I created two very simple code snippets to accomplish that.
This time, I… more
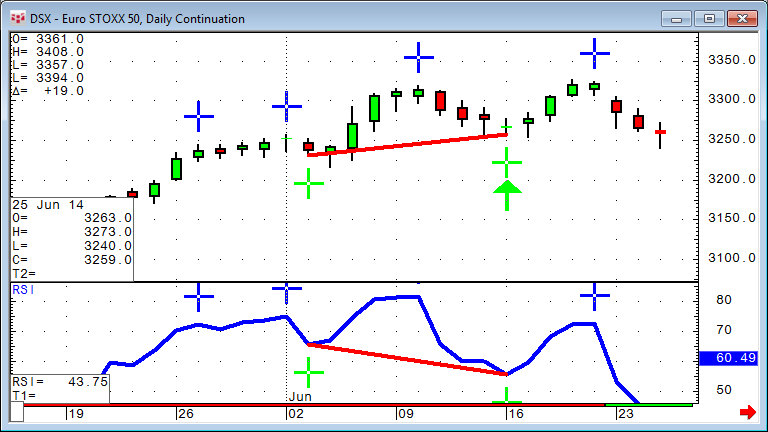
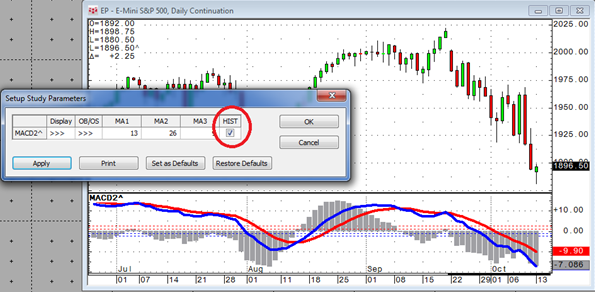
A couple of months ago we looked into CQG's built-in Divergence Index and how to use it.
Following up on this topic, I want to show a much simpler approach using the Formula Toolbox.
… more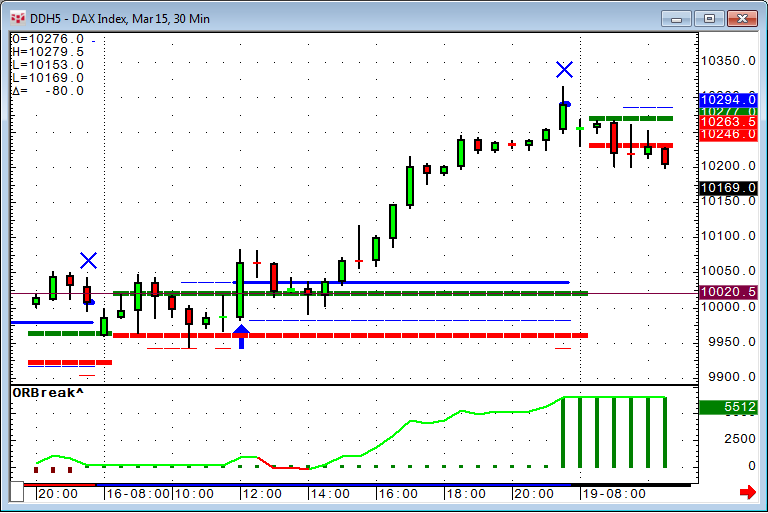
One of the theories behind Market Profile®* is the opening trading range. This is the high and the low from the first hour of trading. We want to create a trading system around that and use the… more
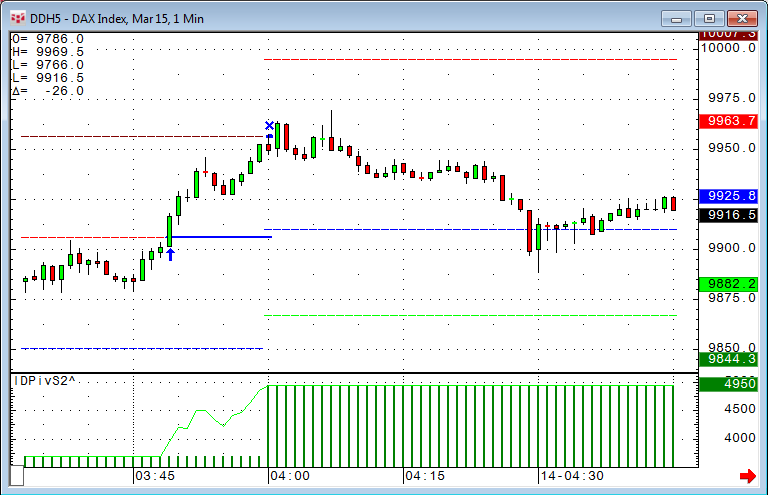
In this article we take a look at two examples where trades are placed on or around significant lines. The first idea is to change the classic daily pivot lines into intraday pivot lines and trade… more
Recently, we had a request to show, in real time, how many contracts are available on the buy and sell side in the order book. This can be accomplished with a very simple study: DOM Ask Volume (… more
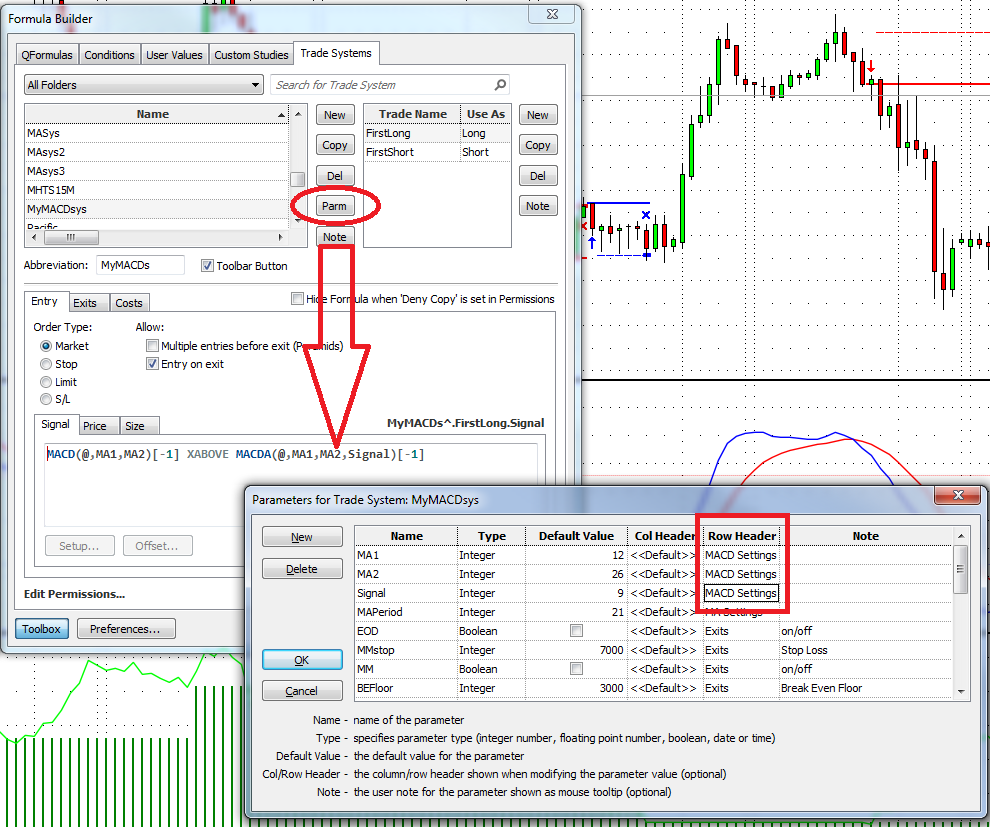
CQG's Formula Builder Toolbox gives you the ability to use parameters (variables) inside your CQG code in order to control studies, conditions, and trade systems externally without the need to… more
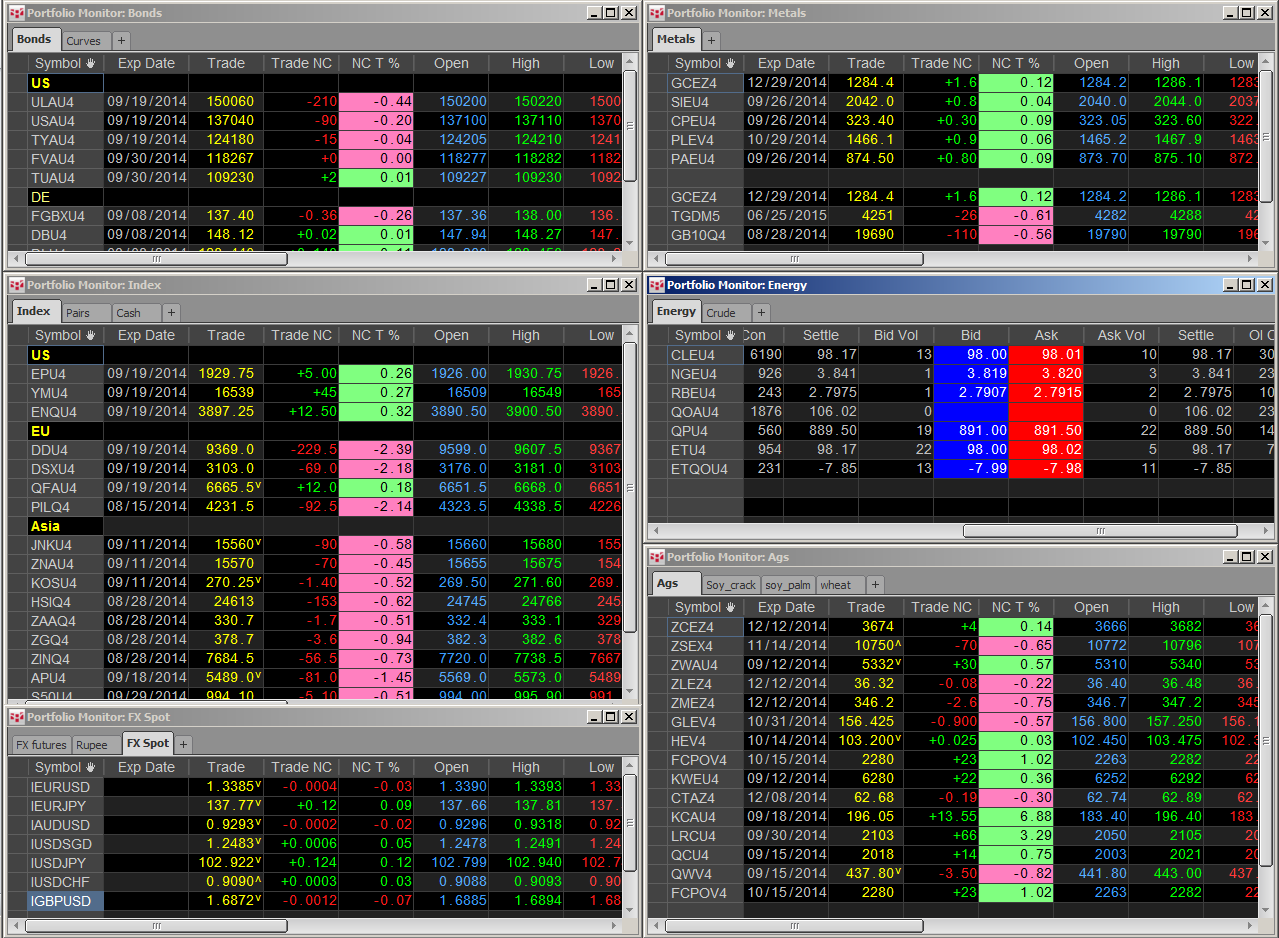
This component pac provides an overview of global market activity across multiple asset classes, grouped in separate Portfolio Monitor windows. Columns are intuitively color-coded to identify both… more

Powered by CQG FX, this Microsoft Excel® dashboard measures volatility by using the difference between the upper and lower Bollinger Bands and dividing the difference by the Moving Average. The… more