This is a collection of frequently requested studies, which are not part of CQG’S standard offering. These studies are open source and detailed descriptions can be easily found on the internet.… more
CQG PAC Files
Updated July 24, 2025
Bring Updating Time-Series Data from Microsoft Excel® Into CQGThe XL Real-Time study is included in CQGIC subscriptions enabled for CQG Trading, or Spreader, as well as… more
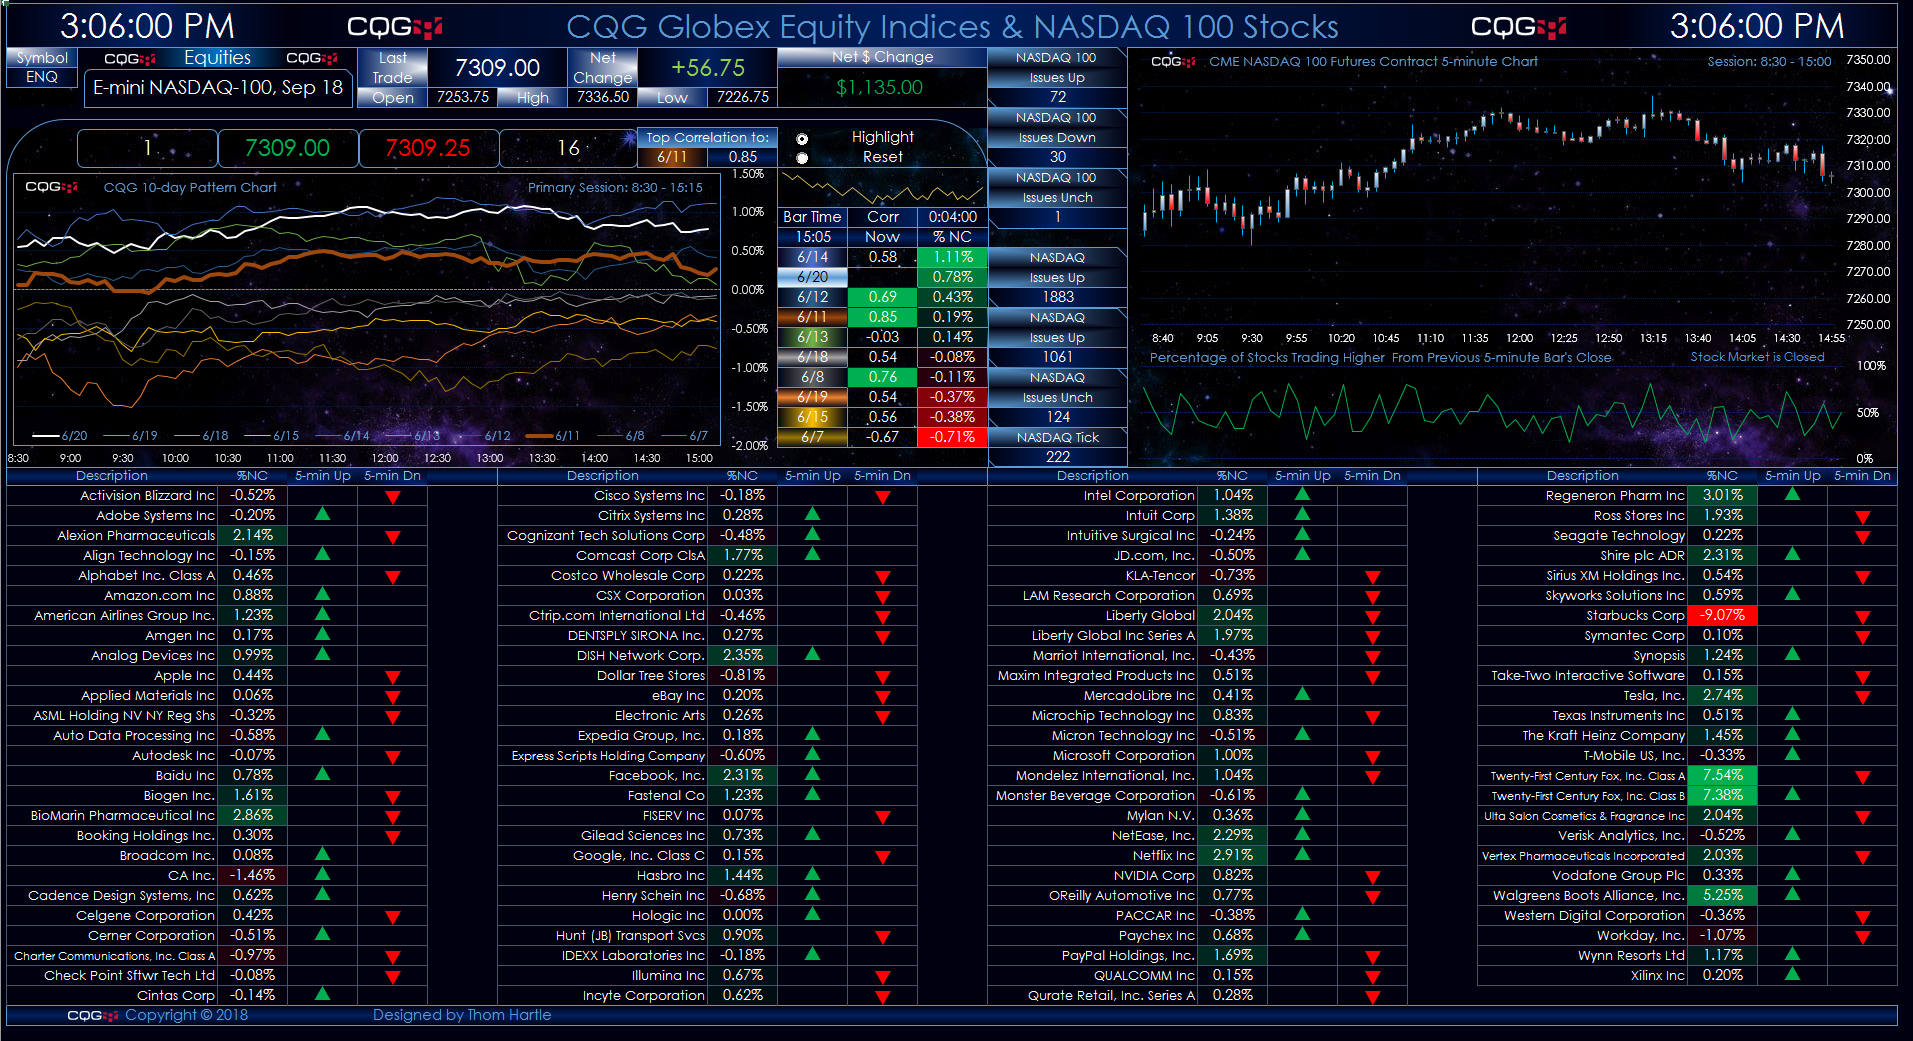
This Microsoft Excel® dashboard presents two charts of the Nasdaq-100 futures contract and market data for the one hundred stocks that are constituents of the Nasdaq 100 Index.
… more
CQG customers who create their own custom studies can easily use RTD to pull custom study values into Excel.
There are only two unique requirements in the RTD formula for a custom study:… more
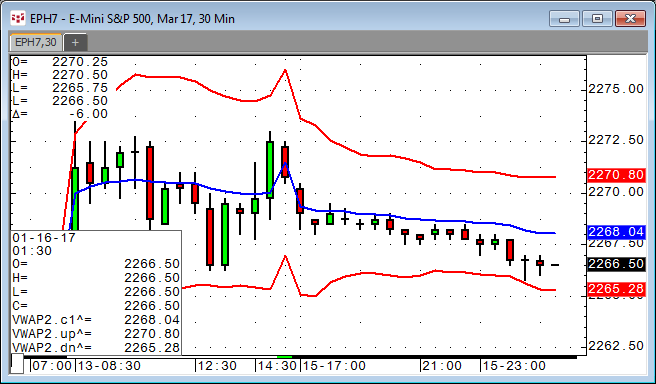
Here is a special version of the Volume-Weighted Average Price (VWAP) study including standard deviation bands.
VWAP is the volume-weighted average price for a futures contract… more
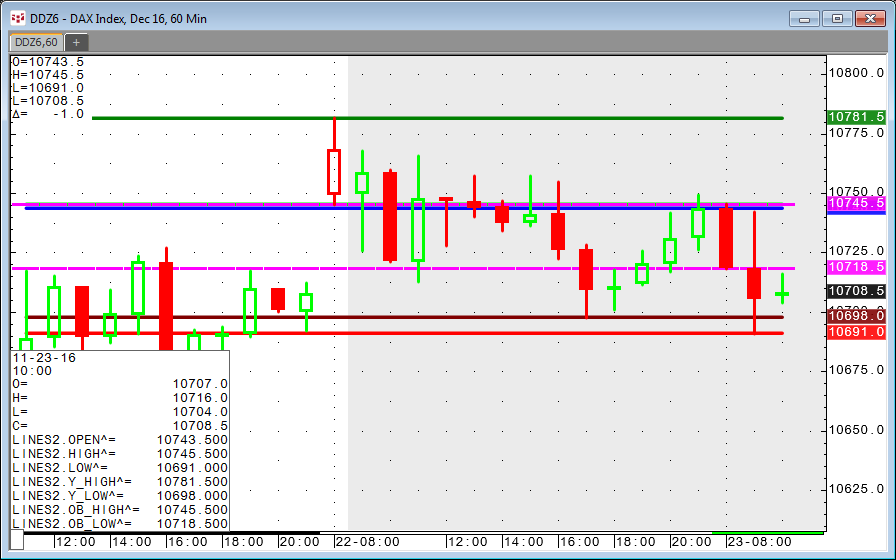
This custom study produces seven horizontal lines on a chart: today's open, high, and low; yesterday’s high and low; and today’s high and low for the opening balance. We often receive… more
The component pac at the end of this article contains holdings or components of eleven SPDR ETF portfolios. You can use a portfolio to create a quote page… more
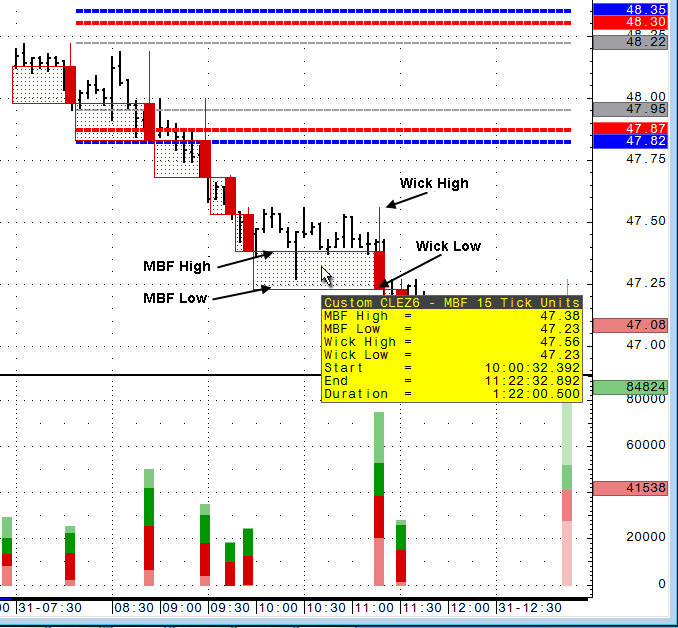
Mark B. Fisher, founder and CEO of MBF Clearing Corp, discussed his chart and study during a joint webinar with CQG. This article further explains the study and chart type,… more
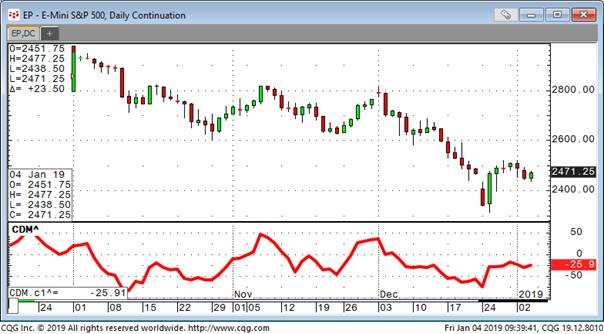
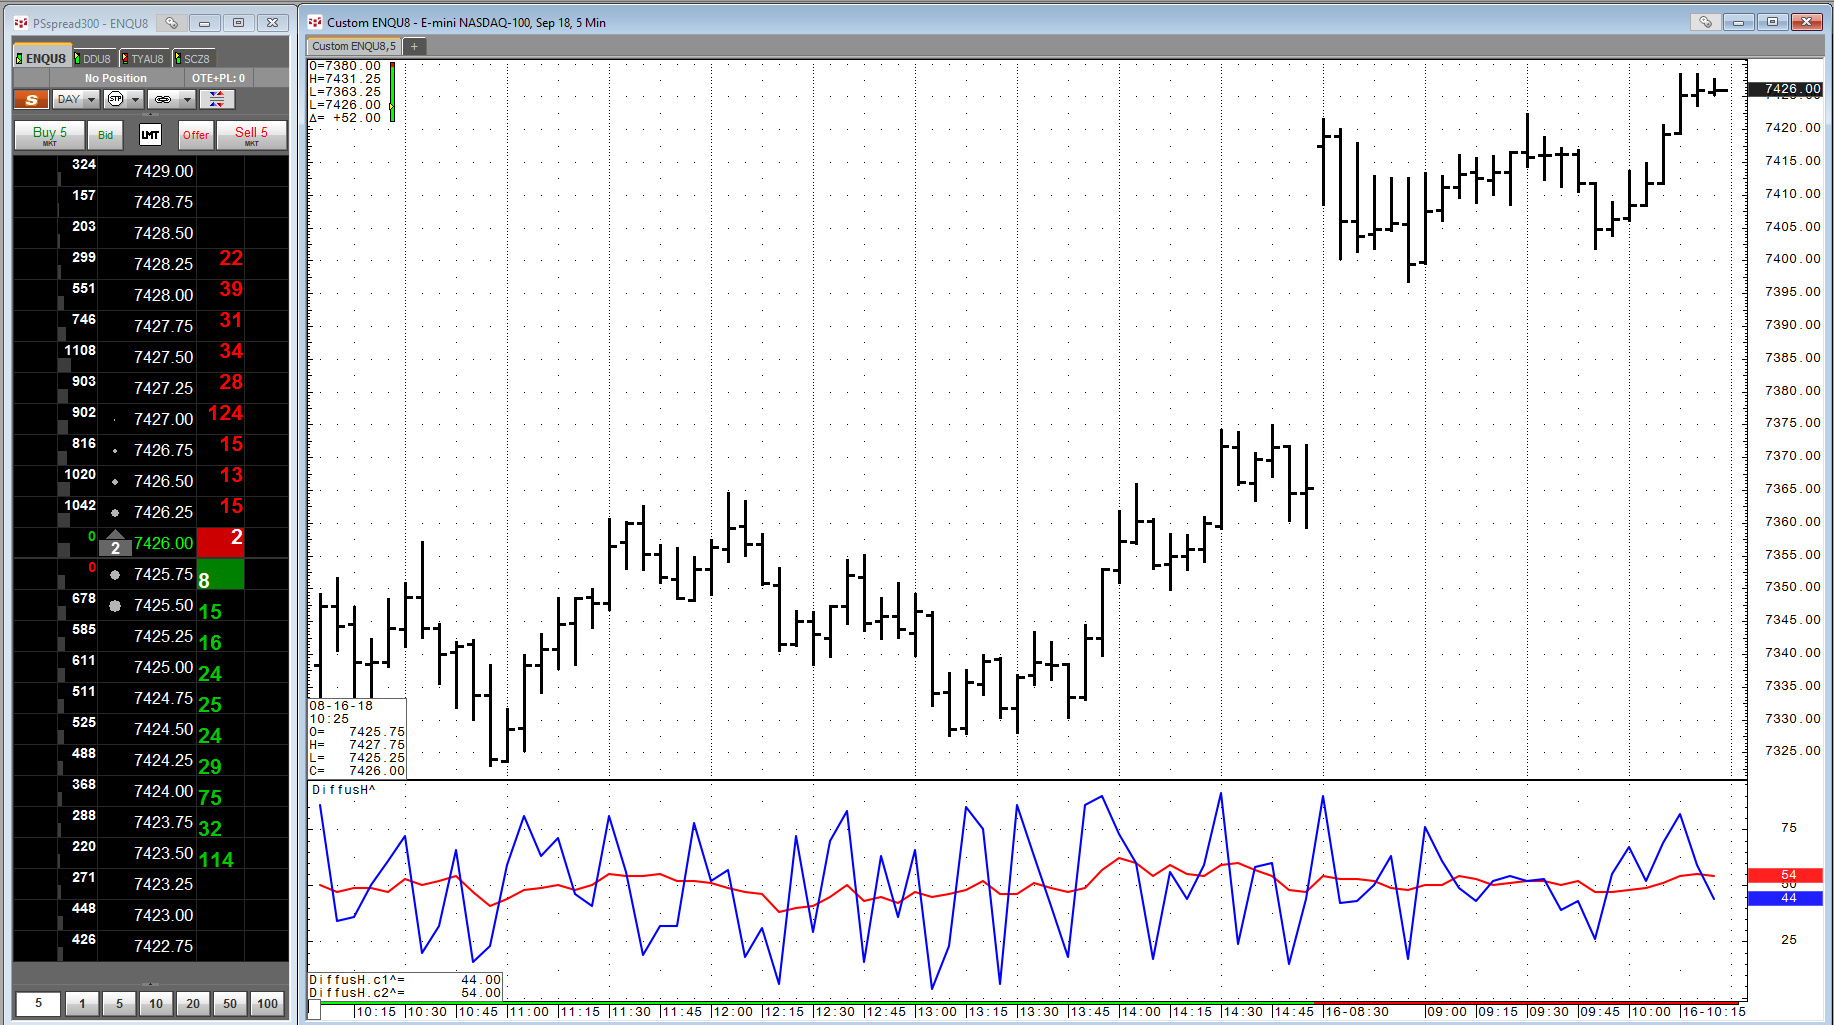
CQG provides the ability to separate volume into trades executed at the best bid price and trades executed at the best ask price. This feature gives you more insight into market action because you… more
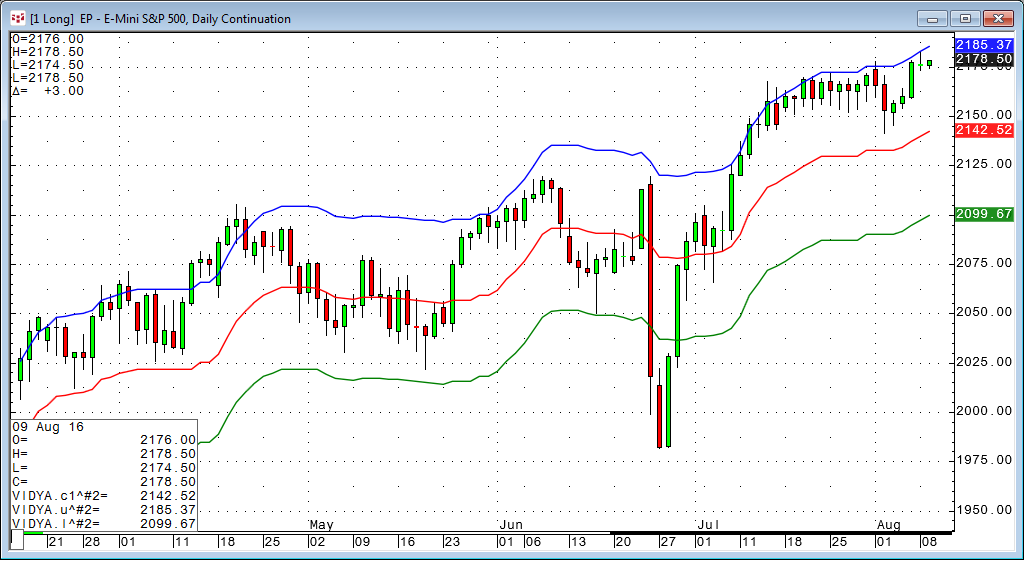
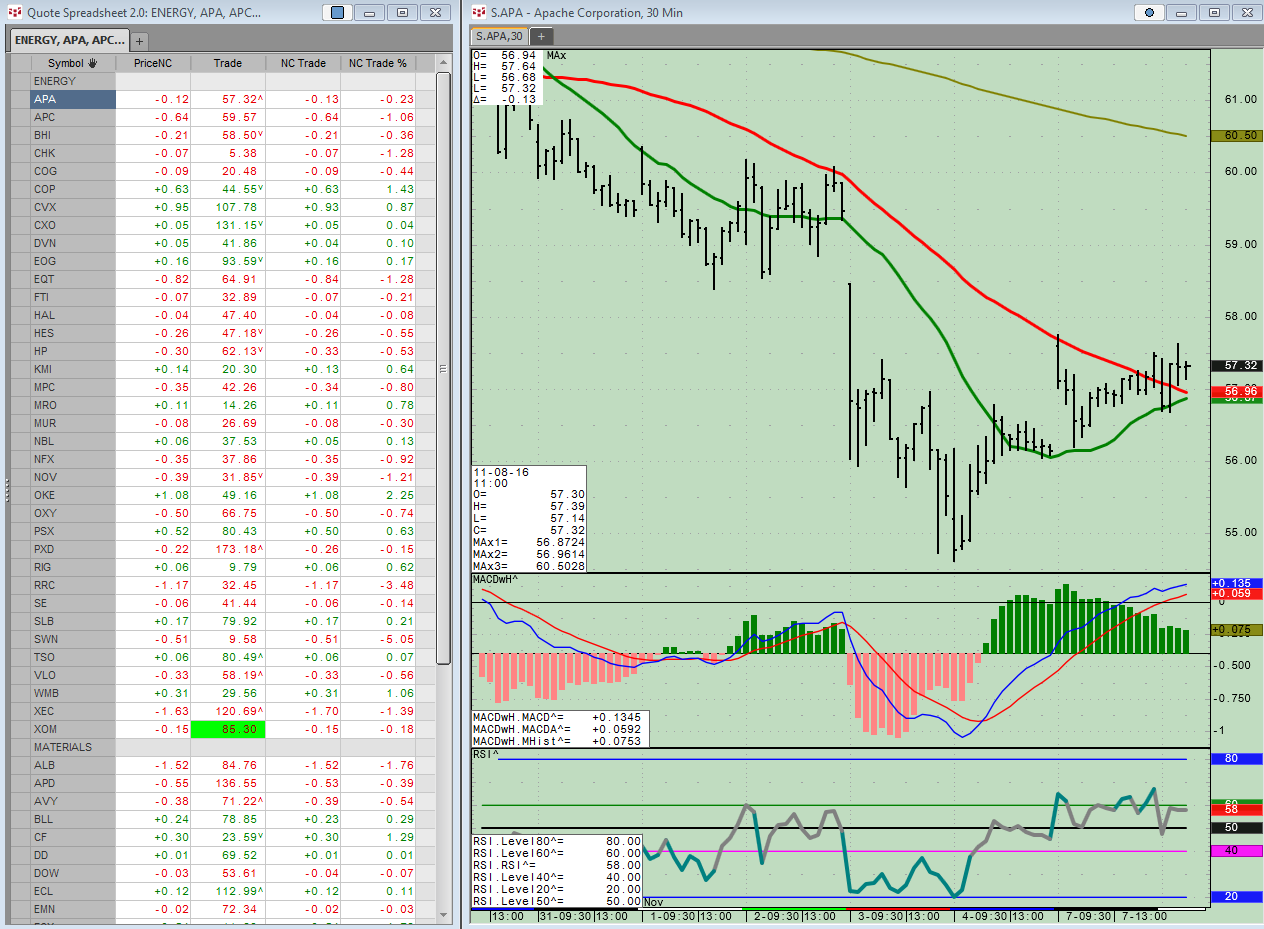
Chande's Variable Index Dynamic Average (VIDYA) is similar to the Exponential Moving Average (EMA), but automatically adjusts the smoothing weight based on price volatility.
VIDYA was… more