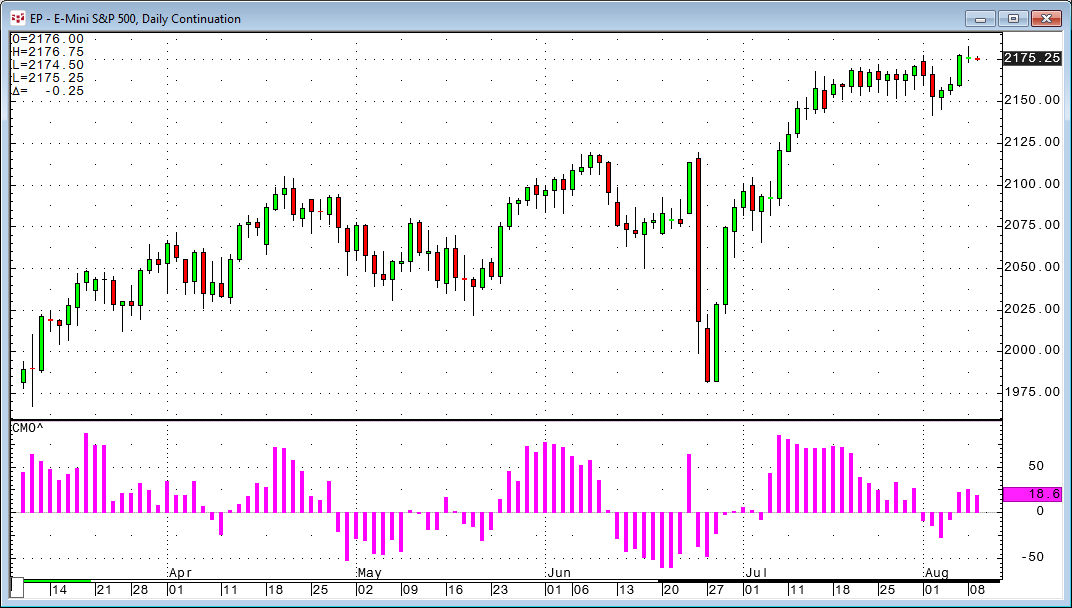
A technical momentum indicator invented by the analyst Tushar Chande.
The Chande Momentum Oscillator is created by calculating the difference between the sum of all recent gains and the sum… more
A technical momentum indicator invented by the analyst Tushar Chande.
The Chande Momentum Oscillator is created by calculating the difference between the sum of all recent gains and the sum… more
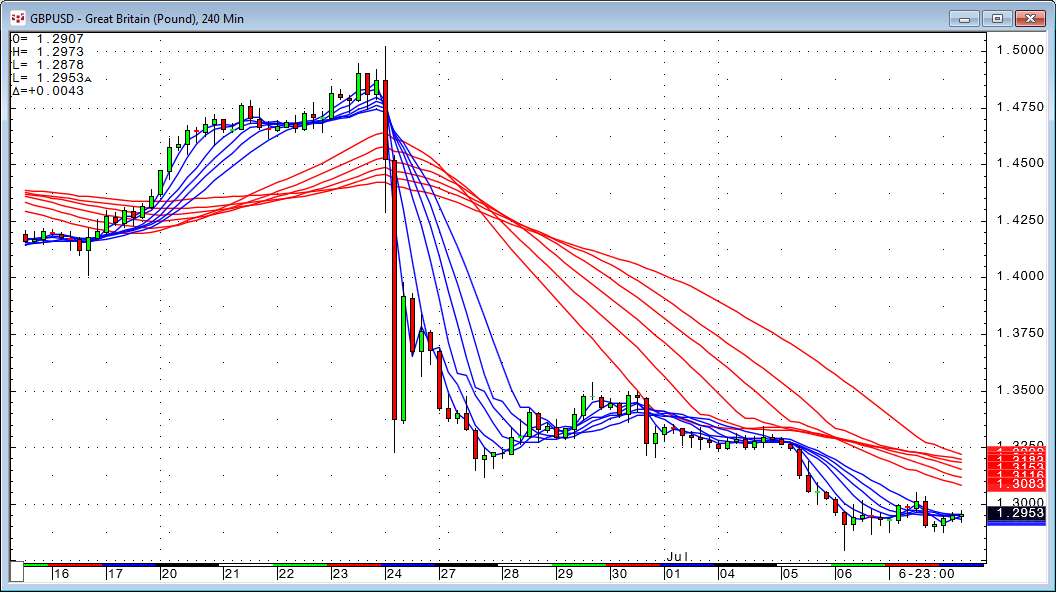
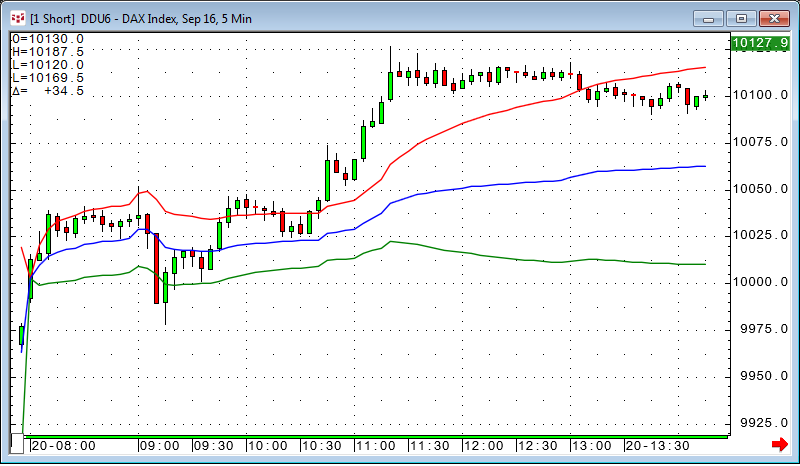
The Guppy is an indicator used in technical analysis to identify changing trends. The technique is based on combining two groups of moving averages with differing time periods.
One set of… more
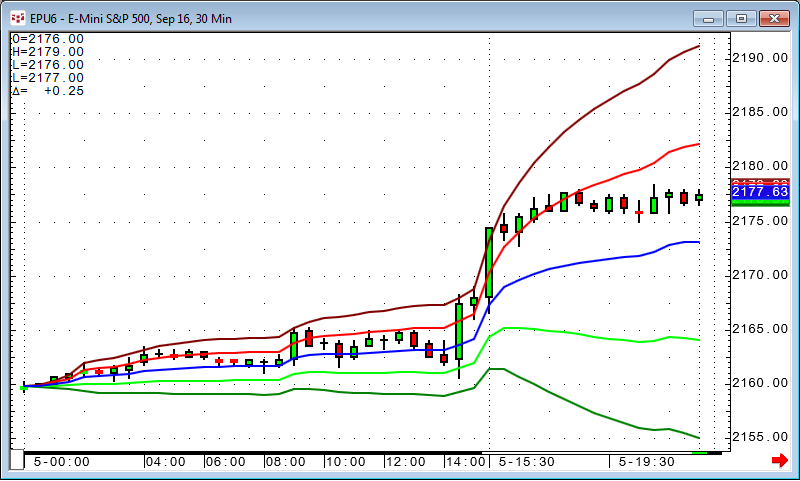
Volume-Weighted Average Price with Bands
VWAP is the volume-weighted average price for a futures contract plotted as a line on the price chart. The calculation is the sum of traded volume,… more
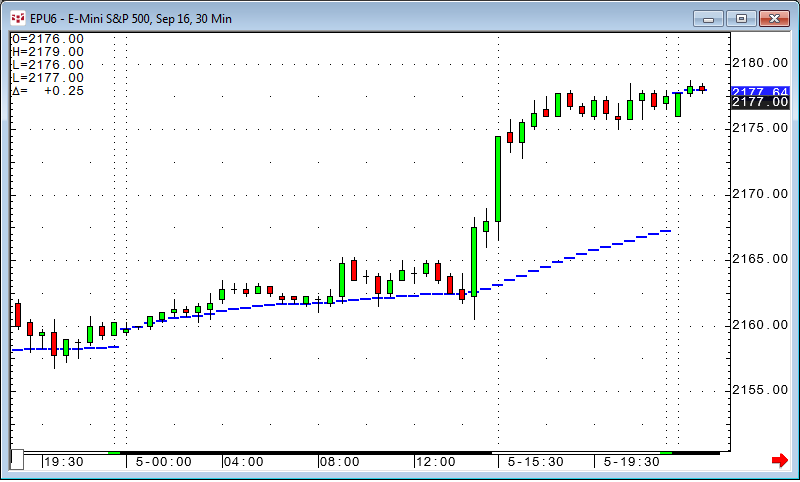
Flexible Period Moving Average
The Fluid indicator is only used for intraday charts. The idea is to have a moving average with a length that corresponds to the number of bars… more
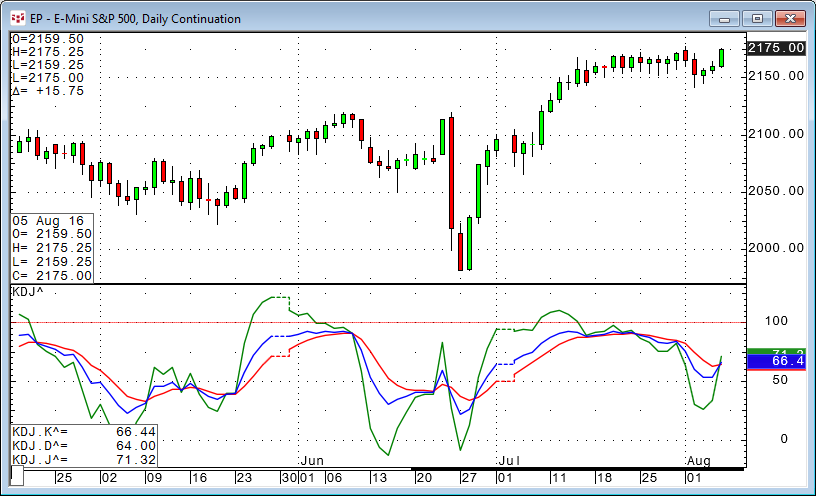
The SSK indicator using a divergence line
The KDJ indicator is actually a derived form of the Slow Stochastic with the only difference being an extra line called the J line. The J line… more
If you build your own indicators, you may have been stuck feeding your own calculation back into a study parameter. The CQG front-end does not allow this directly, but we have a smart workaround… more
The Guppy is an indicator used in technical analysis to identify changing trends. The technique is based on combining two groups of moving averages with differing time periods.
One set of… more
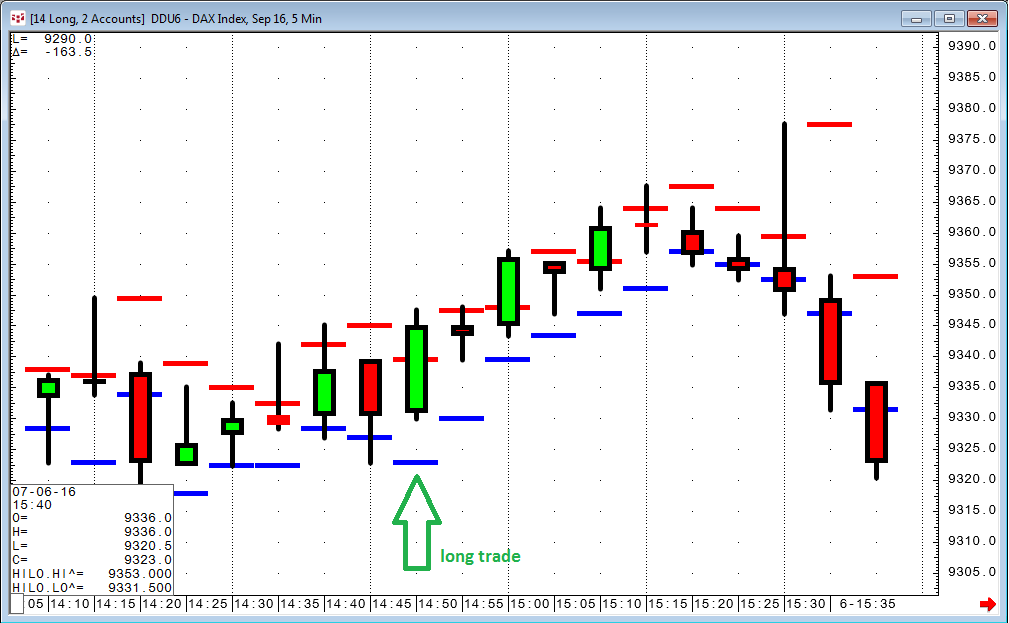
Sometimes it is not necessary to write a complex trading system when you want to accomplish something minor in the trading environment. For example, CQG provides built-in trailing stop… more
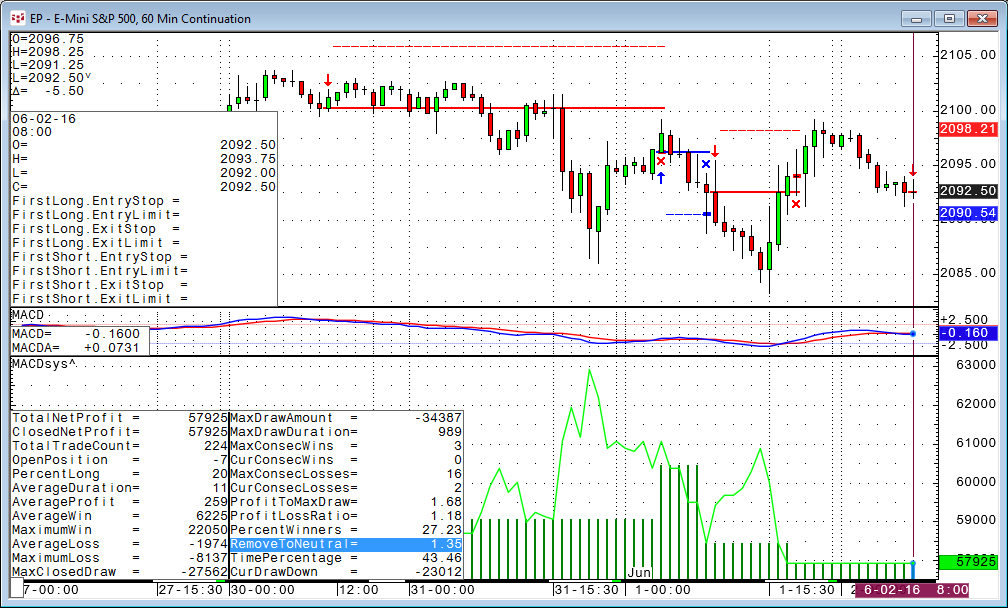
In my last blog post we turned the Super Template AMA trading system into a new trading system using MACD with a few steps. At first glance it seemed to be a losing system, but after we applied a… more
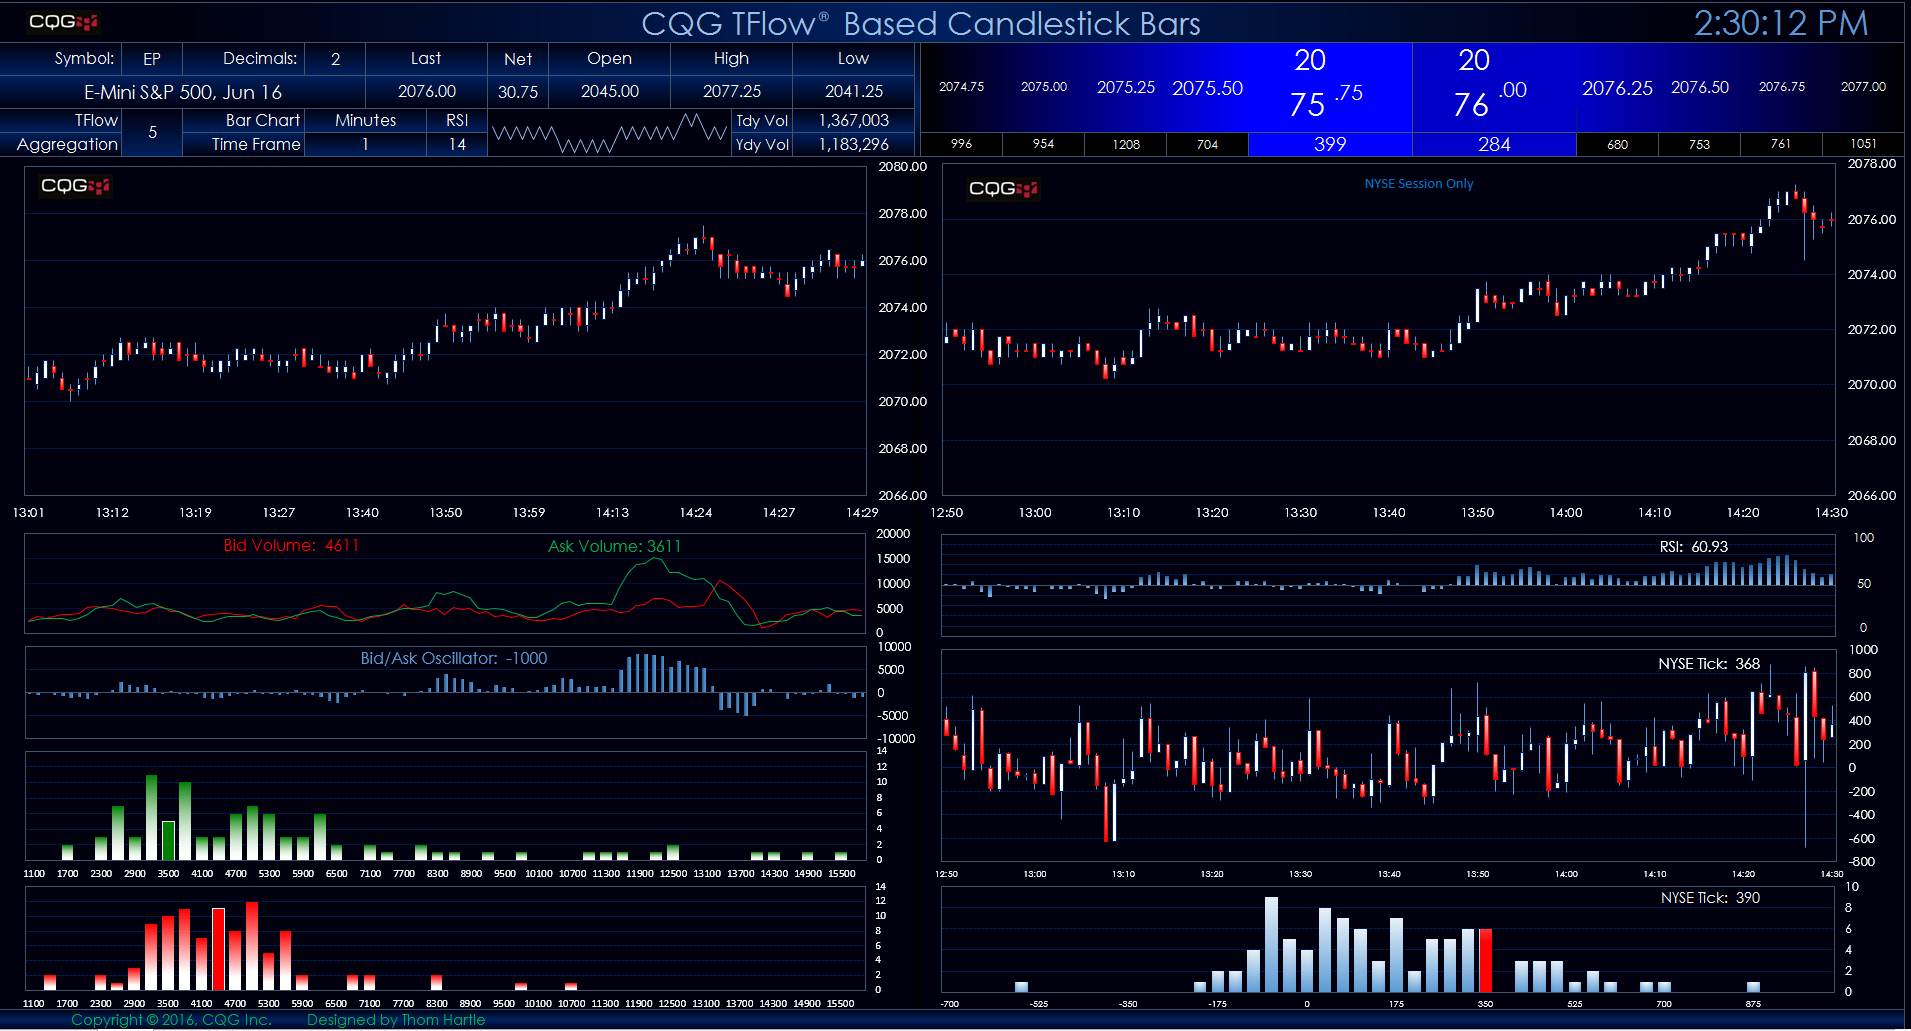
This Microsoft Excel® spreadsheet presents two views of the E-mini S&P contract. The left-hand view displays candlestick bars using CQG’s proprietary TFlow chart data. You can use the… more