It has been a while since I introduced the Super Template as a shortcut to build trading system inside CQG. In a nutshell, the Super Template is a trading system ready to run, that has a long and… more
CQG PAC Files
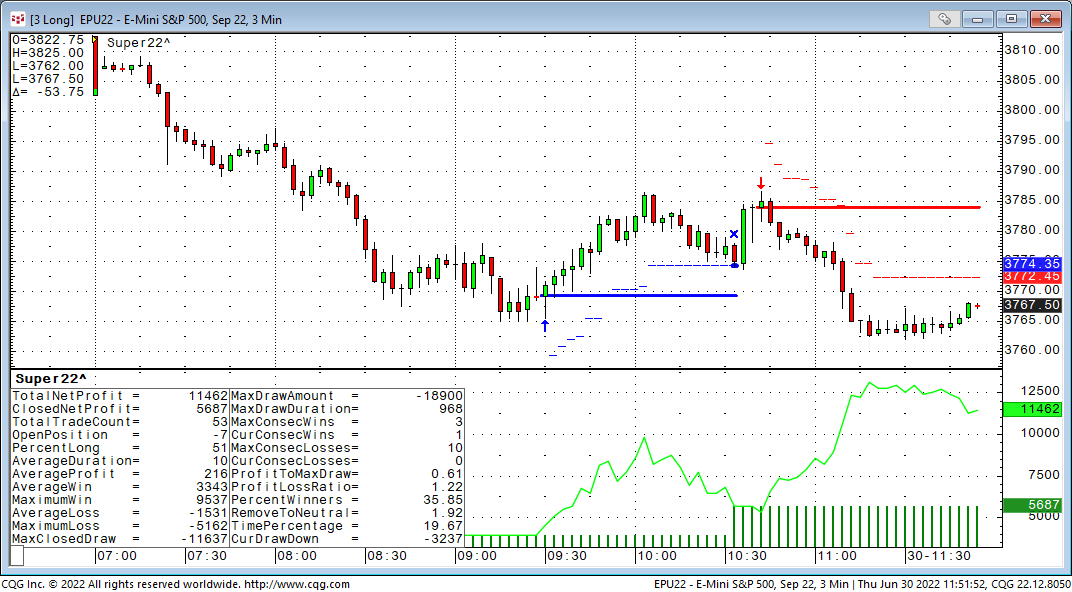
It has been a while since I introduced the Super Template as a shortcut to build trading system inside CQG. In a nutshell, the Super Template is a trading system ready to run, that has a long and… more
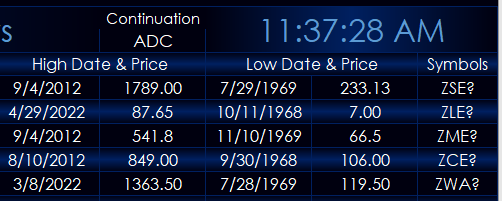
This post details a custom CQG study for pulling a market’s all time high price and date and the market’s all time low price and date.
The custom study was built by CQG’s Product Specialist… more
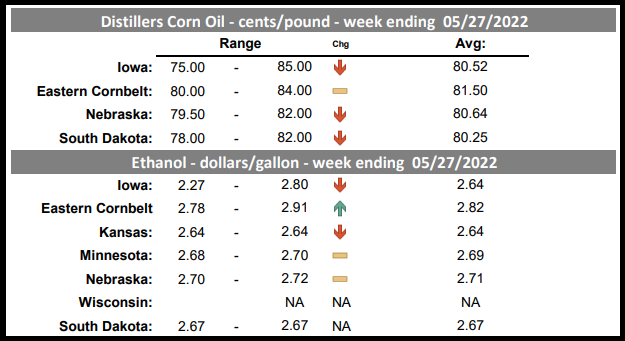
The CQG Data Quality Team has added the USDA Daily Ethanol Report found under USDA in the CQG Symbol Finder. Thirty-four new symbols are available. At the bottom of the post is a CQG PAC that… more
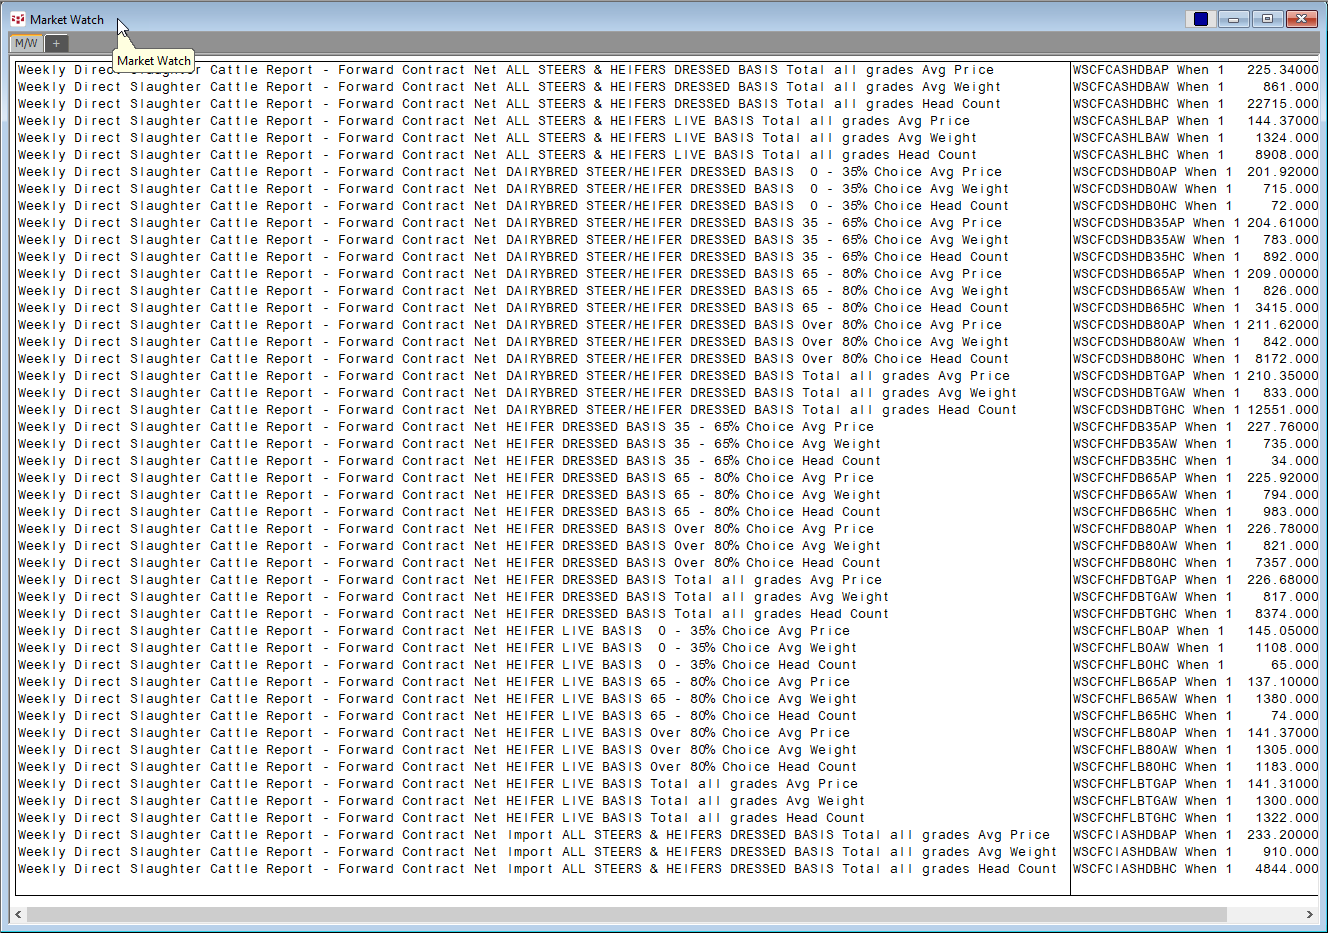
The CQG Data Quality Team has added over 1,000 USDA Cattle Market reports. The symbols are found under the USDA-WASDE group in the CQG Symbol Finder when searching for Cattle.
In… more
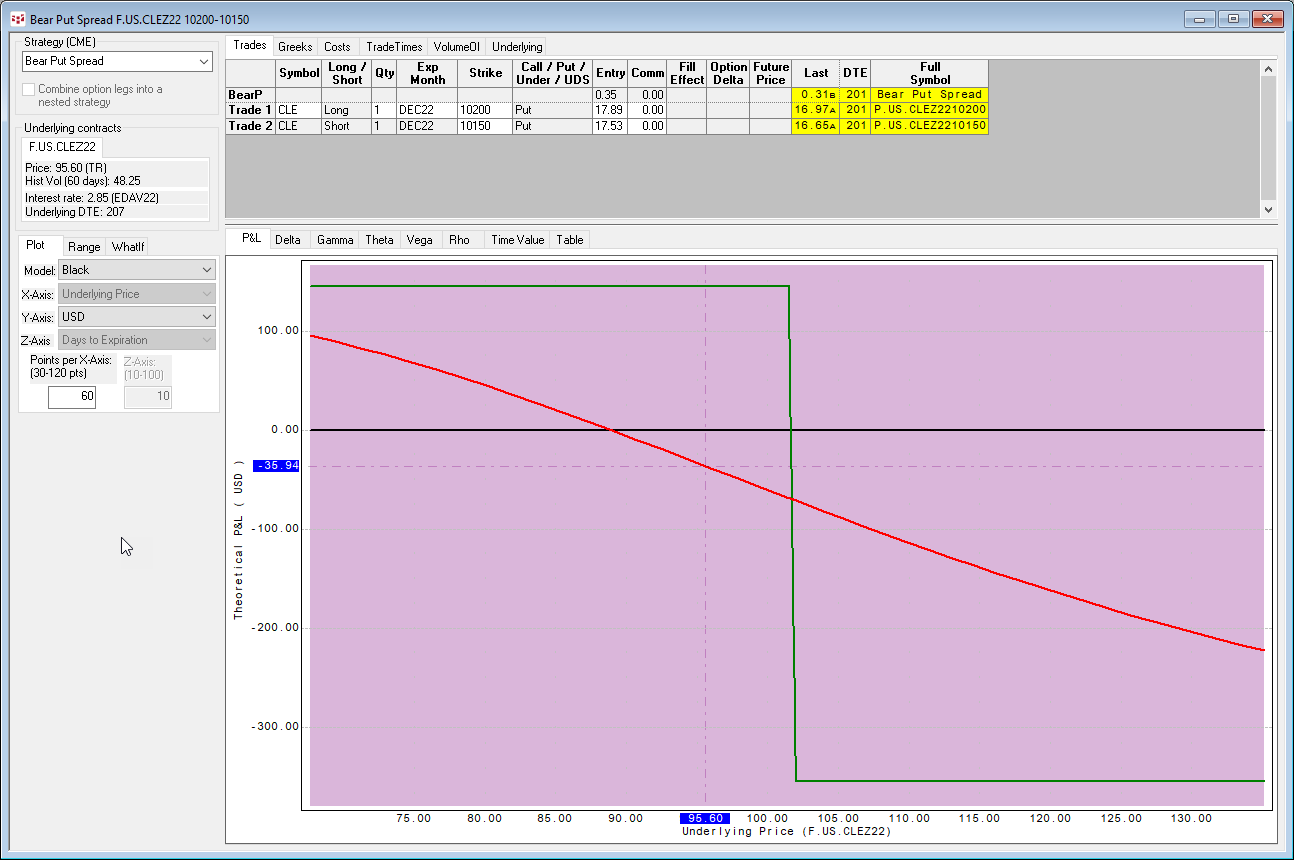
The UDS functionality in CQG Version 2022 has been significantly updated with many more strategies, as well as the available strategies are now grouped by exchanges. This post introduces UDS… more
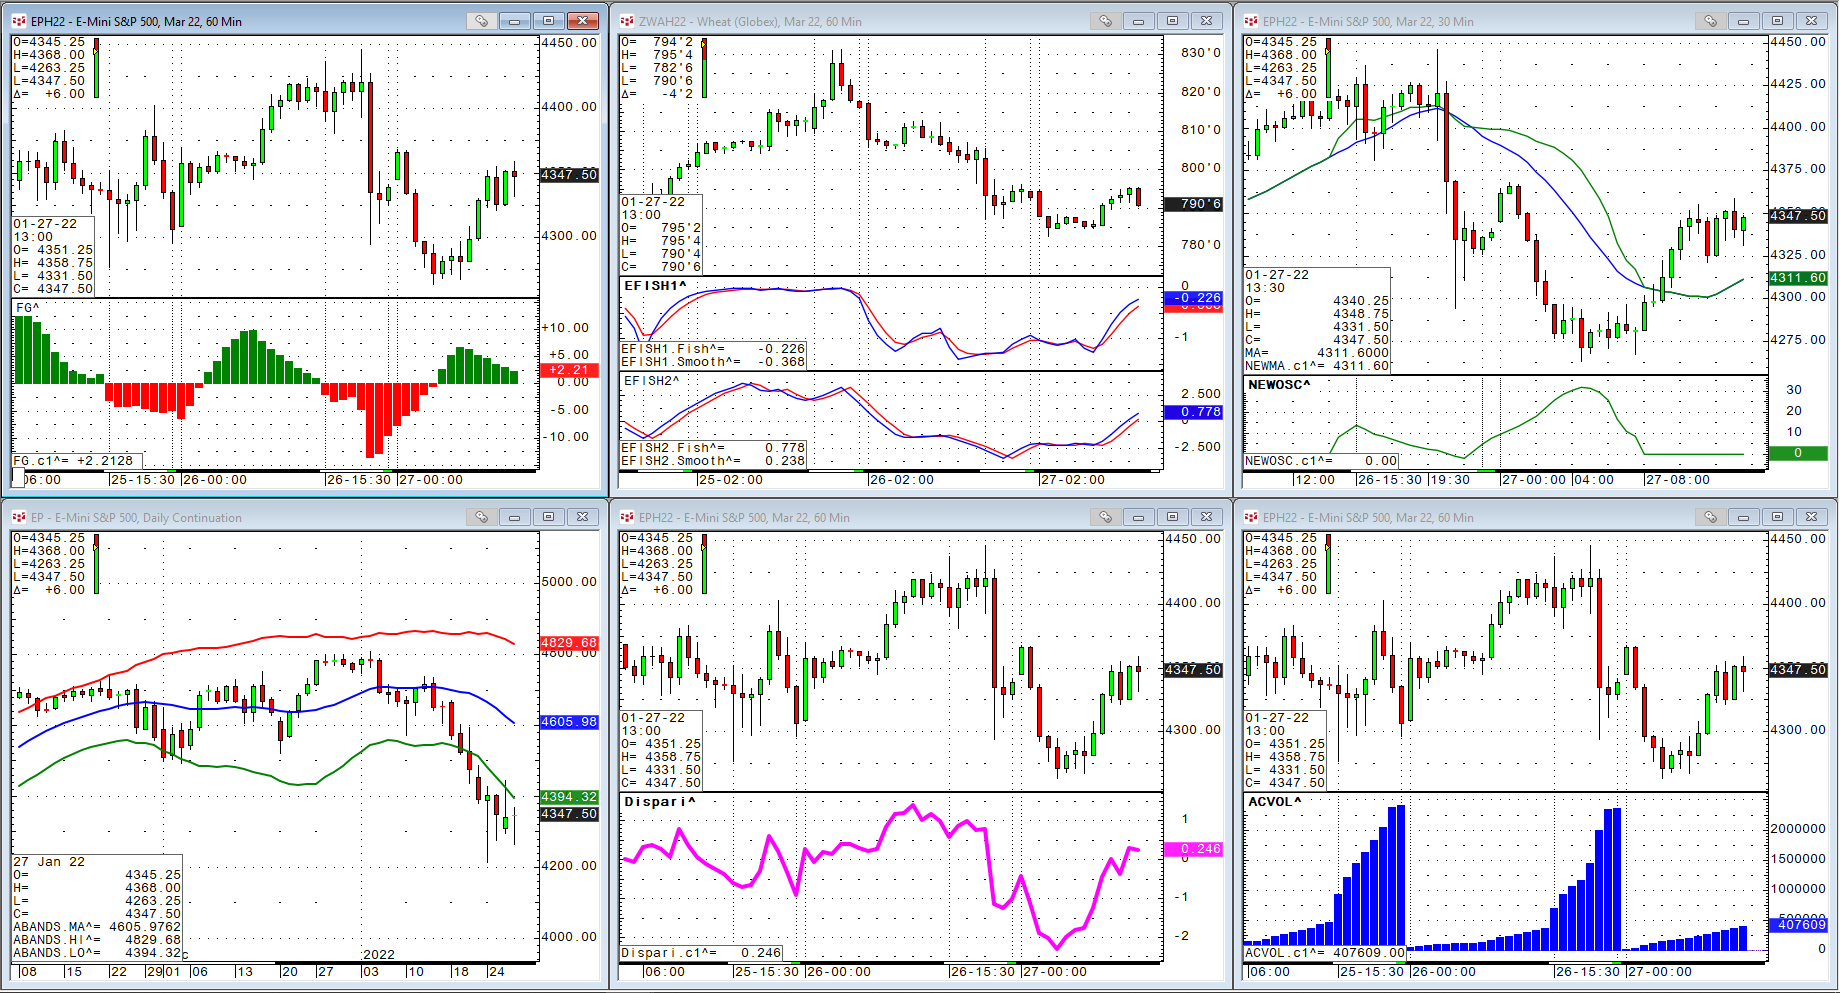
As some kind of review for the last year, I would like to present a few indicators that were coded partly as customer requests or my own research. We had something similar a few years ago: https… more
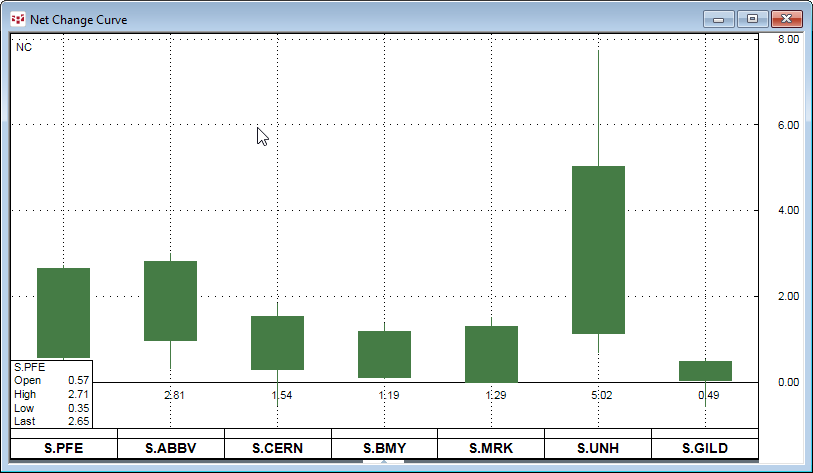
CQG Version 22.12.8002 introduces CQG’s Net Change Curve Chart.
This chart type enables you to compare the current session’s performance of a collection of markets. The above image… more
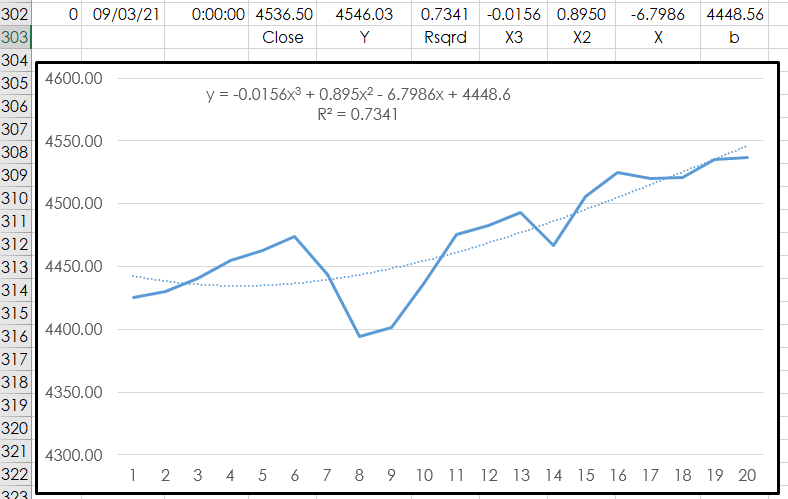
This article walks you through using Microsoft® Excel’s LINEST function to determine the three coefficients and y-intercept of a 3rd order polynomial function over the past 20 bars of closing… more
This post builds upon CQG Product Specialist Helmut Mueller's post titled “Most Wanted Seven Studies Plus a Bonus Trading System.” His post provides a PAC with the following studies:
Chande… more