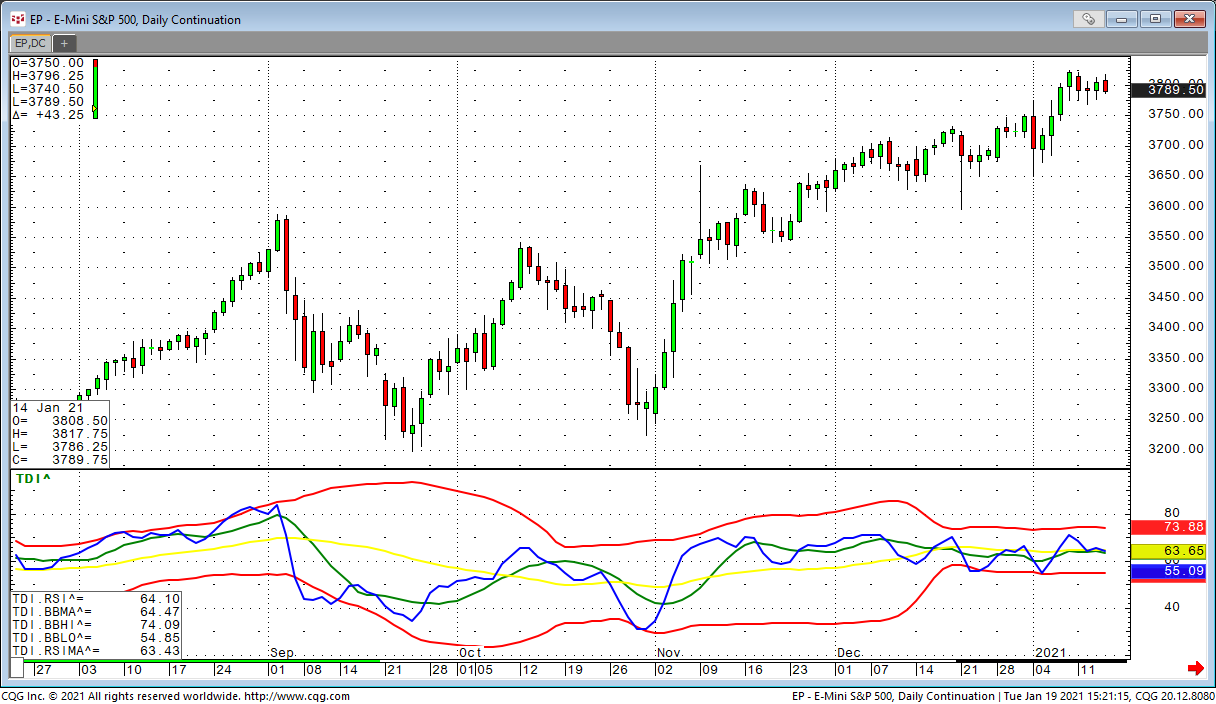
The Trader Dynamic Index is a combination of RSI and Bollinger Bands. We use a 13 period RSI with a tight moving average on top of it and another moving average on top of this. This is some kind… more
CQG PAC Files
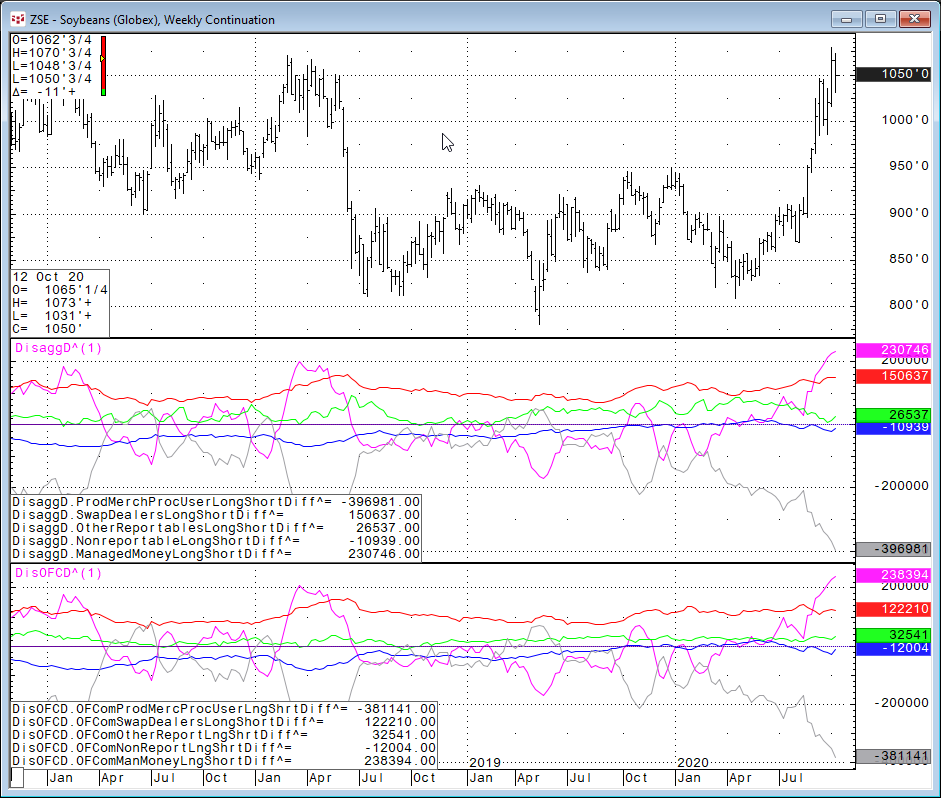
CQG has added more data to the Disaggregated group in the CQG Symbol Finder. Now, both the futures only and the combined futures and options data are available.The Disaggregated reports are broken… more
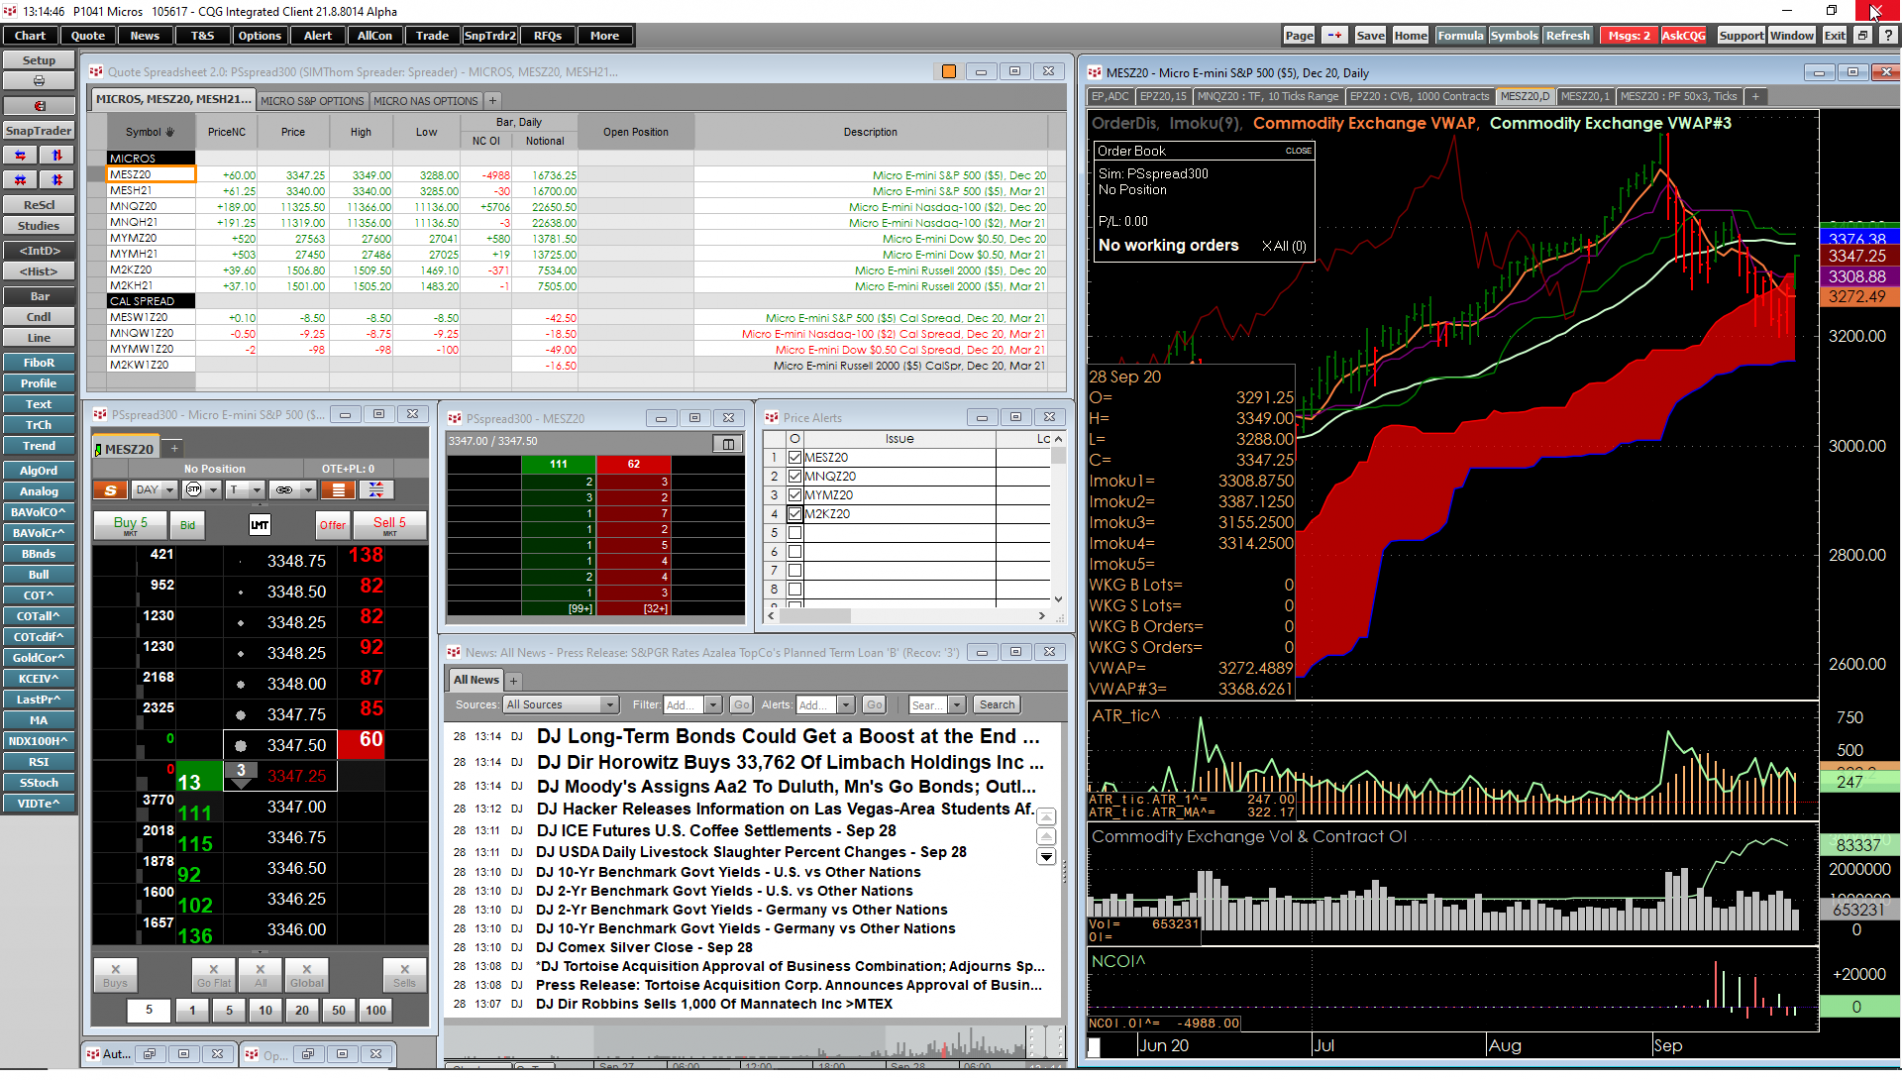
The CME Group has added Options on Micro Futures to their product offerings. These contracts are 1/10 the size of the E-mini futures on the S&P 500, Nasdaq-100, Dow Jones Industrial Average… more
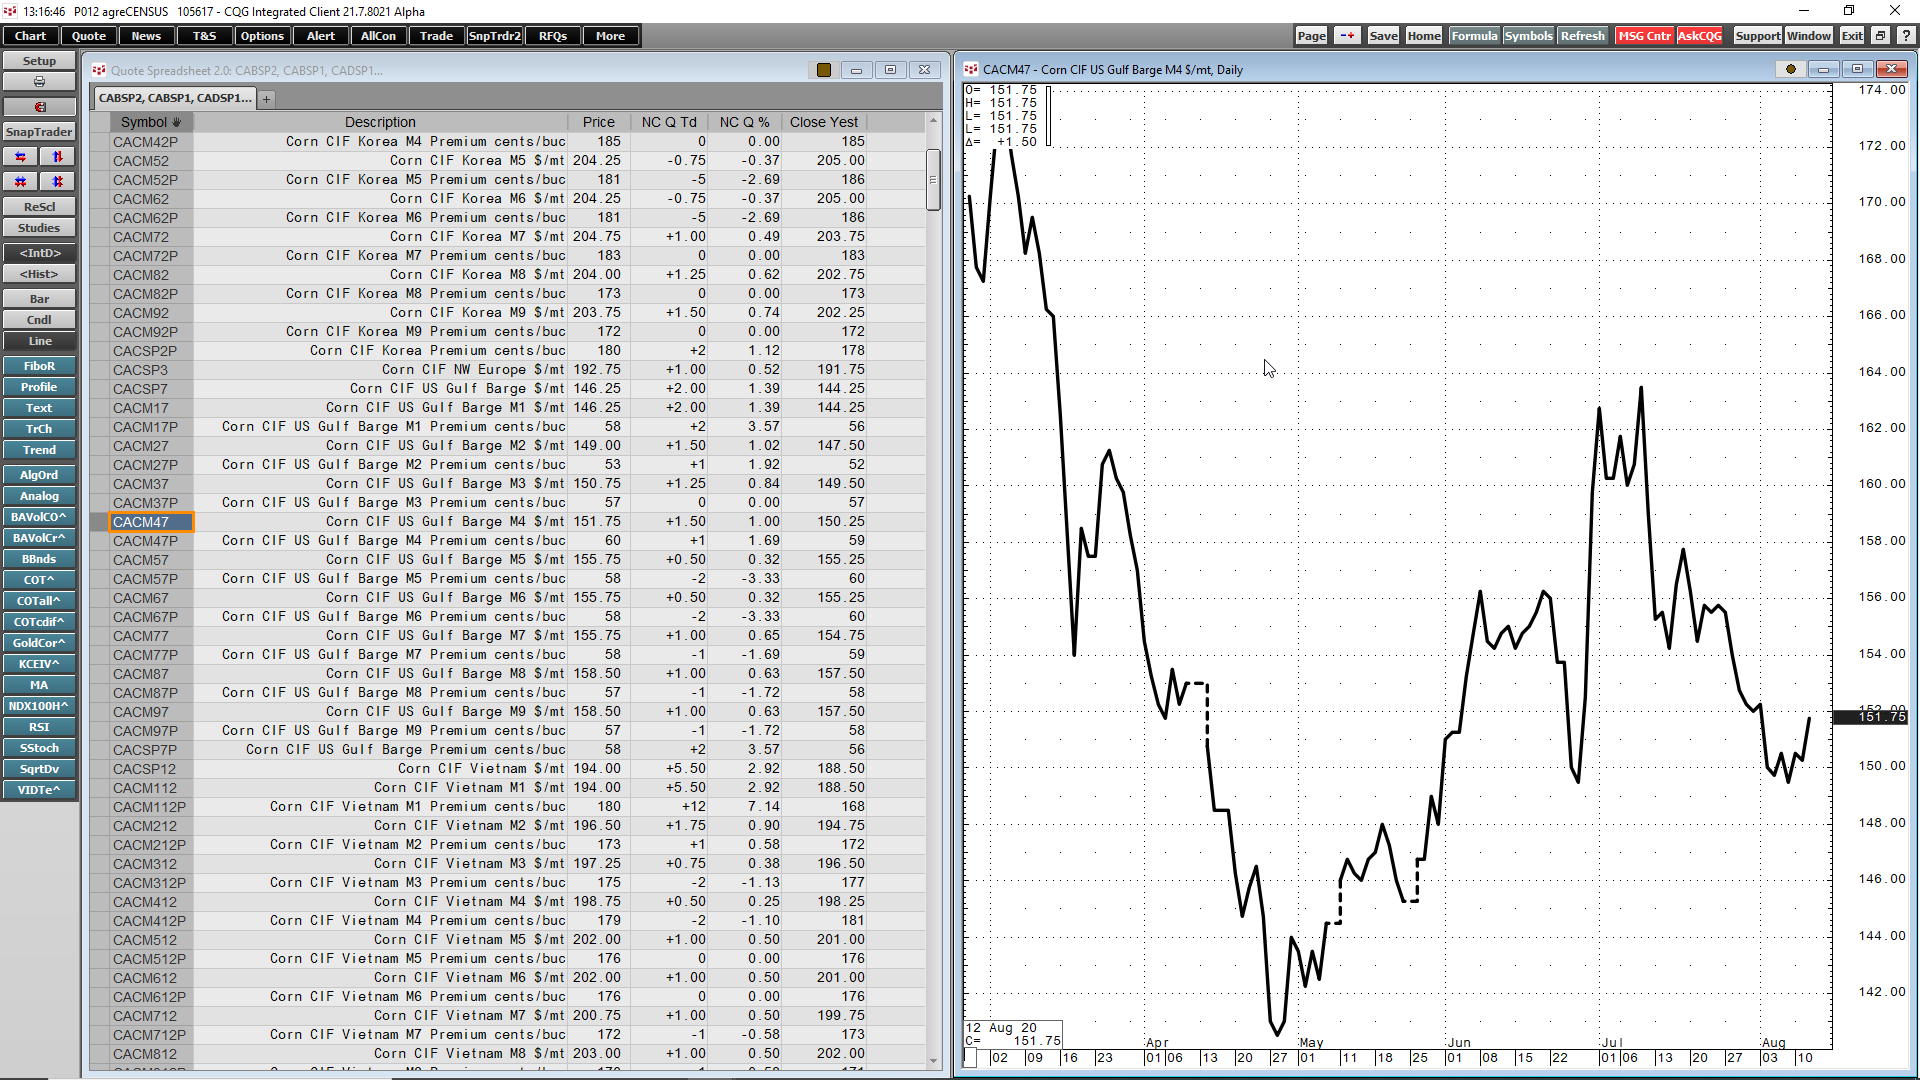
Maintain a global view of the price structure of the agricultural markets through Fastmarkets AgriCENSUS data.
Fastmarkets AgriCENSUS is an independent price reporting agency (PRA) that… more
CQG’s Integrated Client and QTrader Version 2020 offers a new study called the Seasonal Study. This study is very popular with analysts and traders in the agricultural markets because of the… more
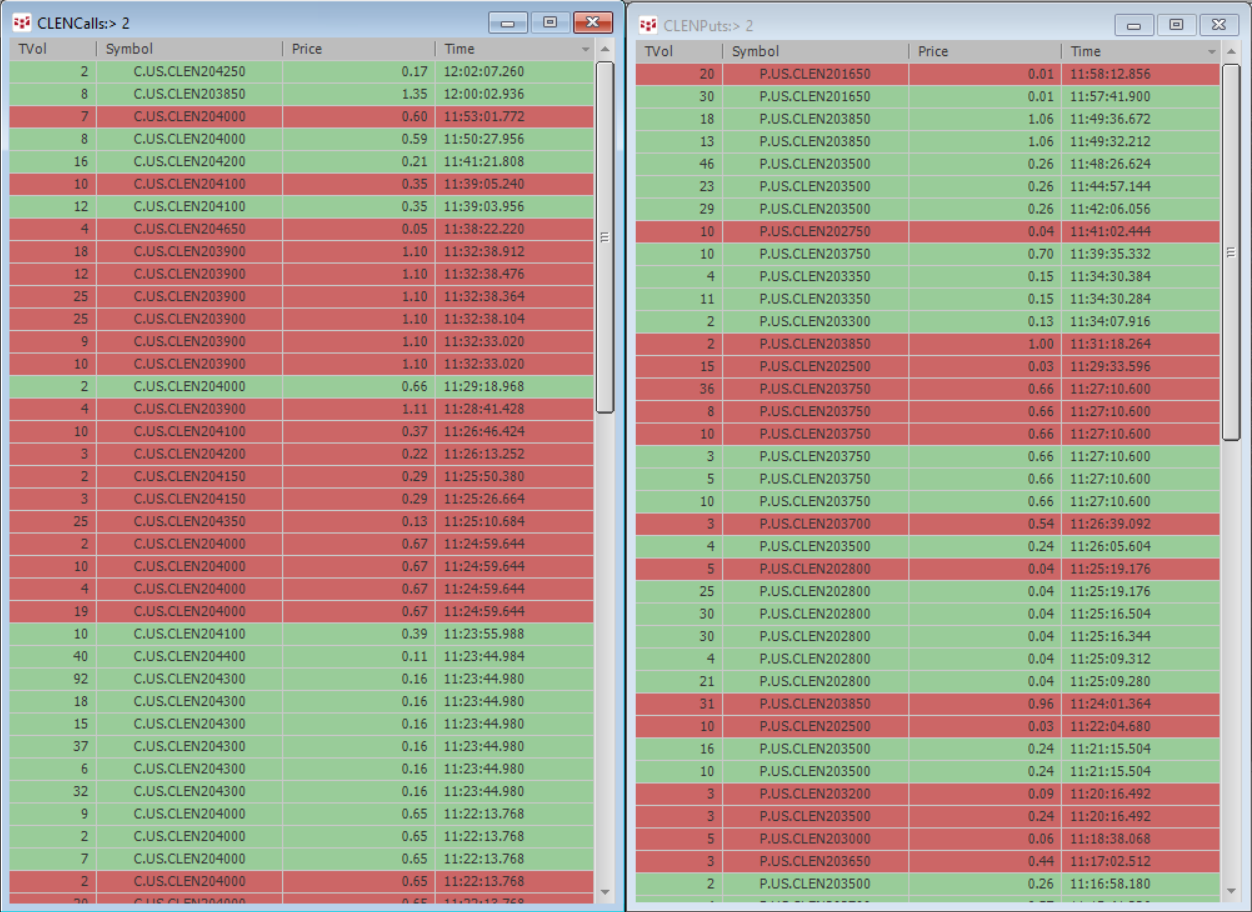
CQG’s Portfolio T&S Monitor displays trades using a time & sales format for a portfolio of instruments. The standard T&S display shows you trading activity for just one instrument.… more
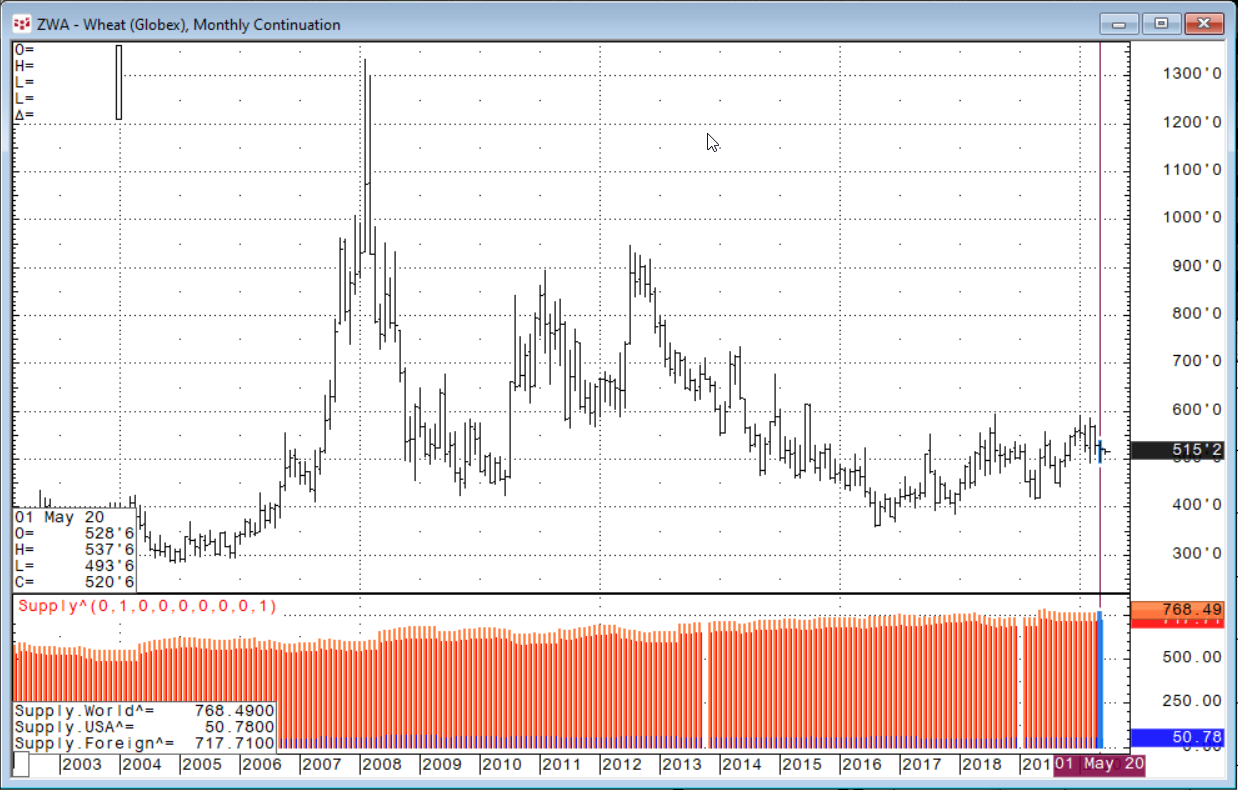
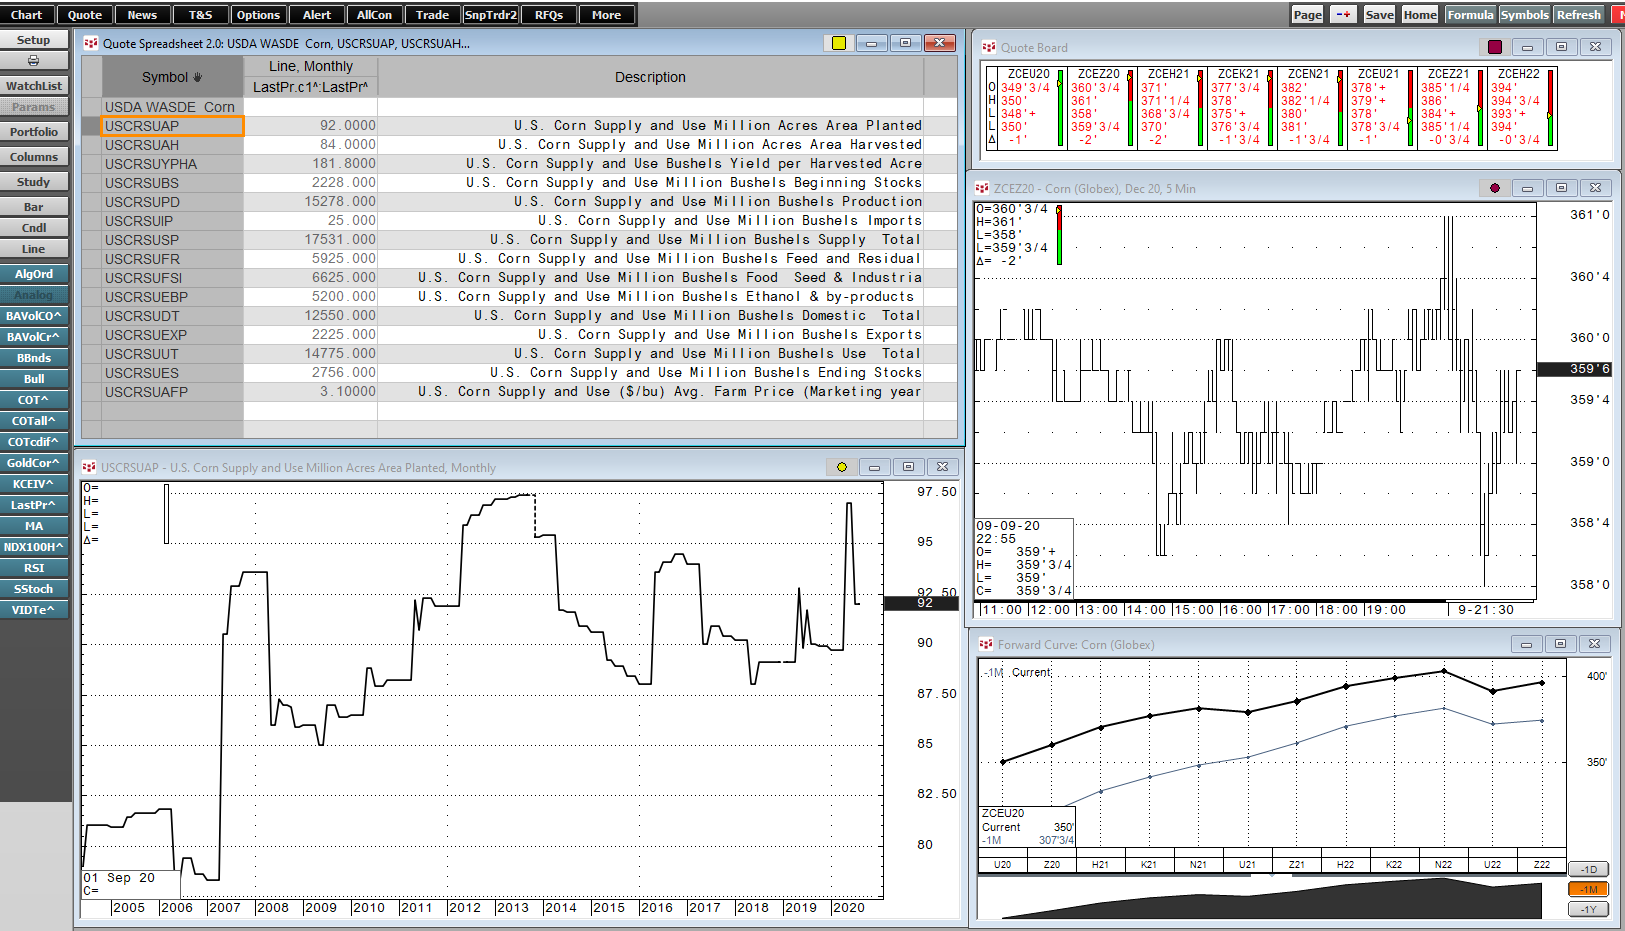
United States Department of Agriculture-World Agriculture Supply and Demand Estimates reports are a critical component to gaining insight into both the international and domestic demand and supply… more
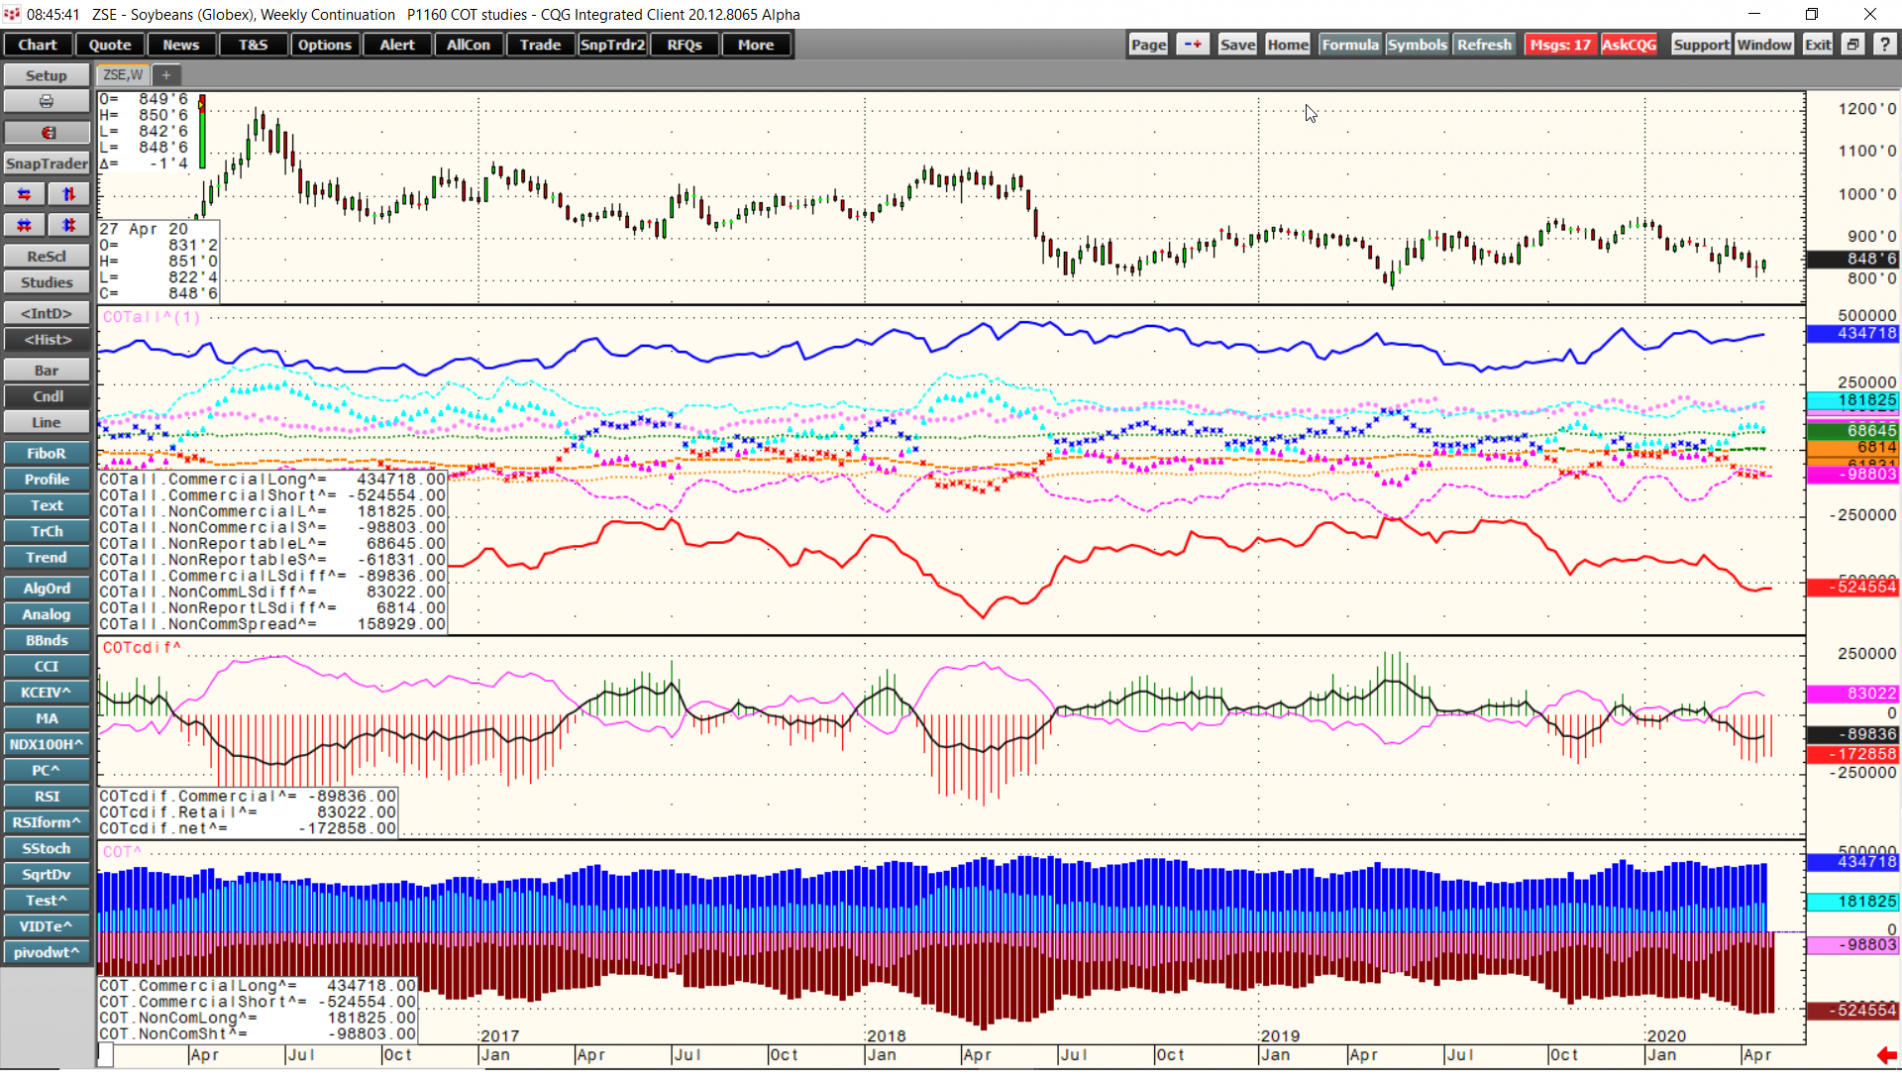
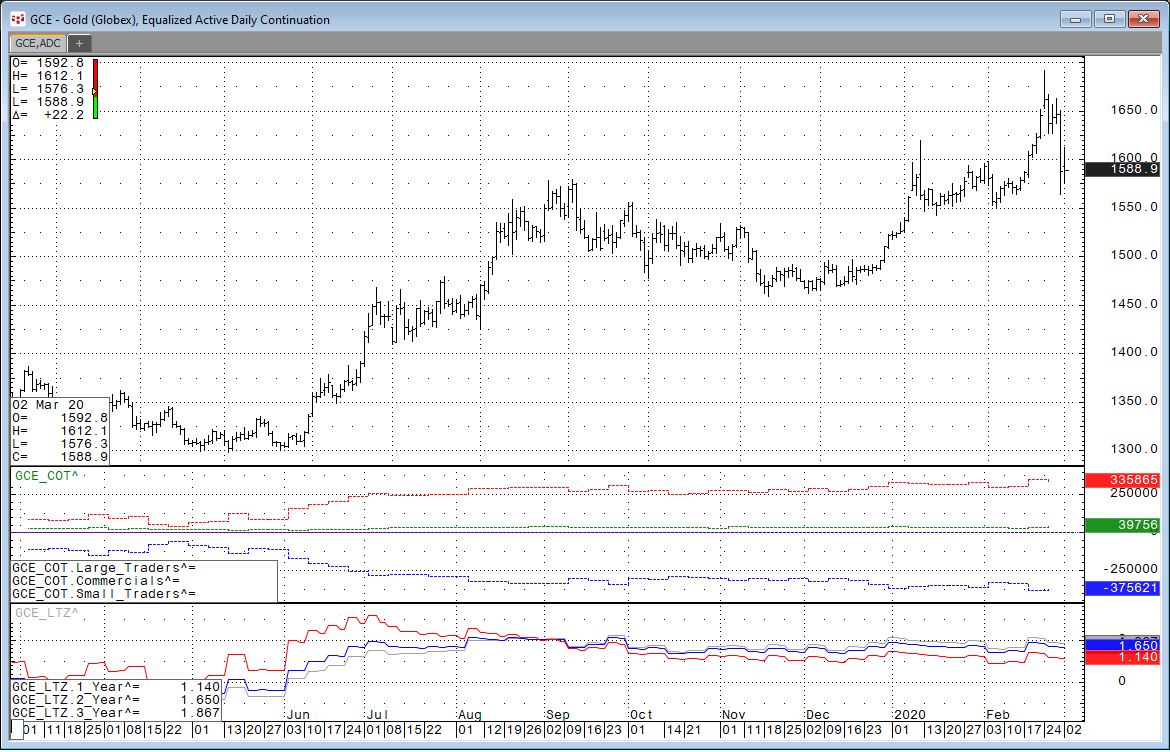
CQG Product Specialist Jim Stavros has created a downloadable CQG PAC that has three new CFTC COT Studies designed to aid in analysis of the COT reports: COTAll, COTcDiff and COT.
COTAll… more
CQG has added the World Agricultural Supply and Demand Estimates (WASDE) data to the data feed. Published monthly by the United States Department of Agriculture (USDA), the World Agricultural… more
CQG has added the CFTC Commitment of Traders reports to the data feed. Under Exchanges in the CQG Symbol Finder you can find “CFTC Commitment of Traders.”
An easy way to find the… more
