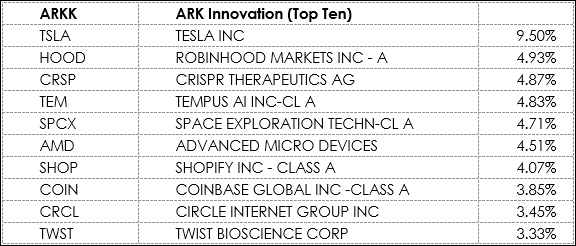
On Workspaces there are four Excel Dashboard for tracking the current session’s performance of four ARK ETFs. The four ETFs added the recent SpaceX IPO: Space Exploration Technologies Corp. Class… more
ETF
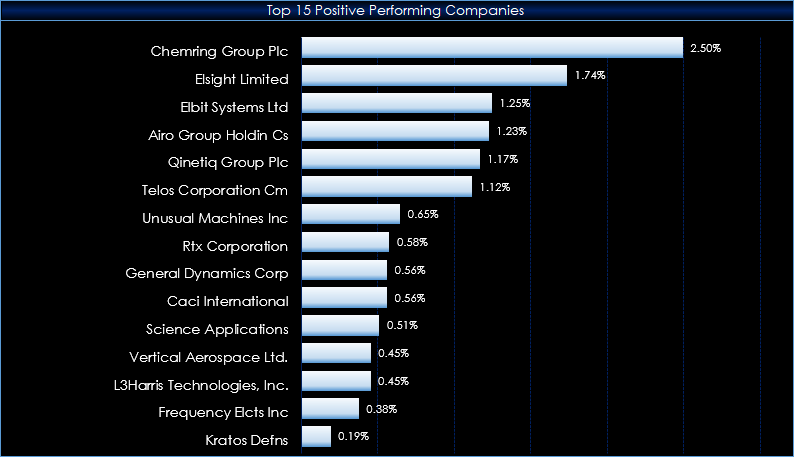
This Excel Dashboard tracks the holdings of the Defiance Drone & Modern Warfare ETF.
From their Web Site:
Modern defense is being reshaped by drones, autonomous systems, and AI-… more
From their website:
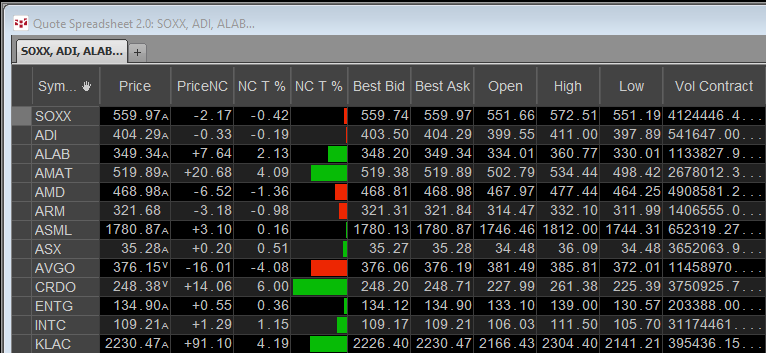
The iShares Semiconductor ETF seeks to track an U.S. equity index of companies in the semiconductor sector. The fund offers a way to invest in companies across the… more
From the iShares website:
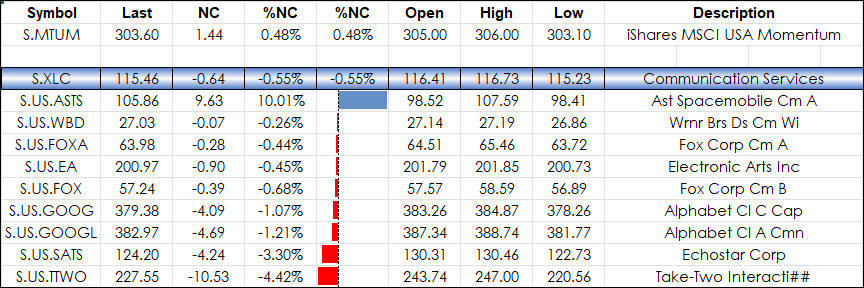
The iShares MSCI USA Momentum Factor ETF (Symbol: MTUM) seeks to track an index of U.S. stocks exhibiting relatively high price momentum. The fund offers a way to… more
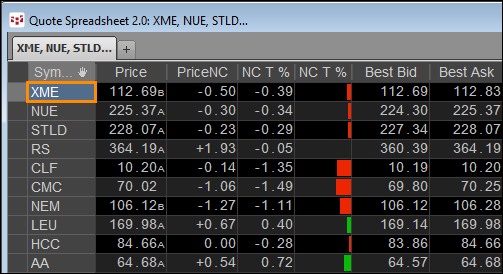
This post details a CQG PAC that is a CQG page that can be downloaded and installed to track the day’s performance of the holdings of the SPDR® S&P® Metals & Mining ETF.
From The… more
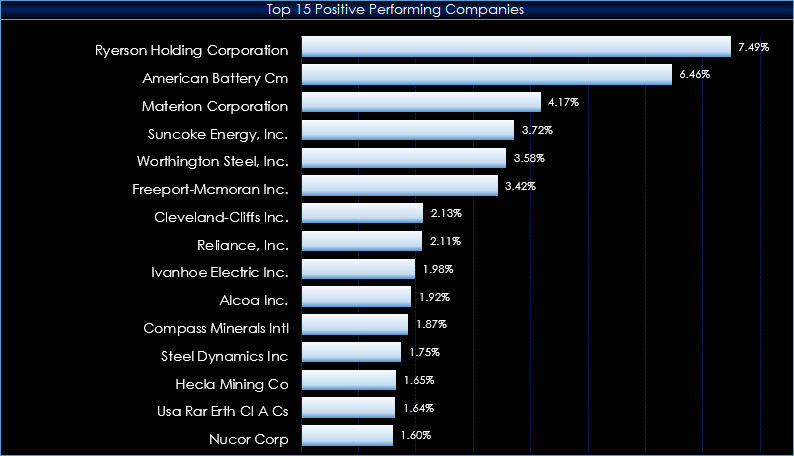
The S&P Metals & Mining Select Industry Index represents the metals and mining sub-industry portion of the S&P Total Market Index. This post details a Microsoft Excel dashboard that… more
The ARK Space & Defense Innovation ETF (Symbol: ARKX) goal is an actively managed ETF seeking long-term growth of capital by investing in domestic and foreign equity securities of companies… more
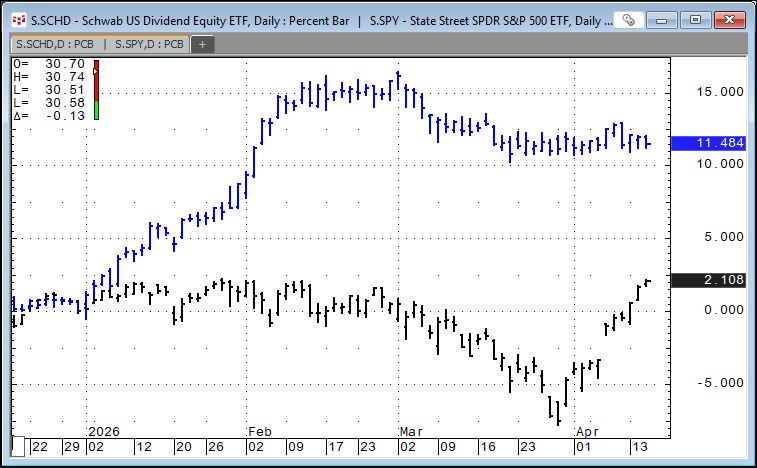
This post details a CQG PAC that is a CQG page that can be downloaded and installed to track the day's performance of the holdings of the Schwab U.S. Dividend Equity ETF (Symbol: SCHD).
From… more
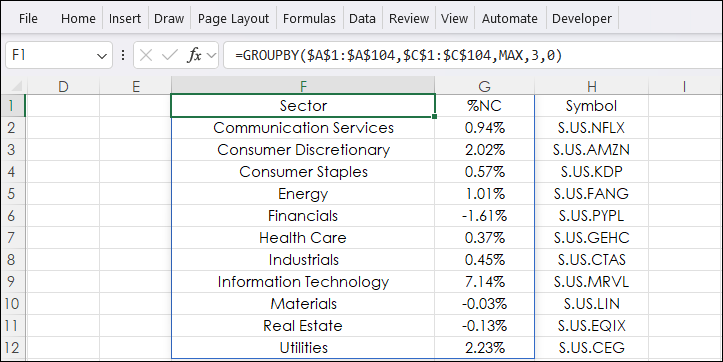
Excel's GROUPBY function offers the ability to create a summary of data. The data can be grouped, aggregated, sorted, and filtered based on the fields you specify.
The syntax of the GROUPBY… more
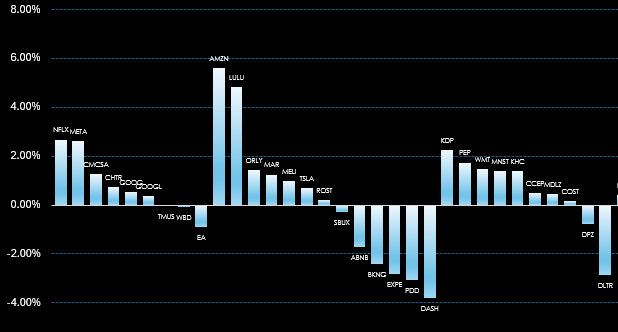
The Excel dashboard at the bottom of the post displays the stocks tracked in the NASDAQ 100 Index broken down by the 11 Global Industry Classification Standard (GICS) sectors.
The NASDAQ 100… more