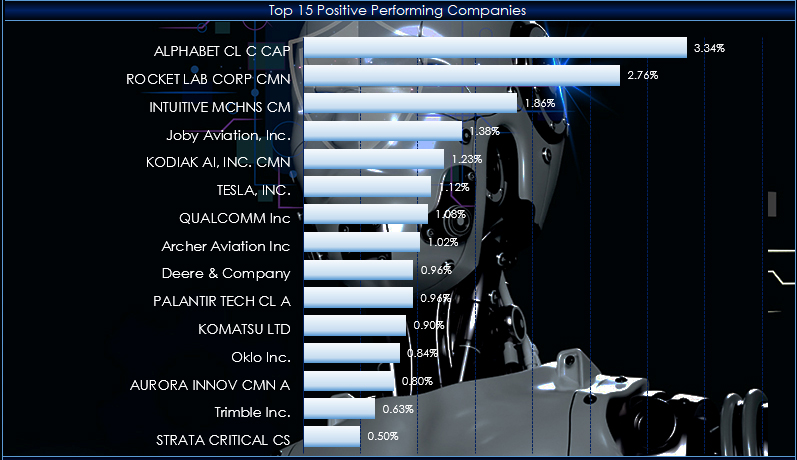
From the ARK website: "Companies within ARKQ are focused on and are expected to substantially benefit from the development of new products or services, technological improvements, and advancements… more
Excel

This post details steps using the Excel CQG RTD Toolkit Add-in to pull in open interest data for an options series based on the same expiration. These same steps can be used to pull in other… more
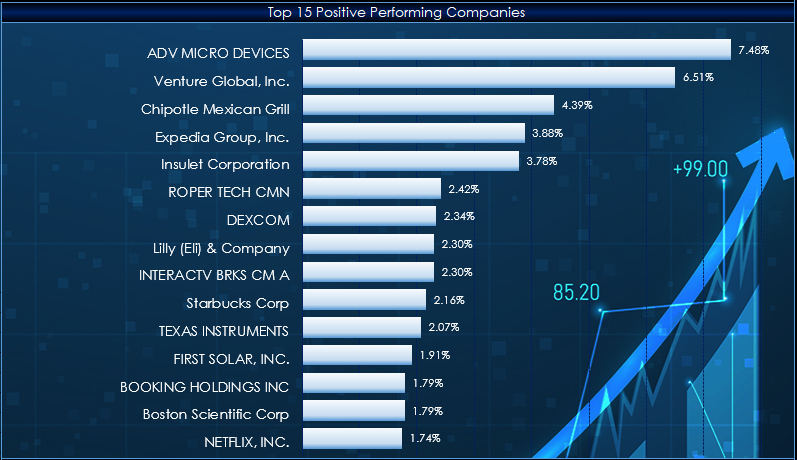
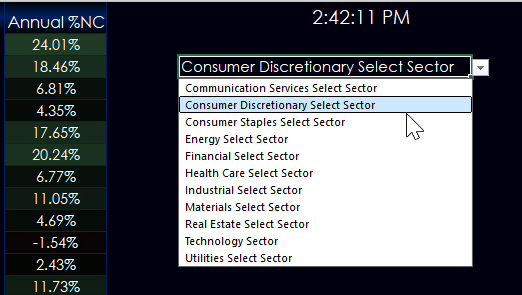
This post offers two Excel dashboards for tracking the holdings of the Vanguard Information Technology ETF. The fund tracks the performance of the CRSP US Large Cap Growth Index.
It uses a… more
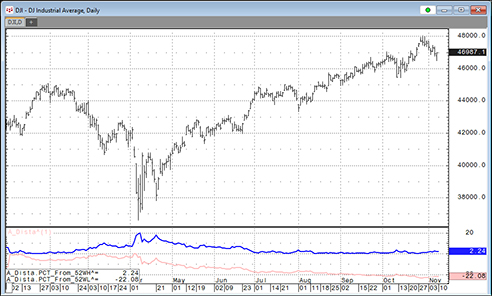
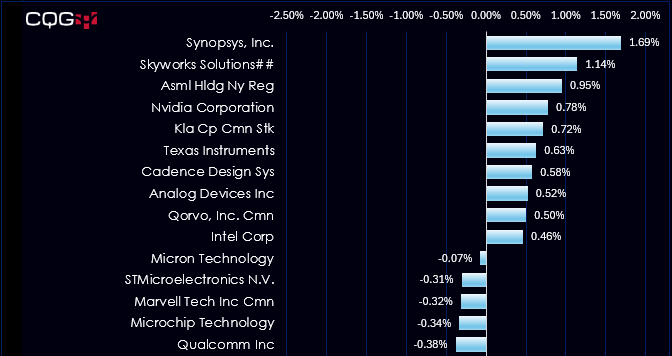
This post offers a downloadable CQG PAC for IC and QTrader and Excel dashboard that includes two custom studies that track a market's performance by measuring the price difference between the… more
This post offers two Excel dashboards for tracking the holdings of the Vanguard Information Technology ETF. The fund tracks a market cap-weighted index of companies in the US information… more
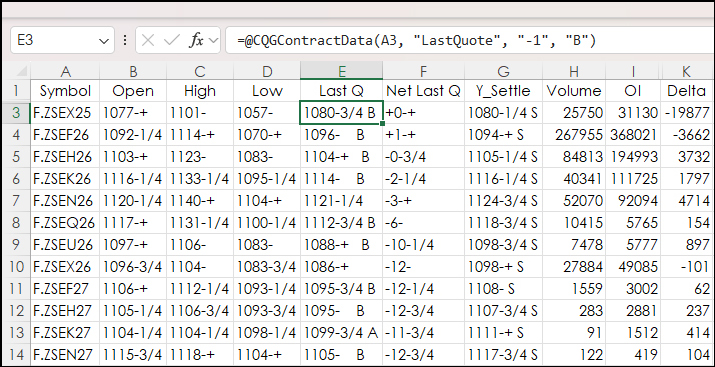
A popular quote display for following a group of contracts in a particular commodity is the CQG All Contracts display. This post details the steps to replicating this display in Excel.
First… more
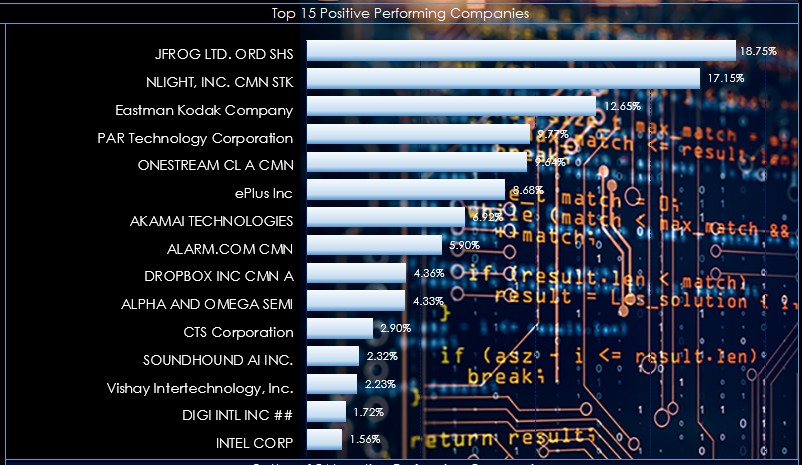
This post "Top Ten Performing ETFs for the Last Ten Years" listed the top performing ETFs since January 2015.
The top performer was VanEck Semiconductor ETF, symbol: SMH.
The VanEck… more
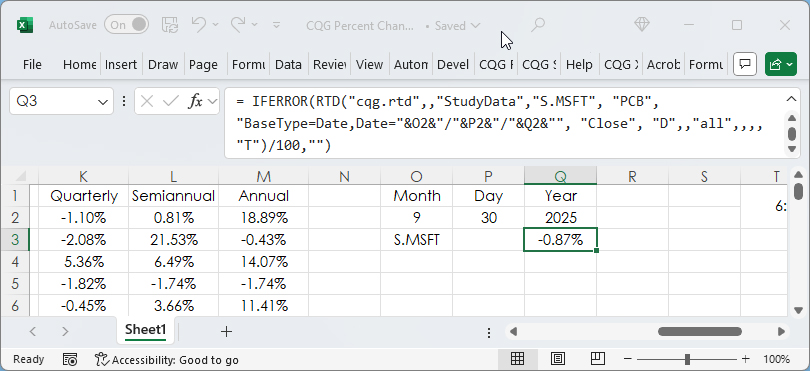
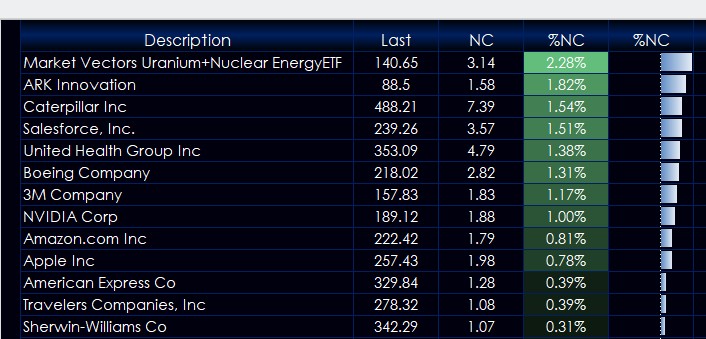
Percent Net Change is a key technique for comparing market performance among a group of markets. This post is an overview of the various Excel RTD formulas available for calculating percent net… more
This post builds upon the previous post: Excel 365 TRIMRANGE Function.
That post detailed how to build a quote display using the TRIMRANGE function to automatically manage working with… more
Microsoft Excel 365 offers the TRIMRANGE function which excludes all empty rows and/or columns from the outer edges of a range or array. This post details how this function is useful for designing… more